Article

Investing Can Feel Turbulent

Investing Can Feel Turbulent

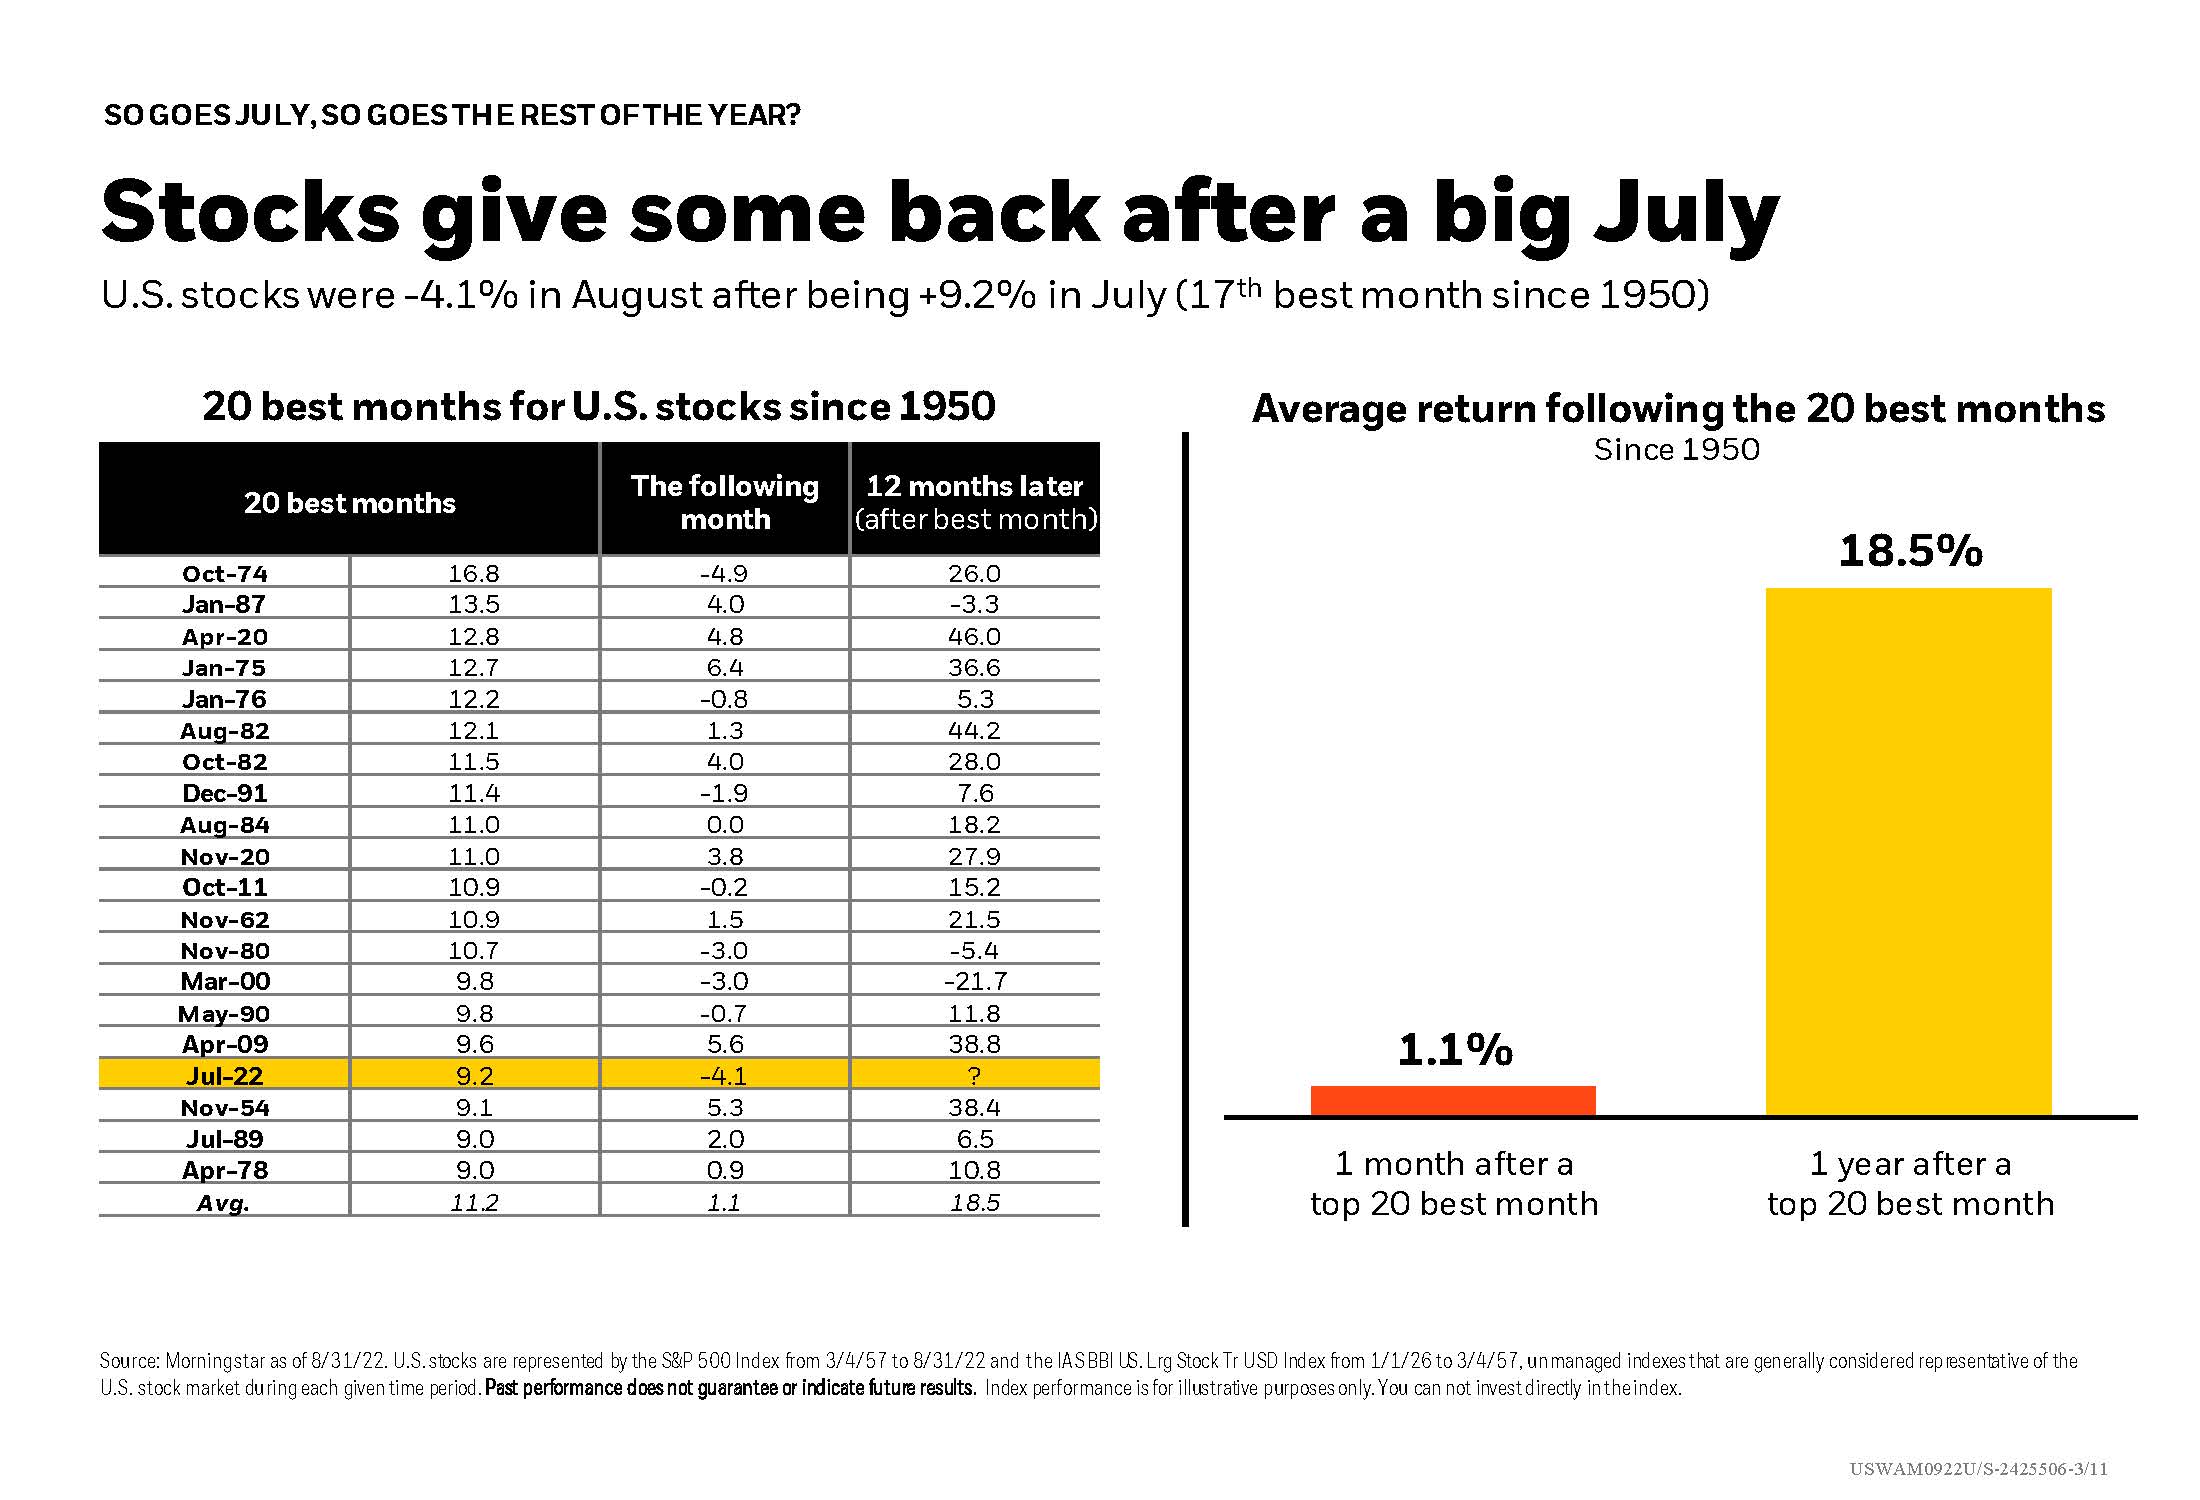
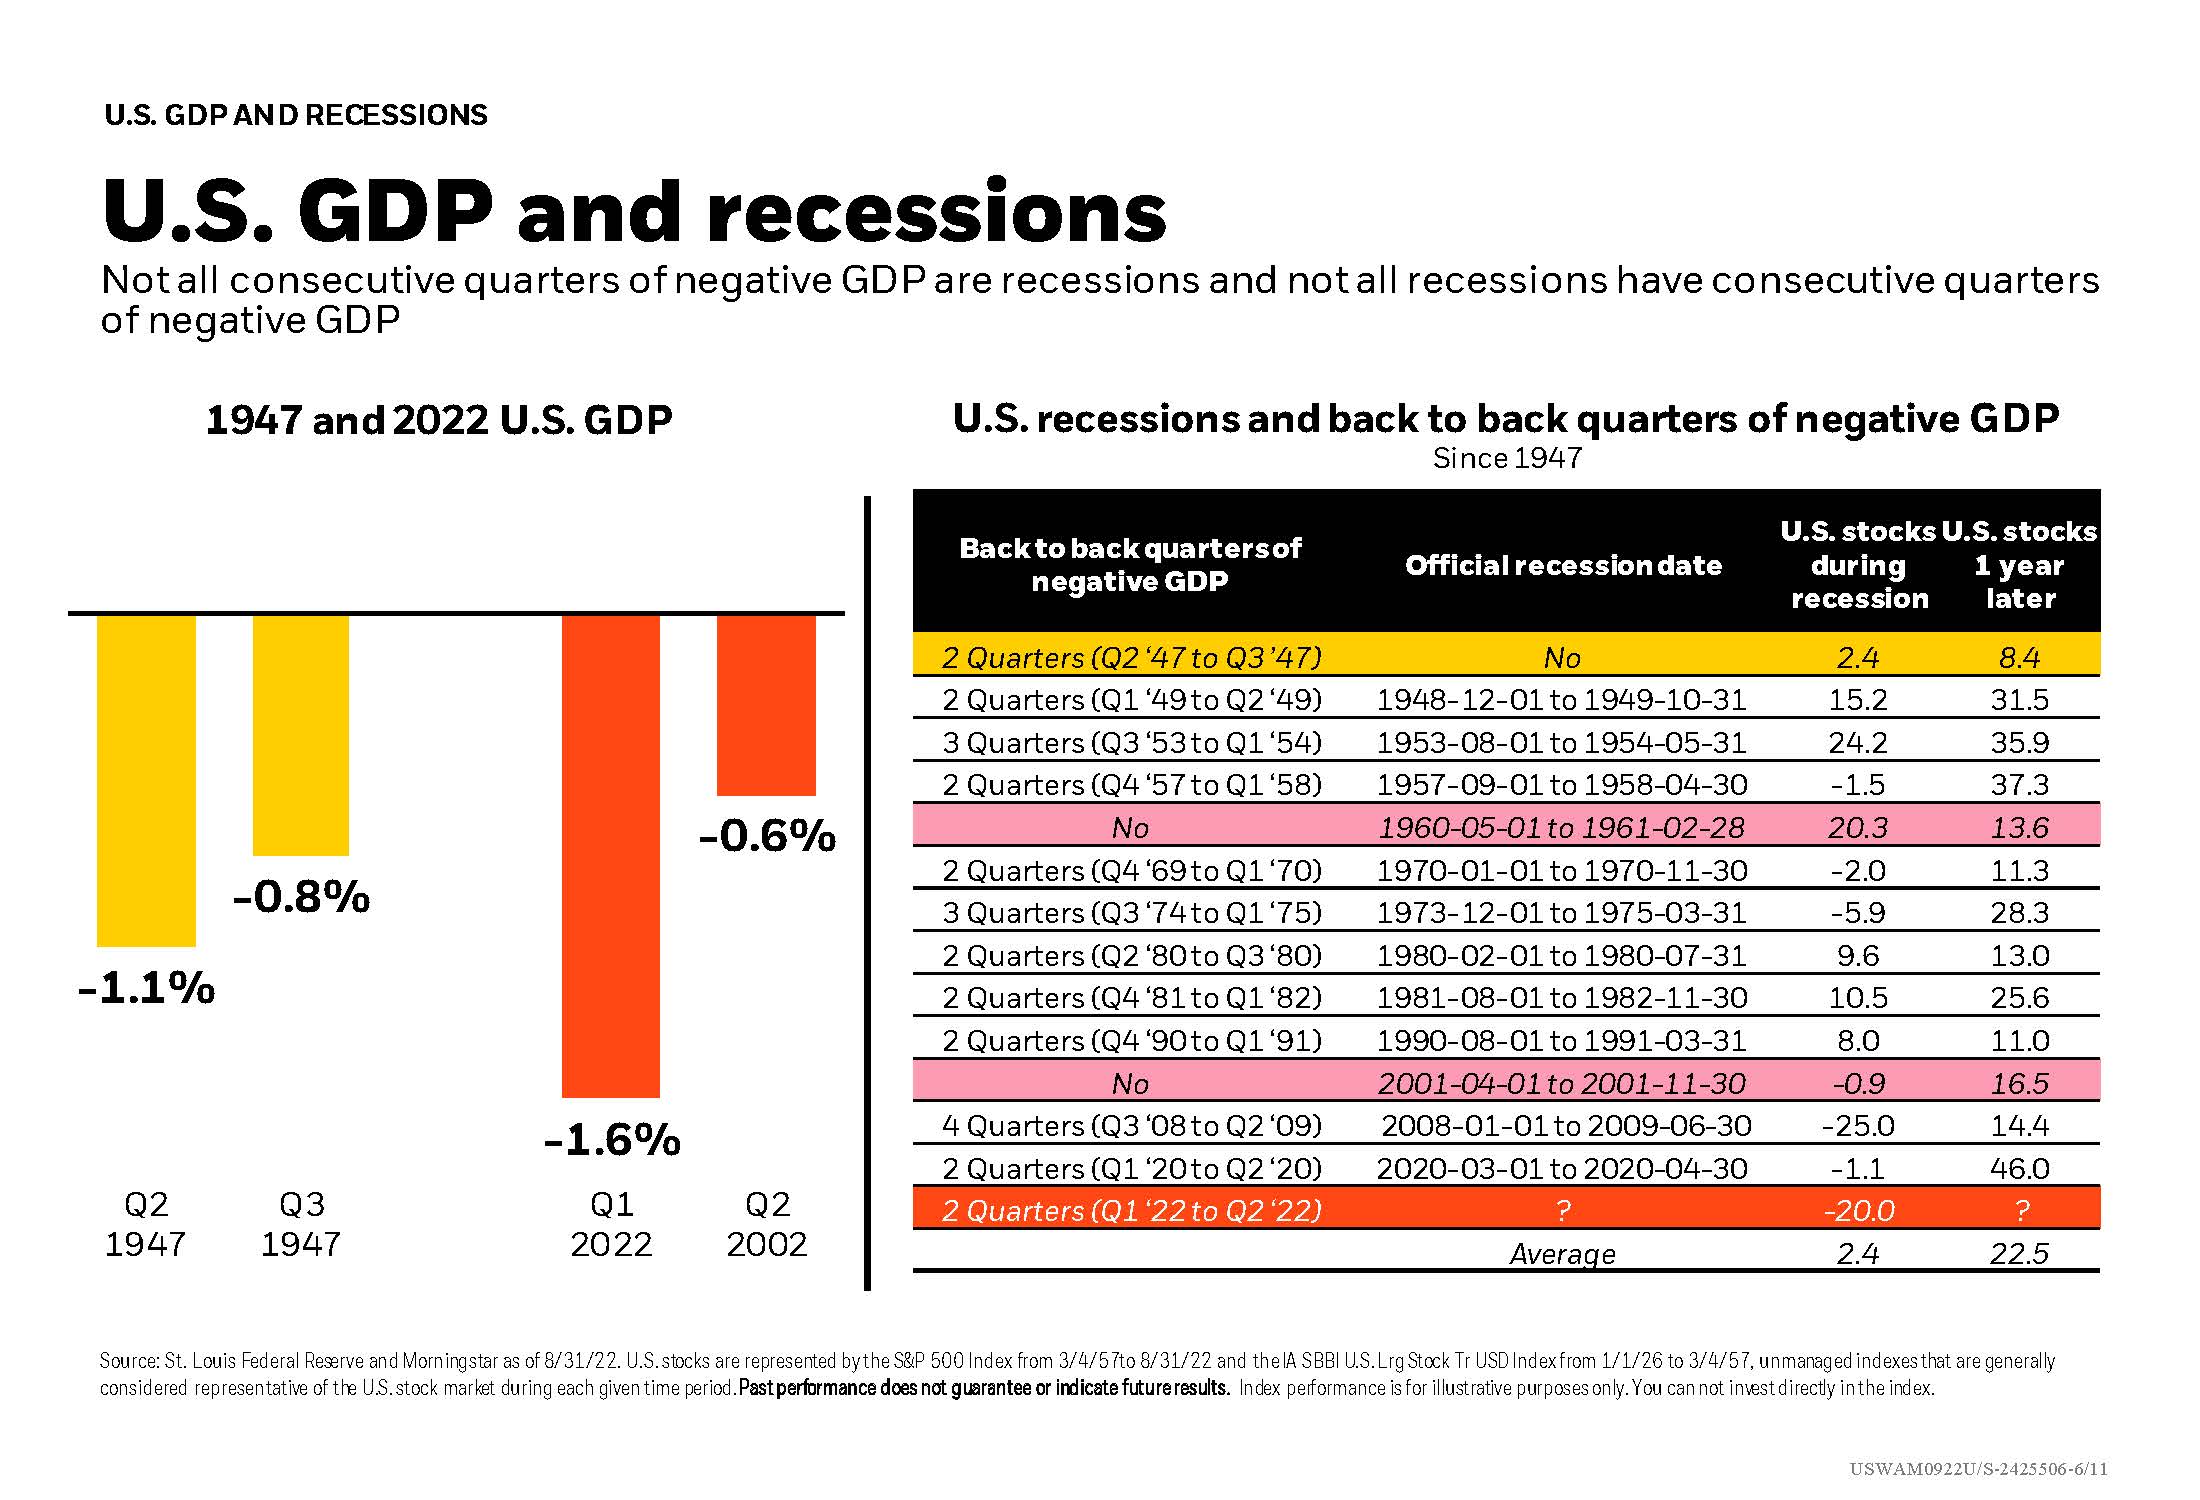
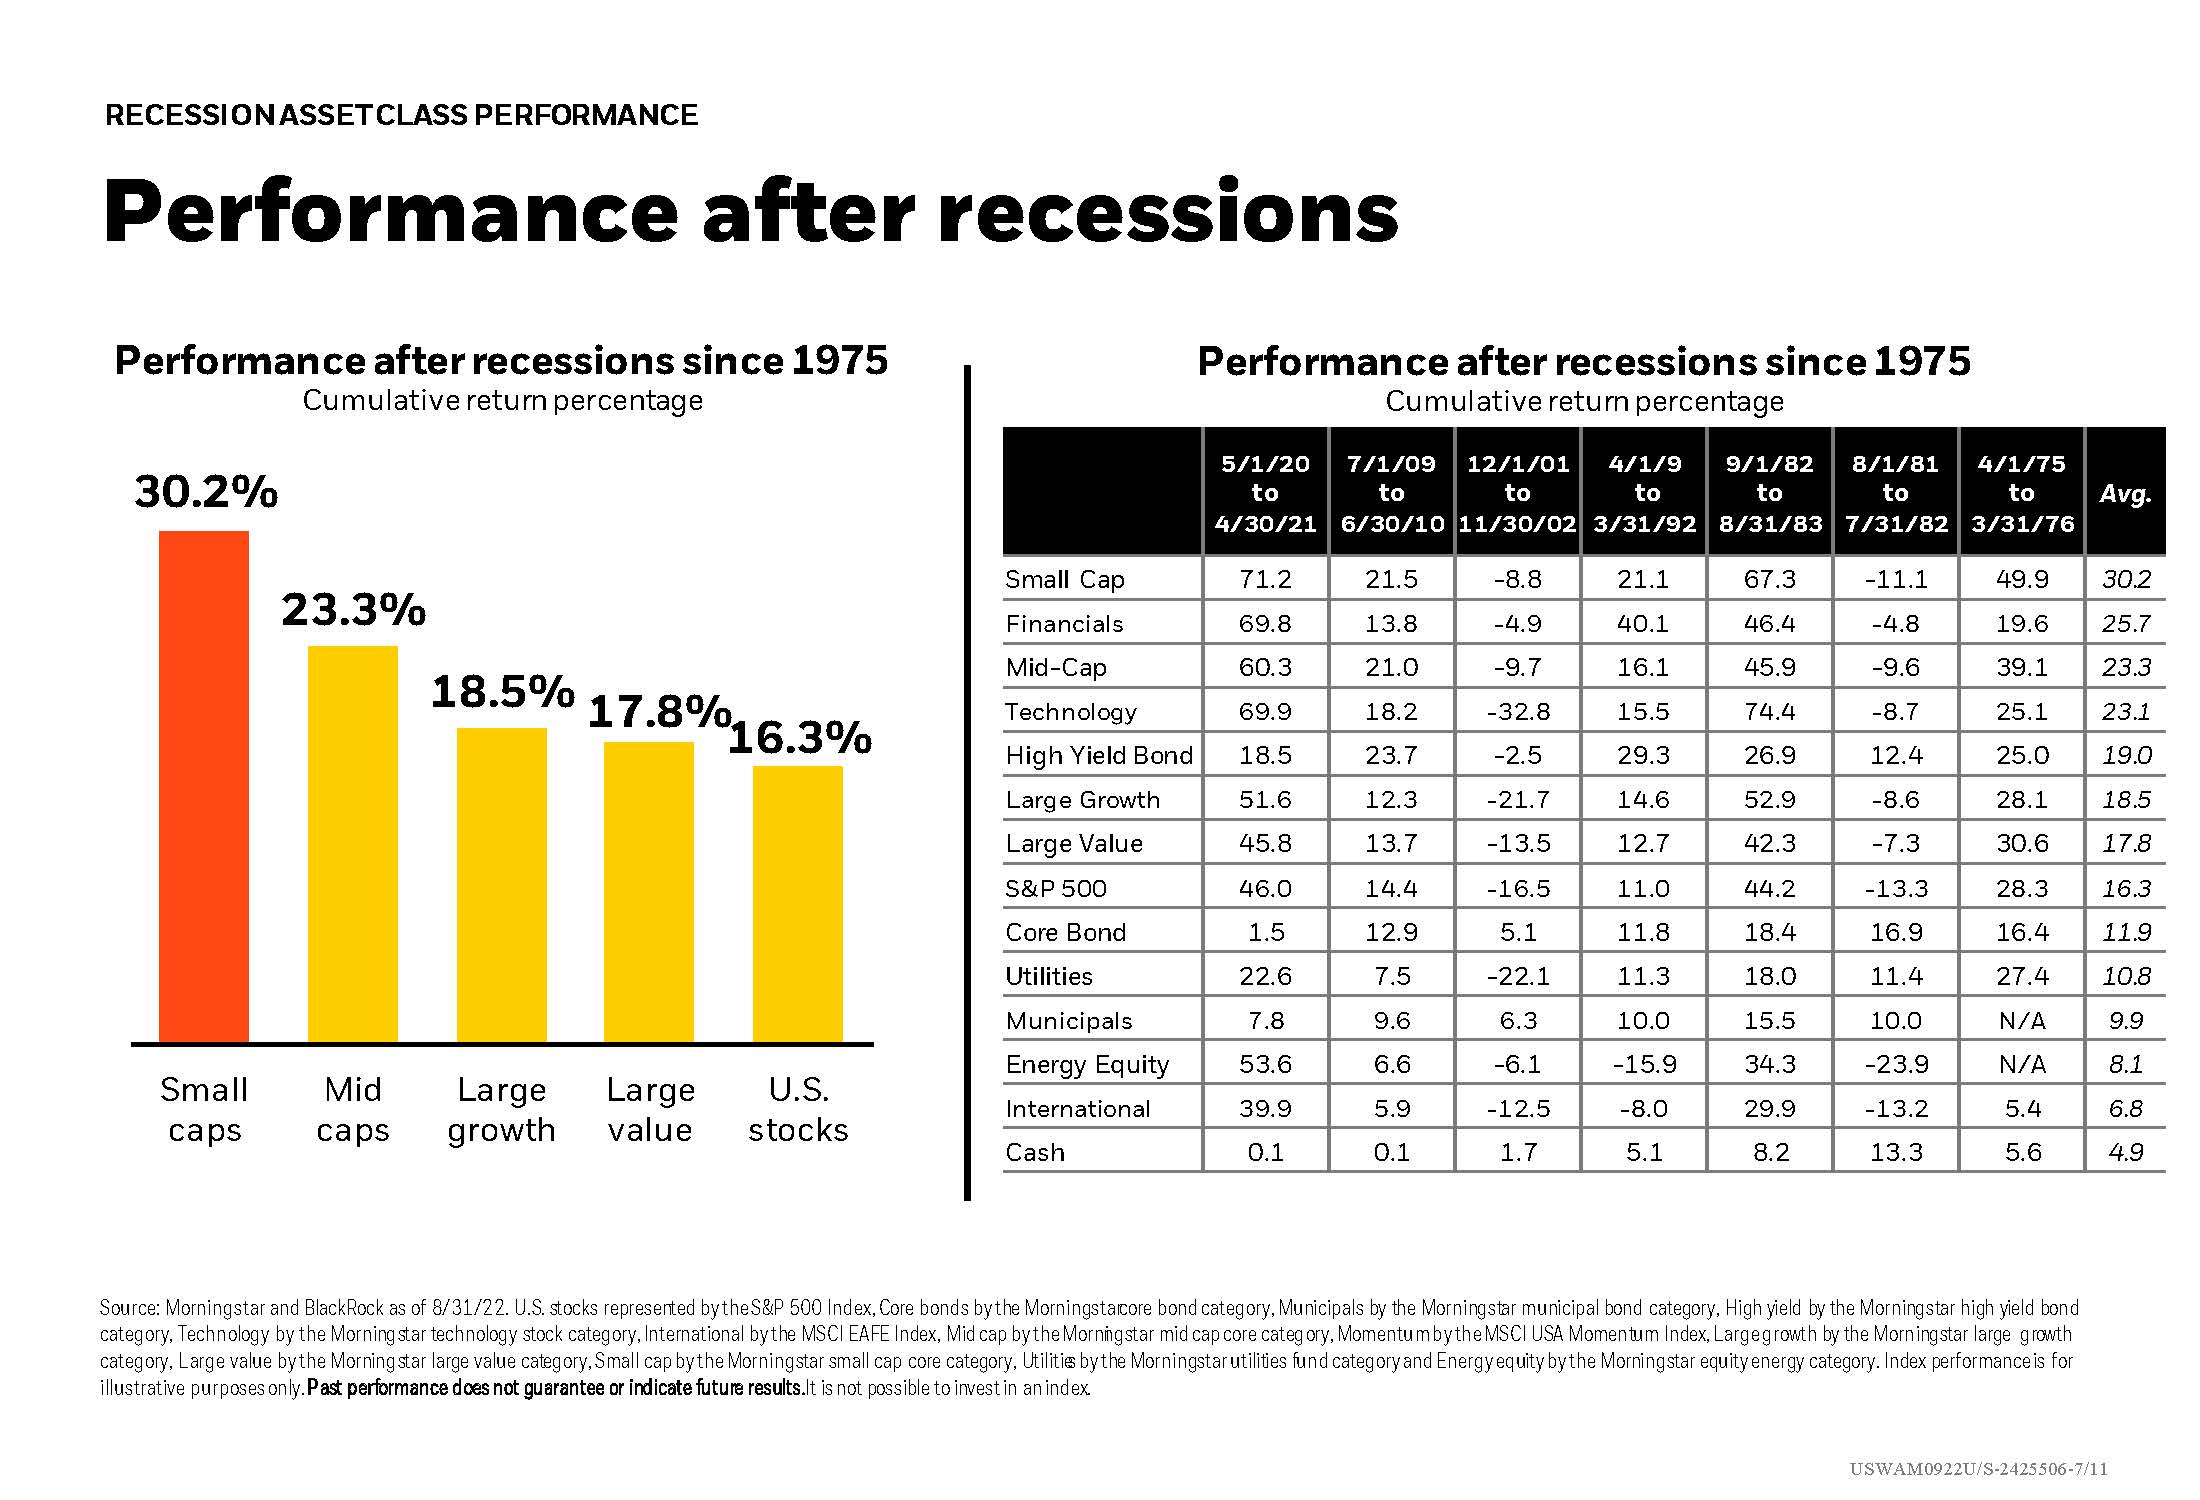
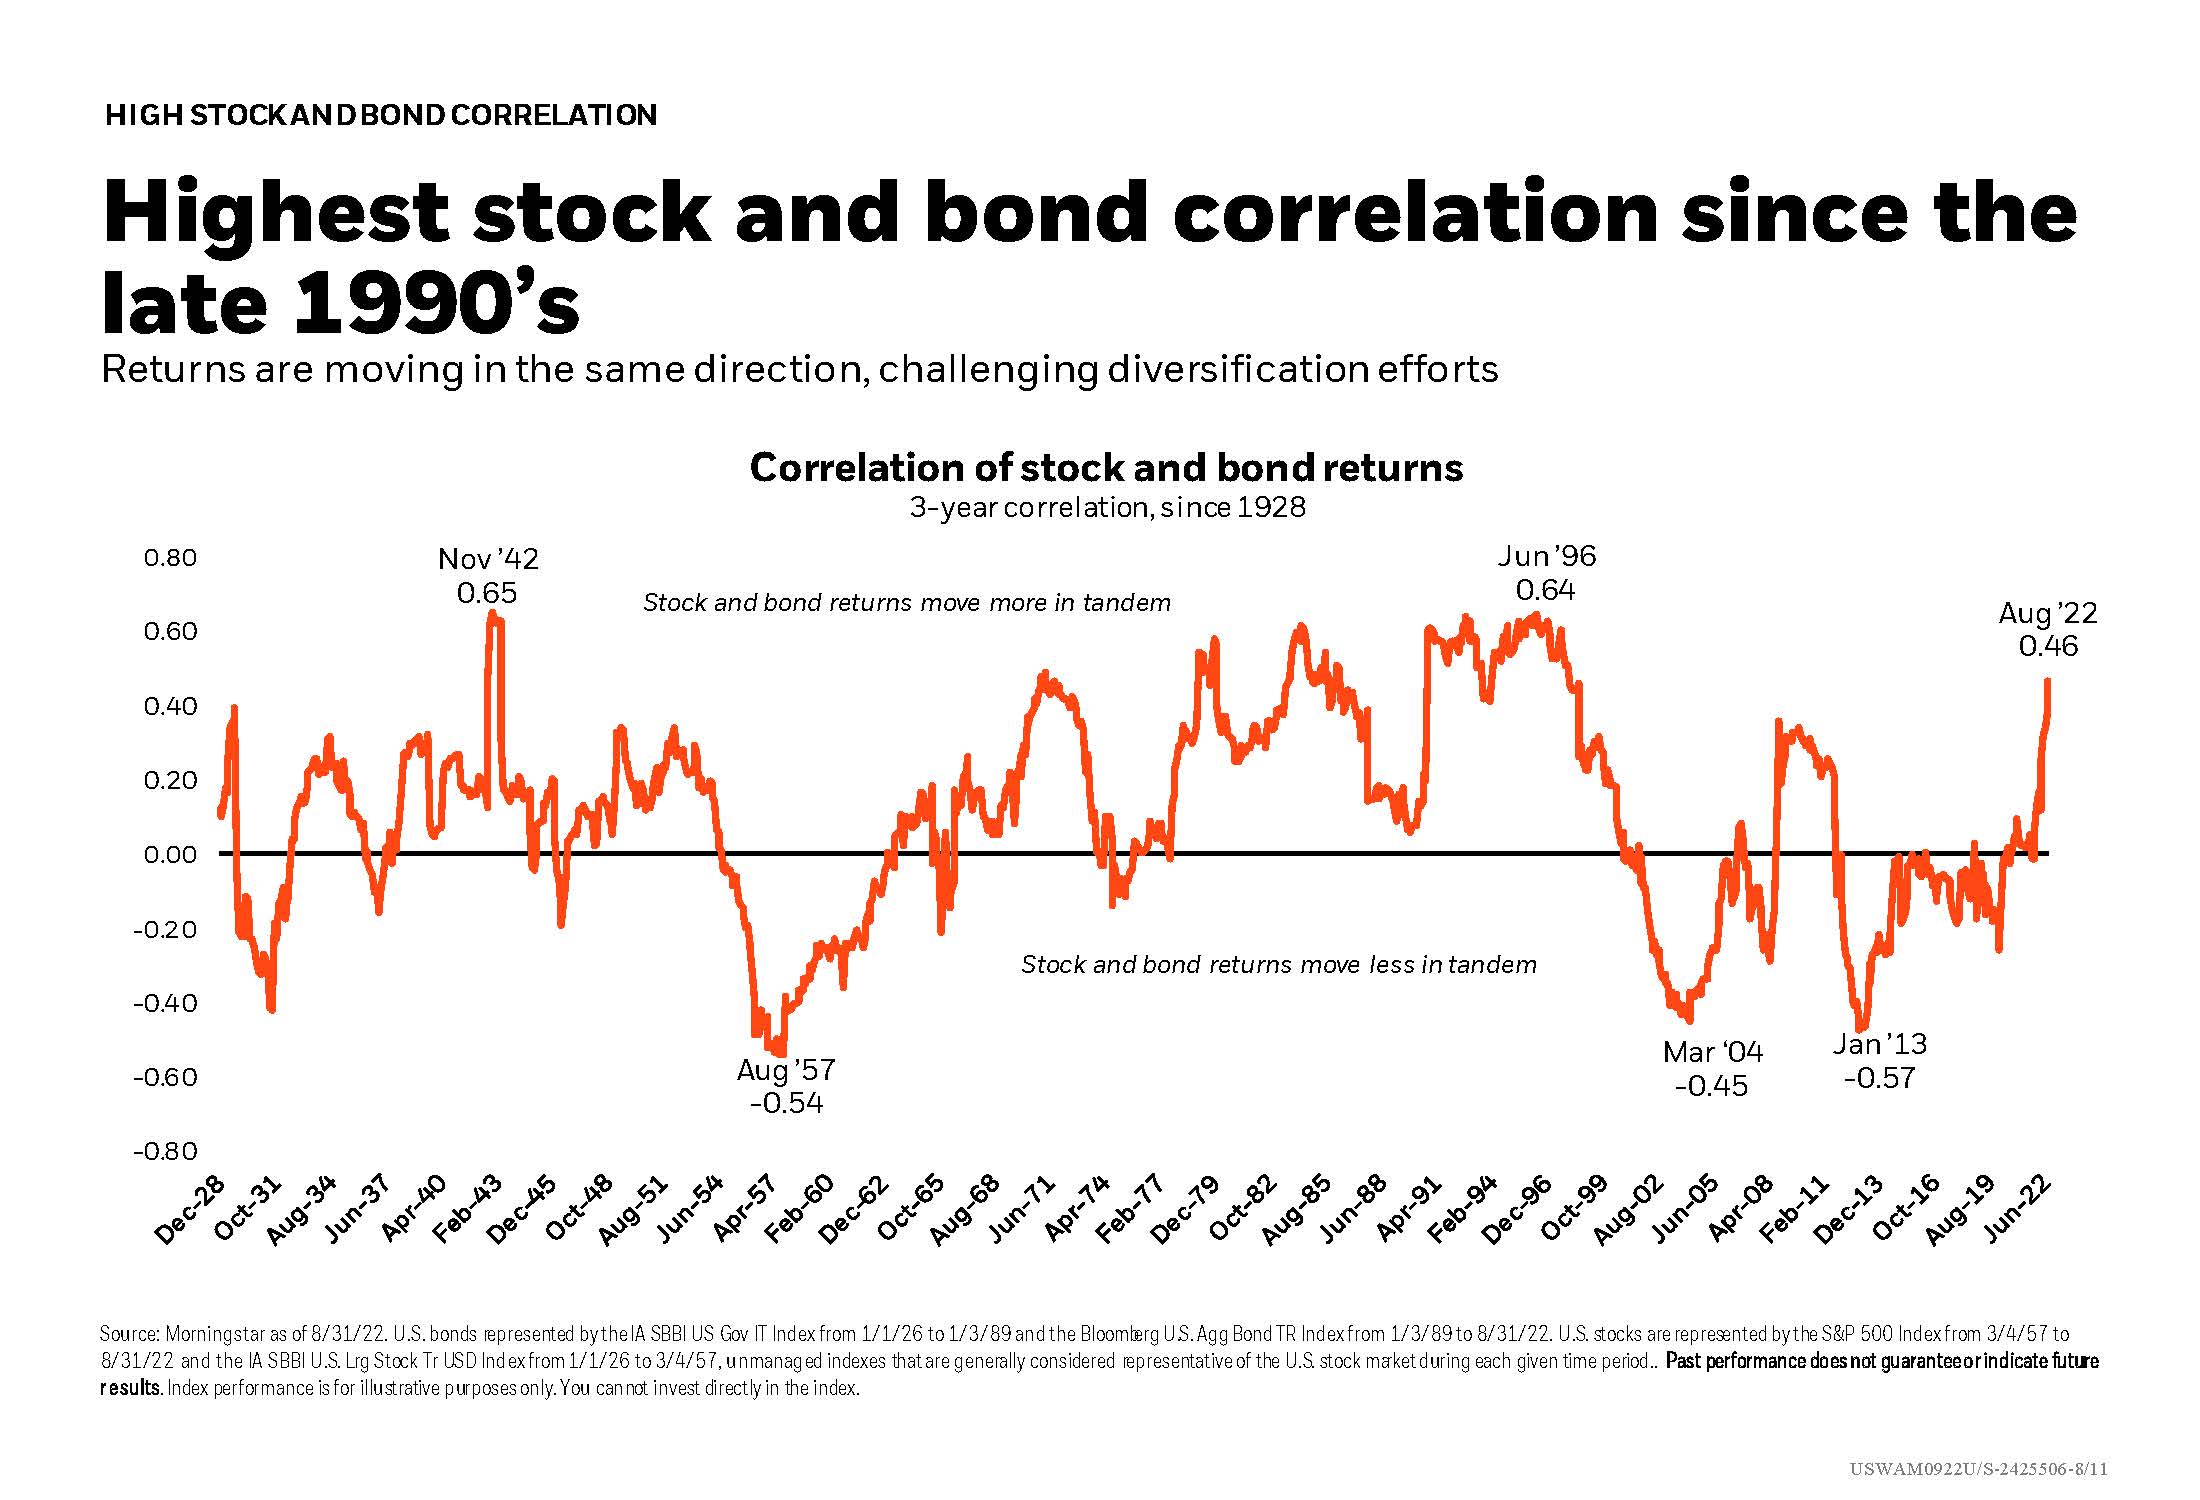
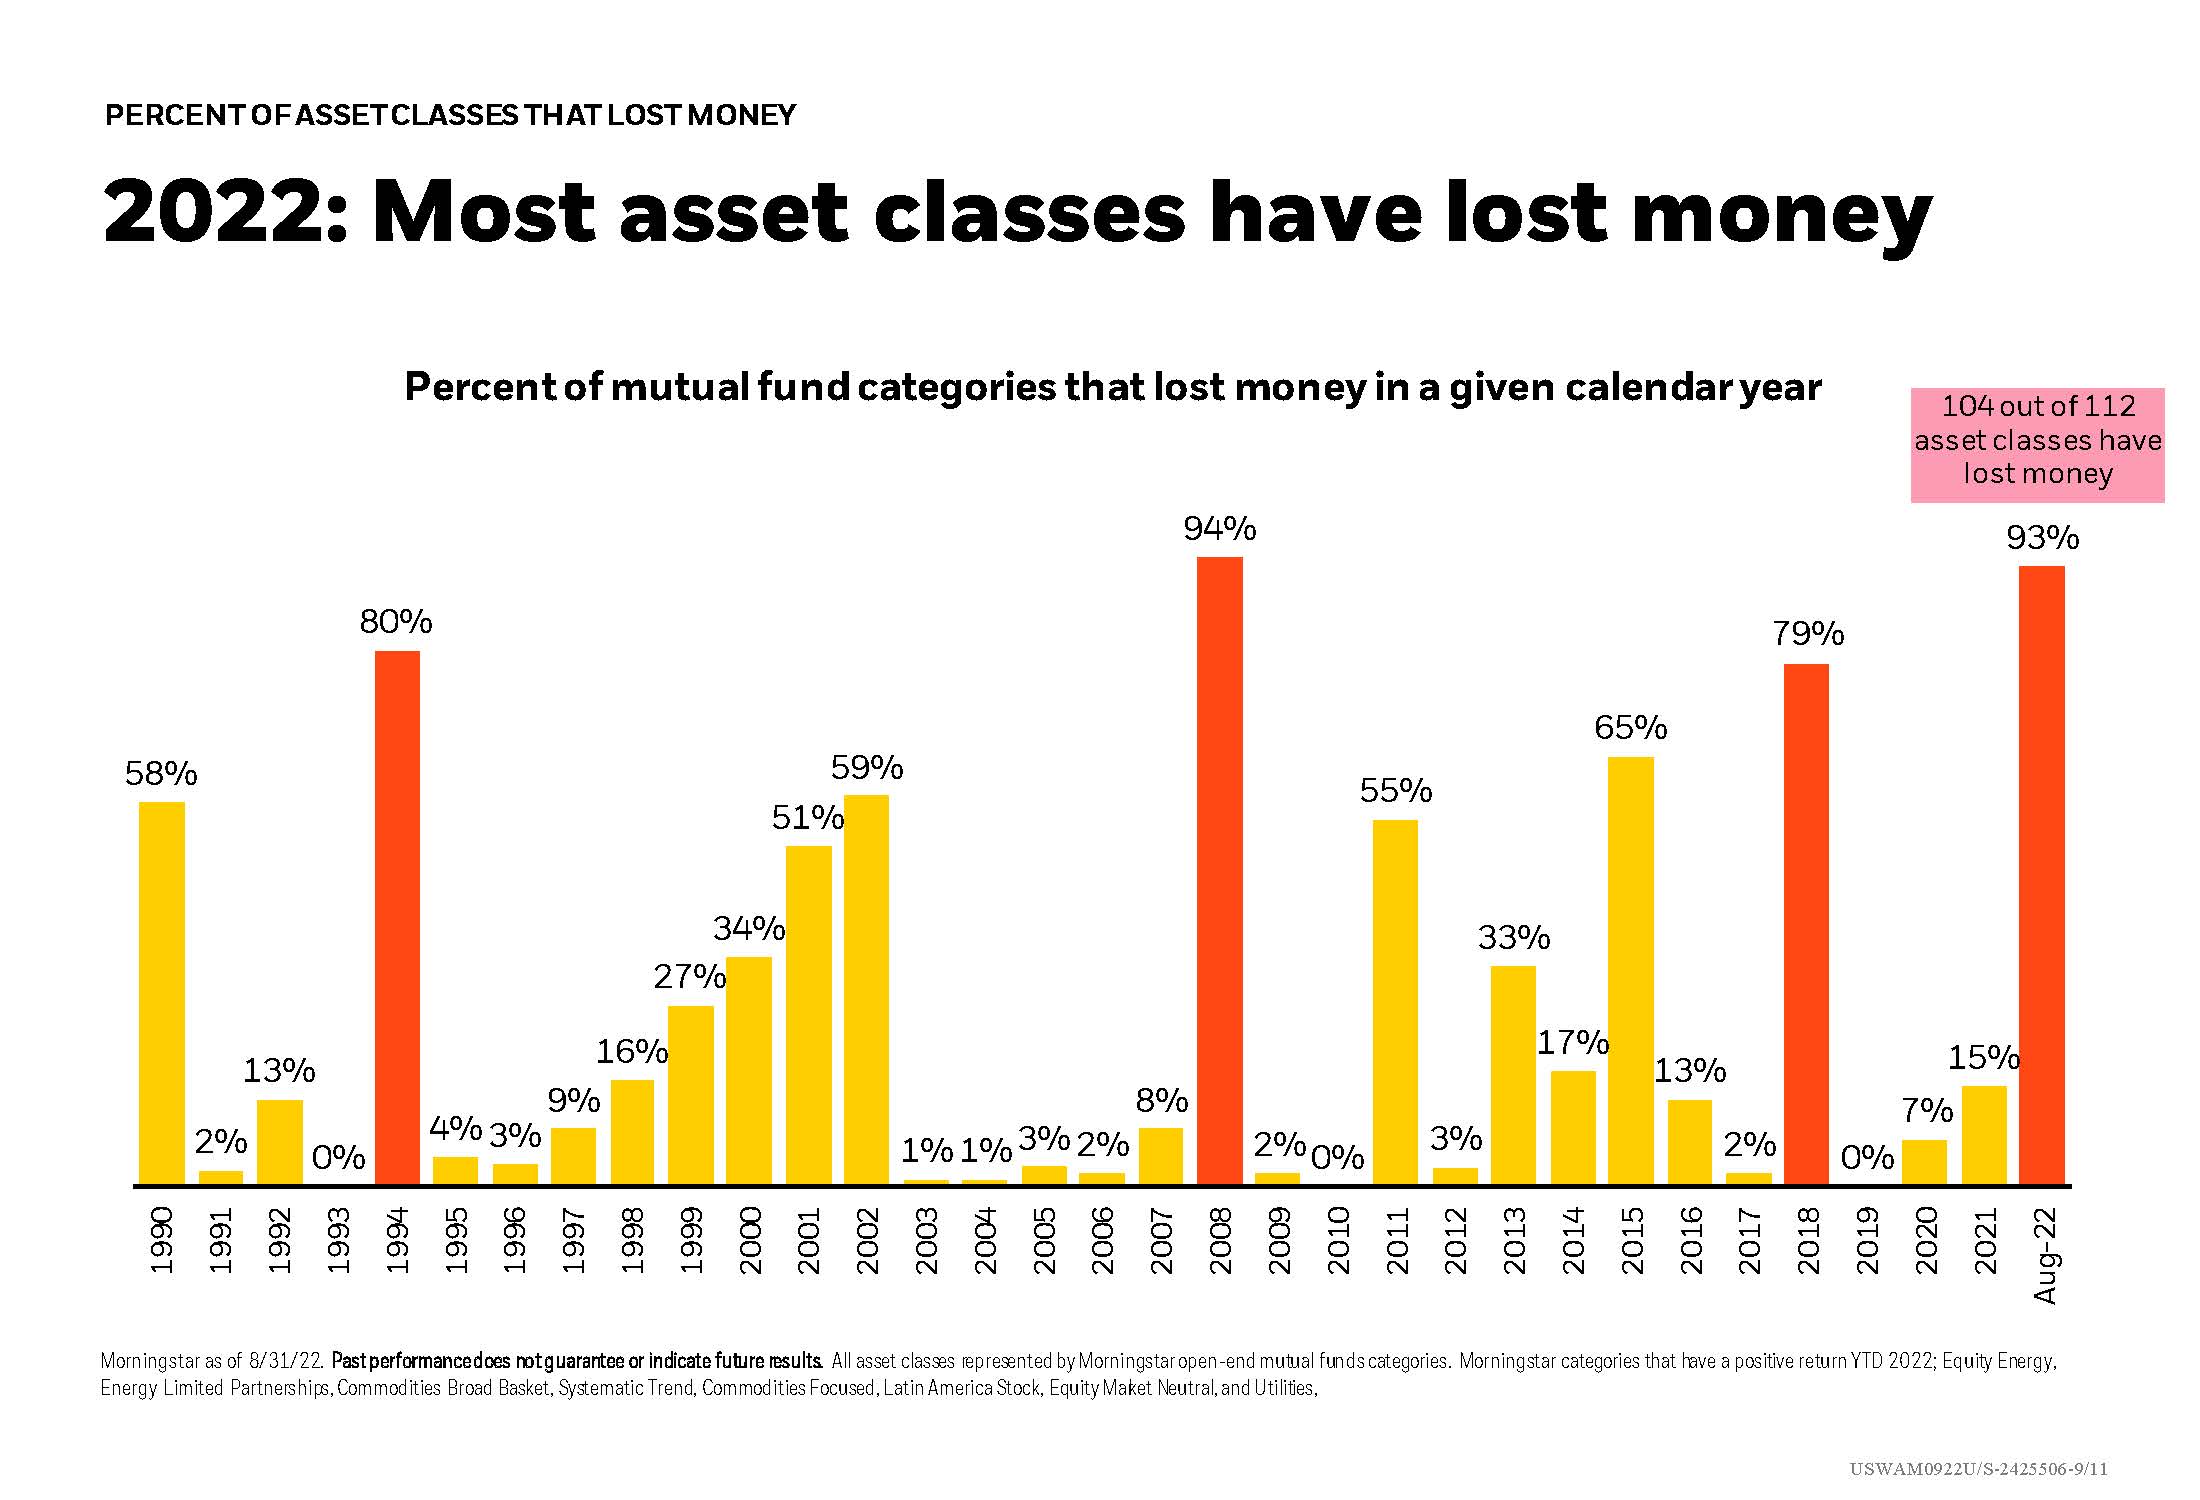
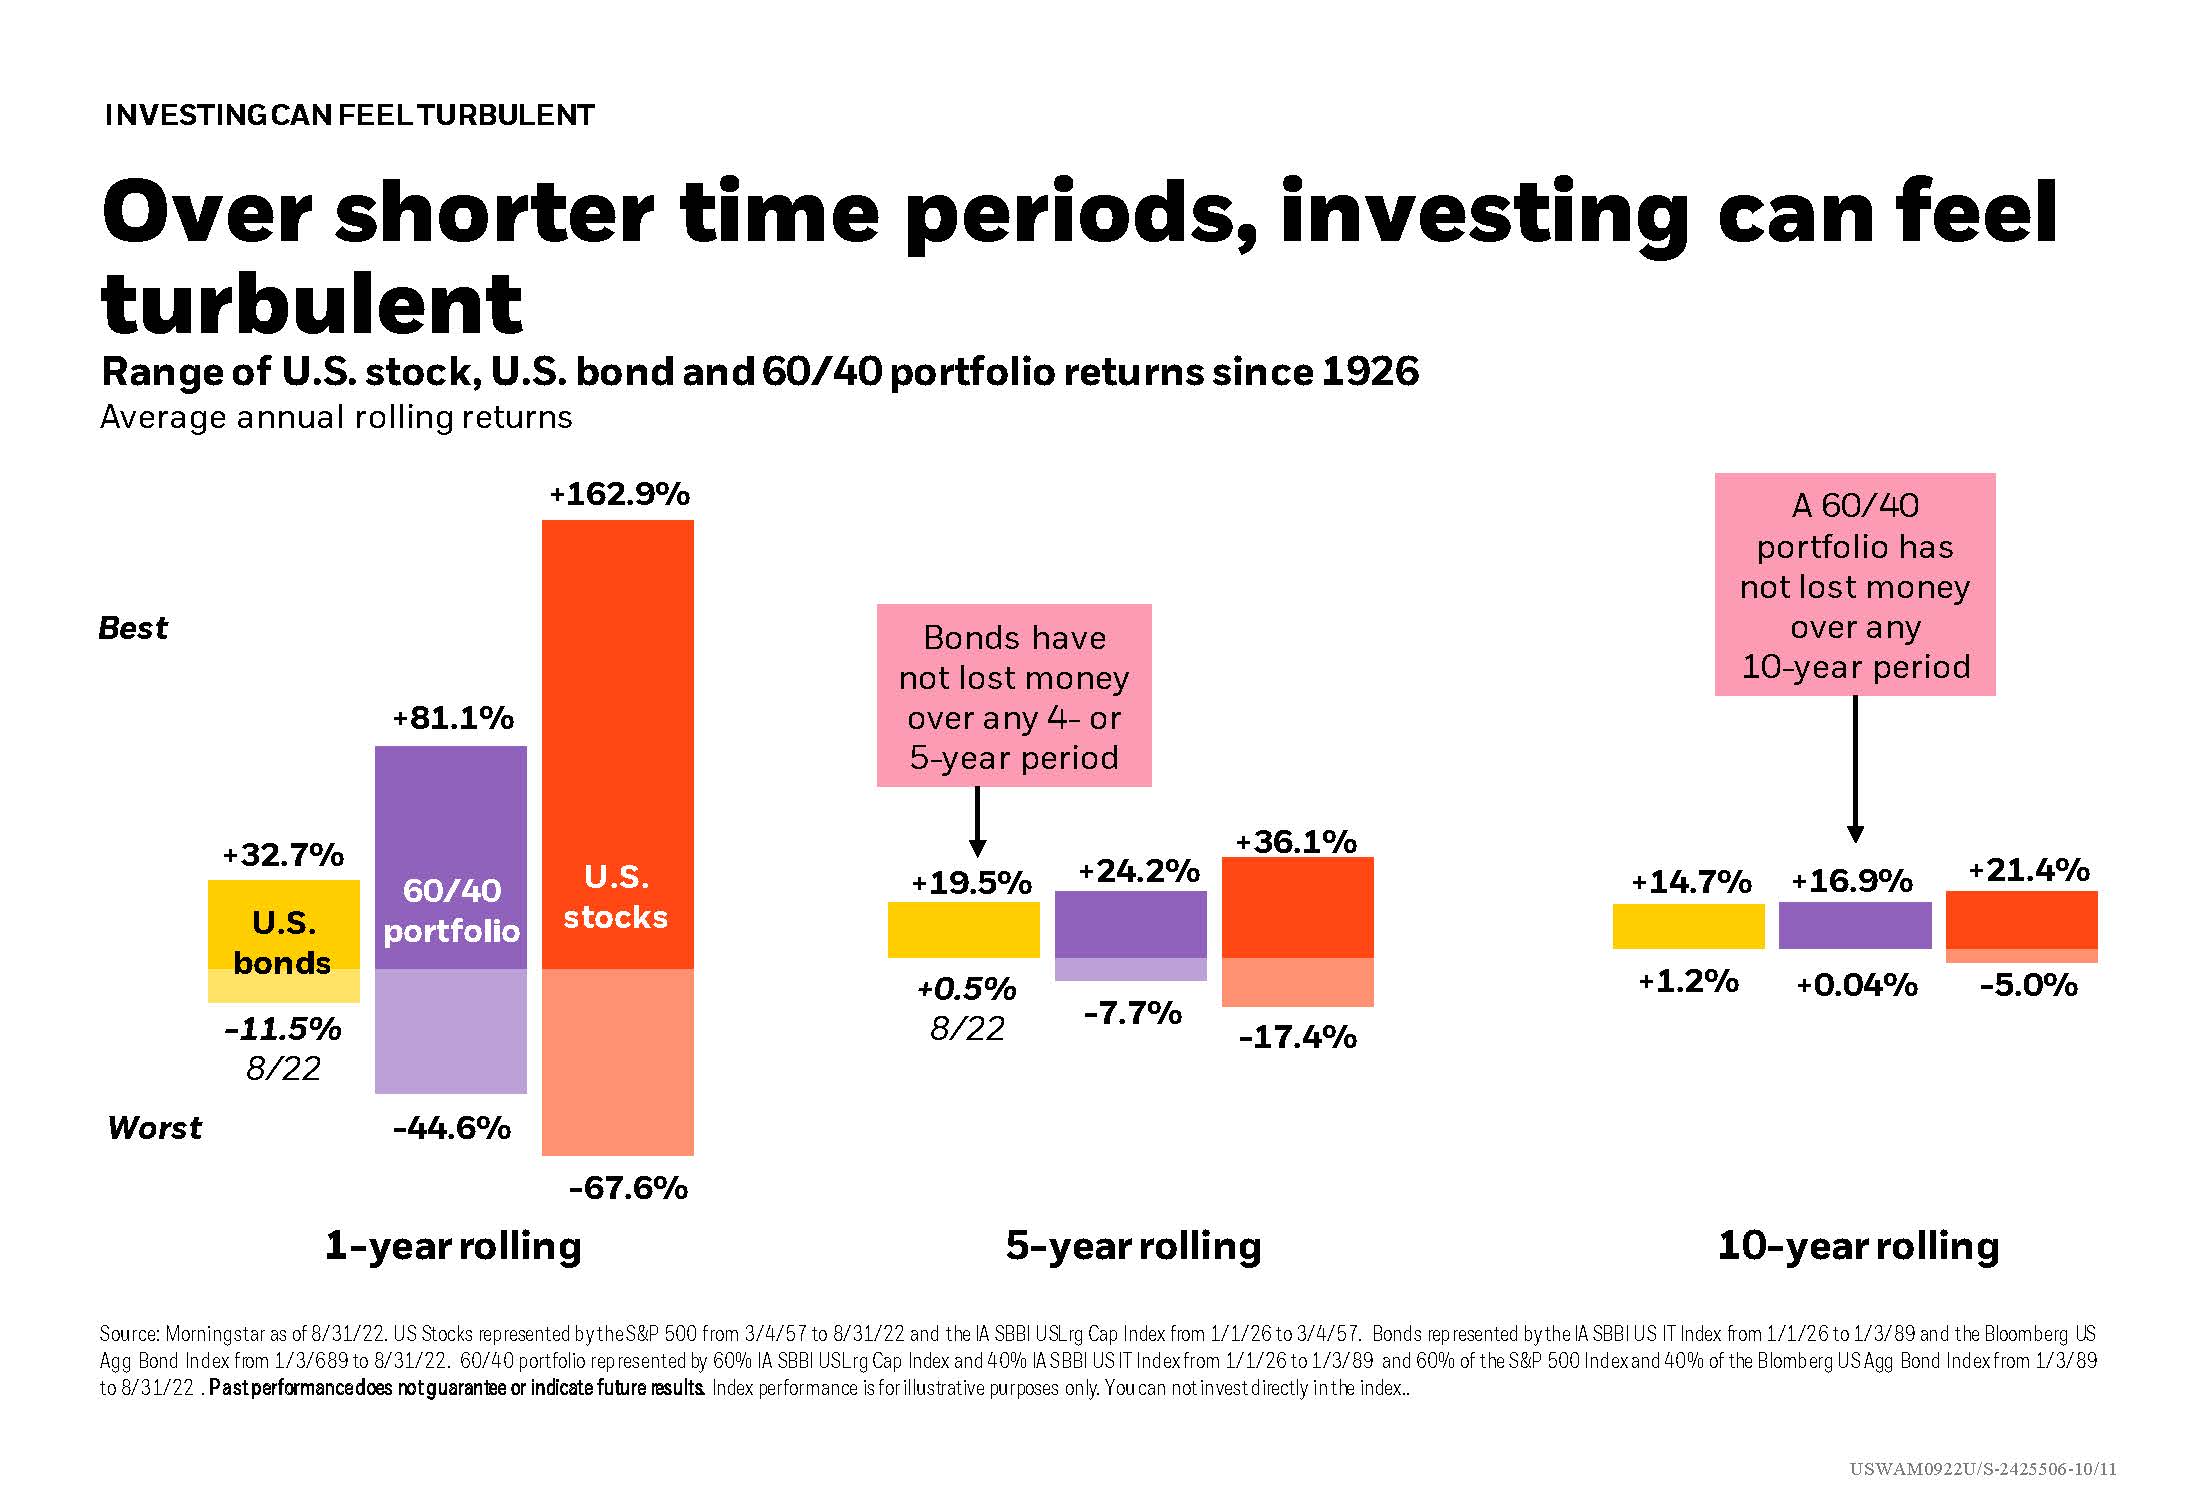
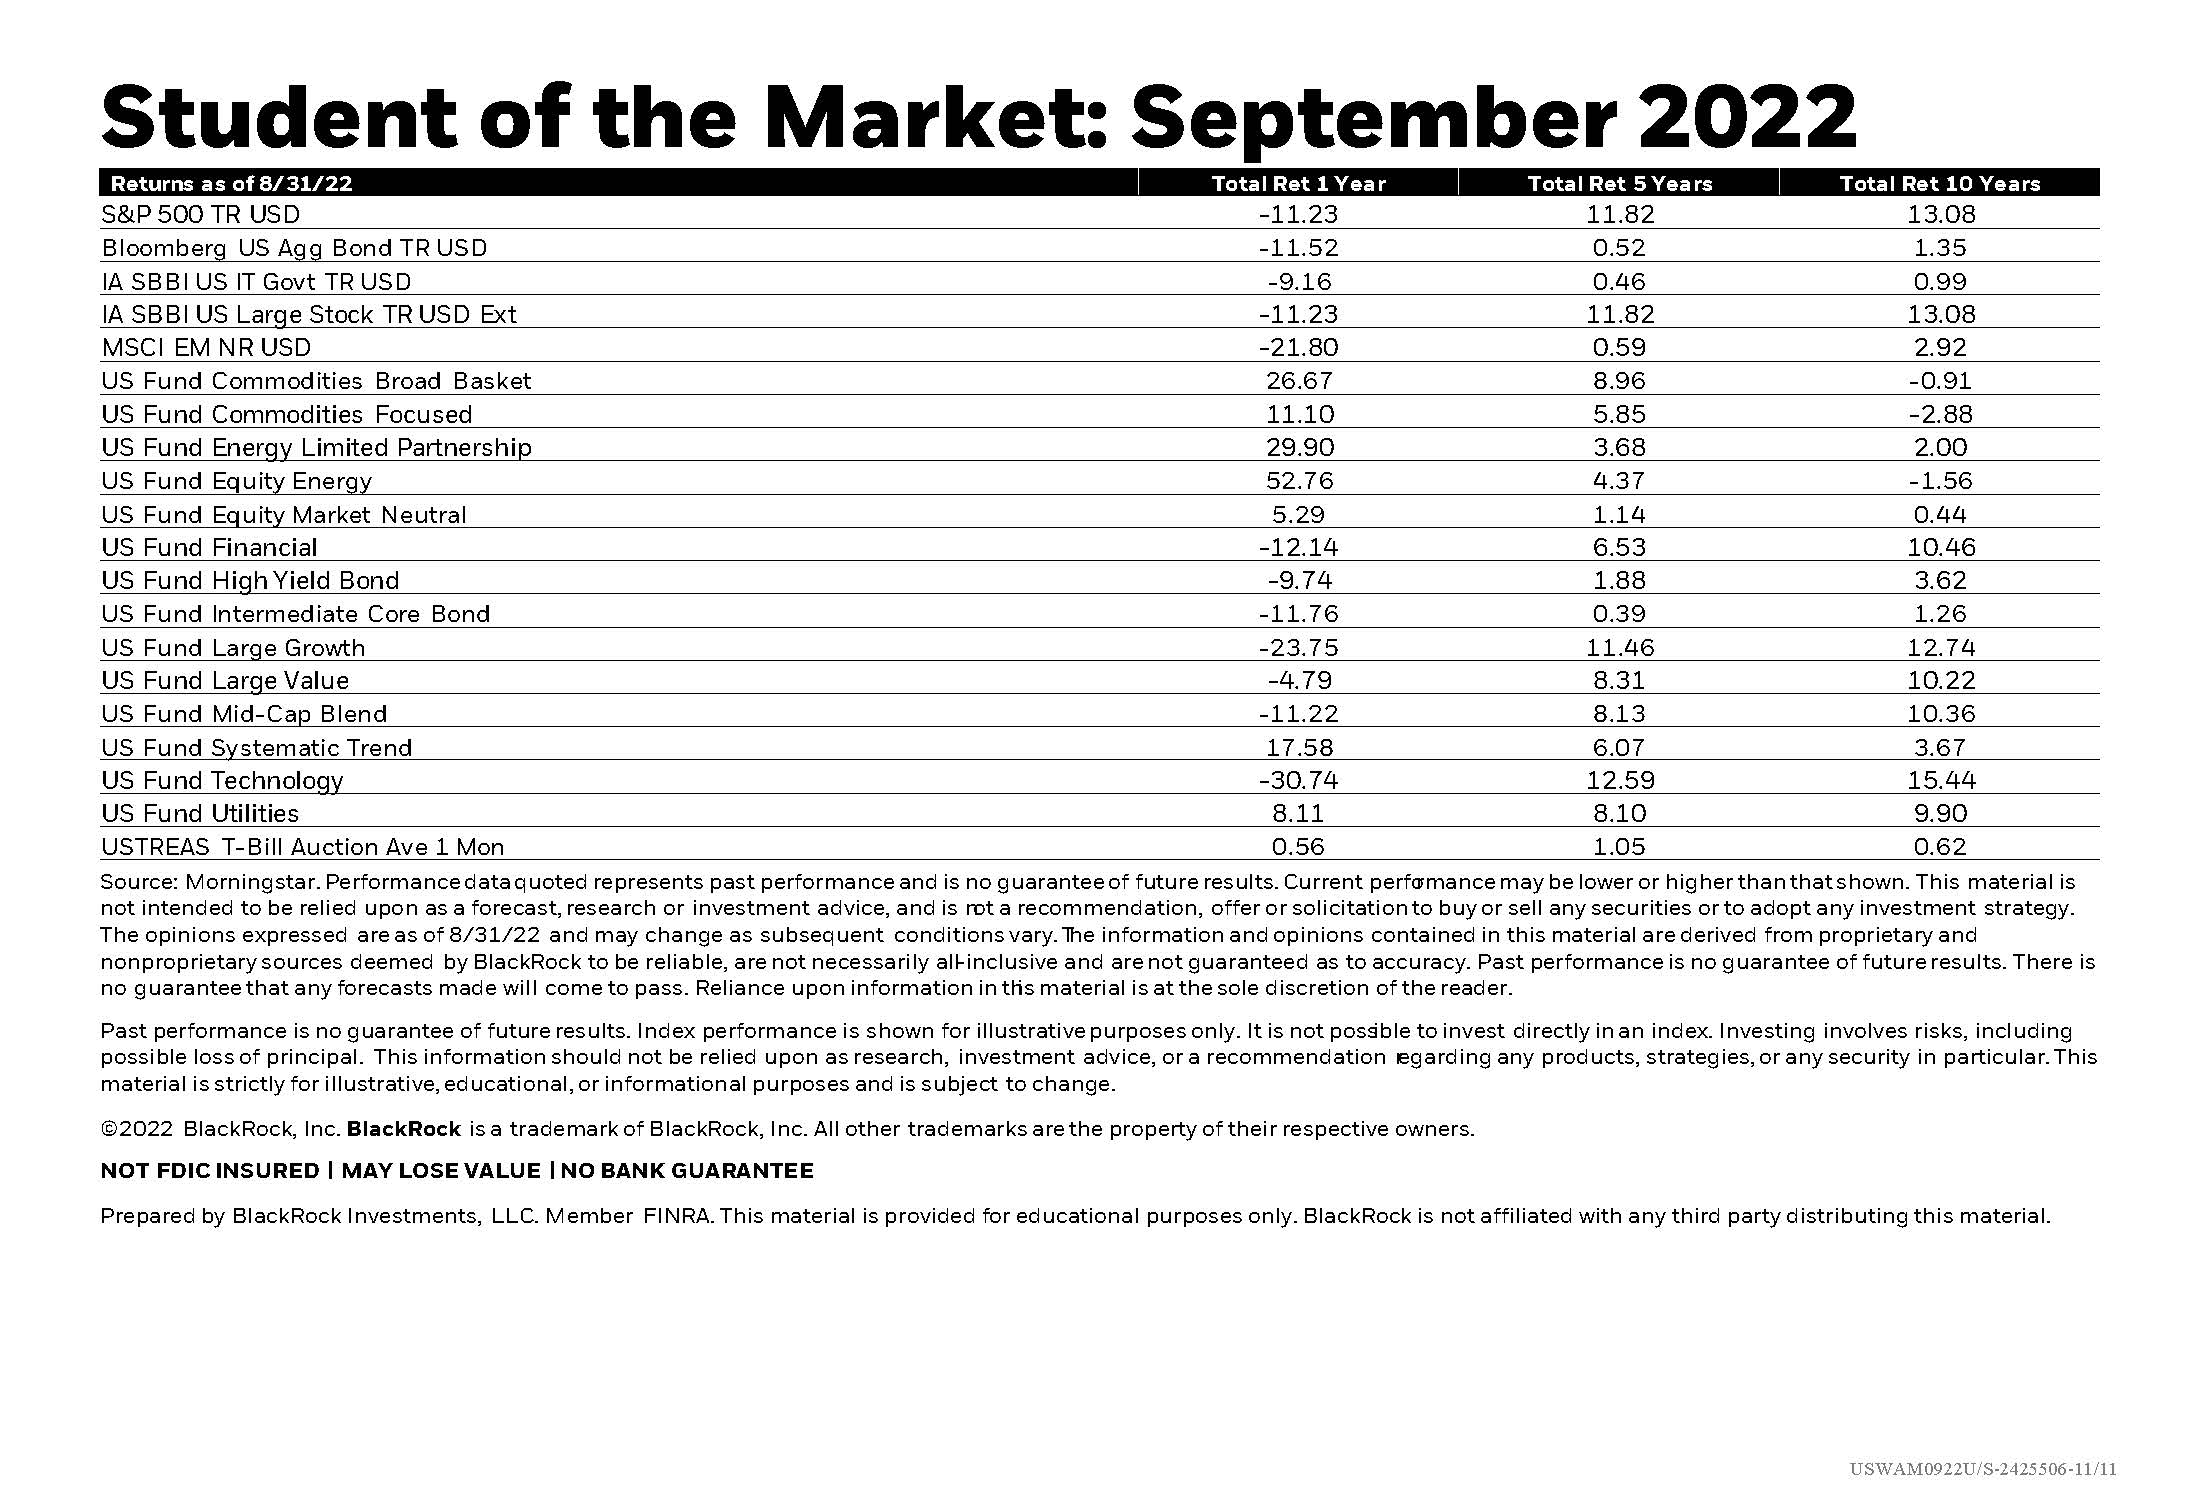
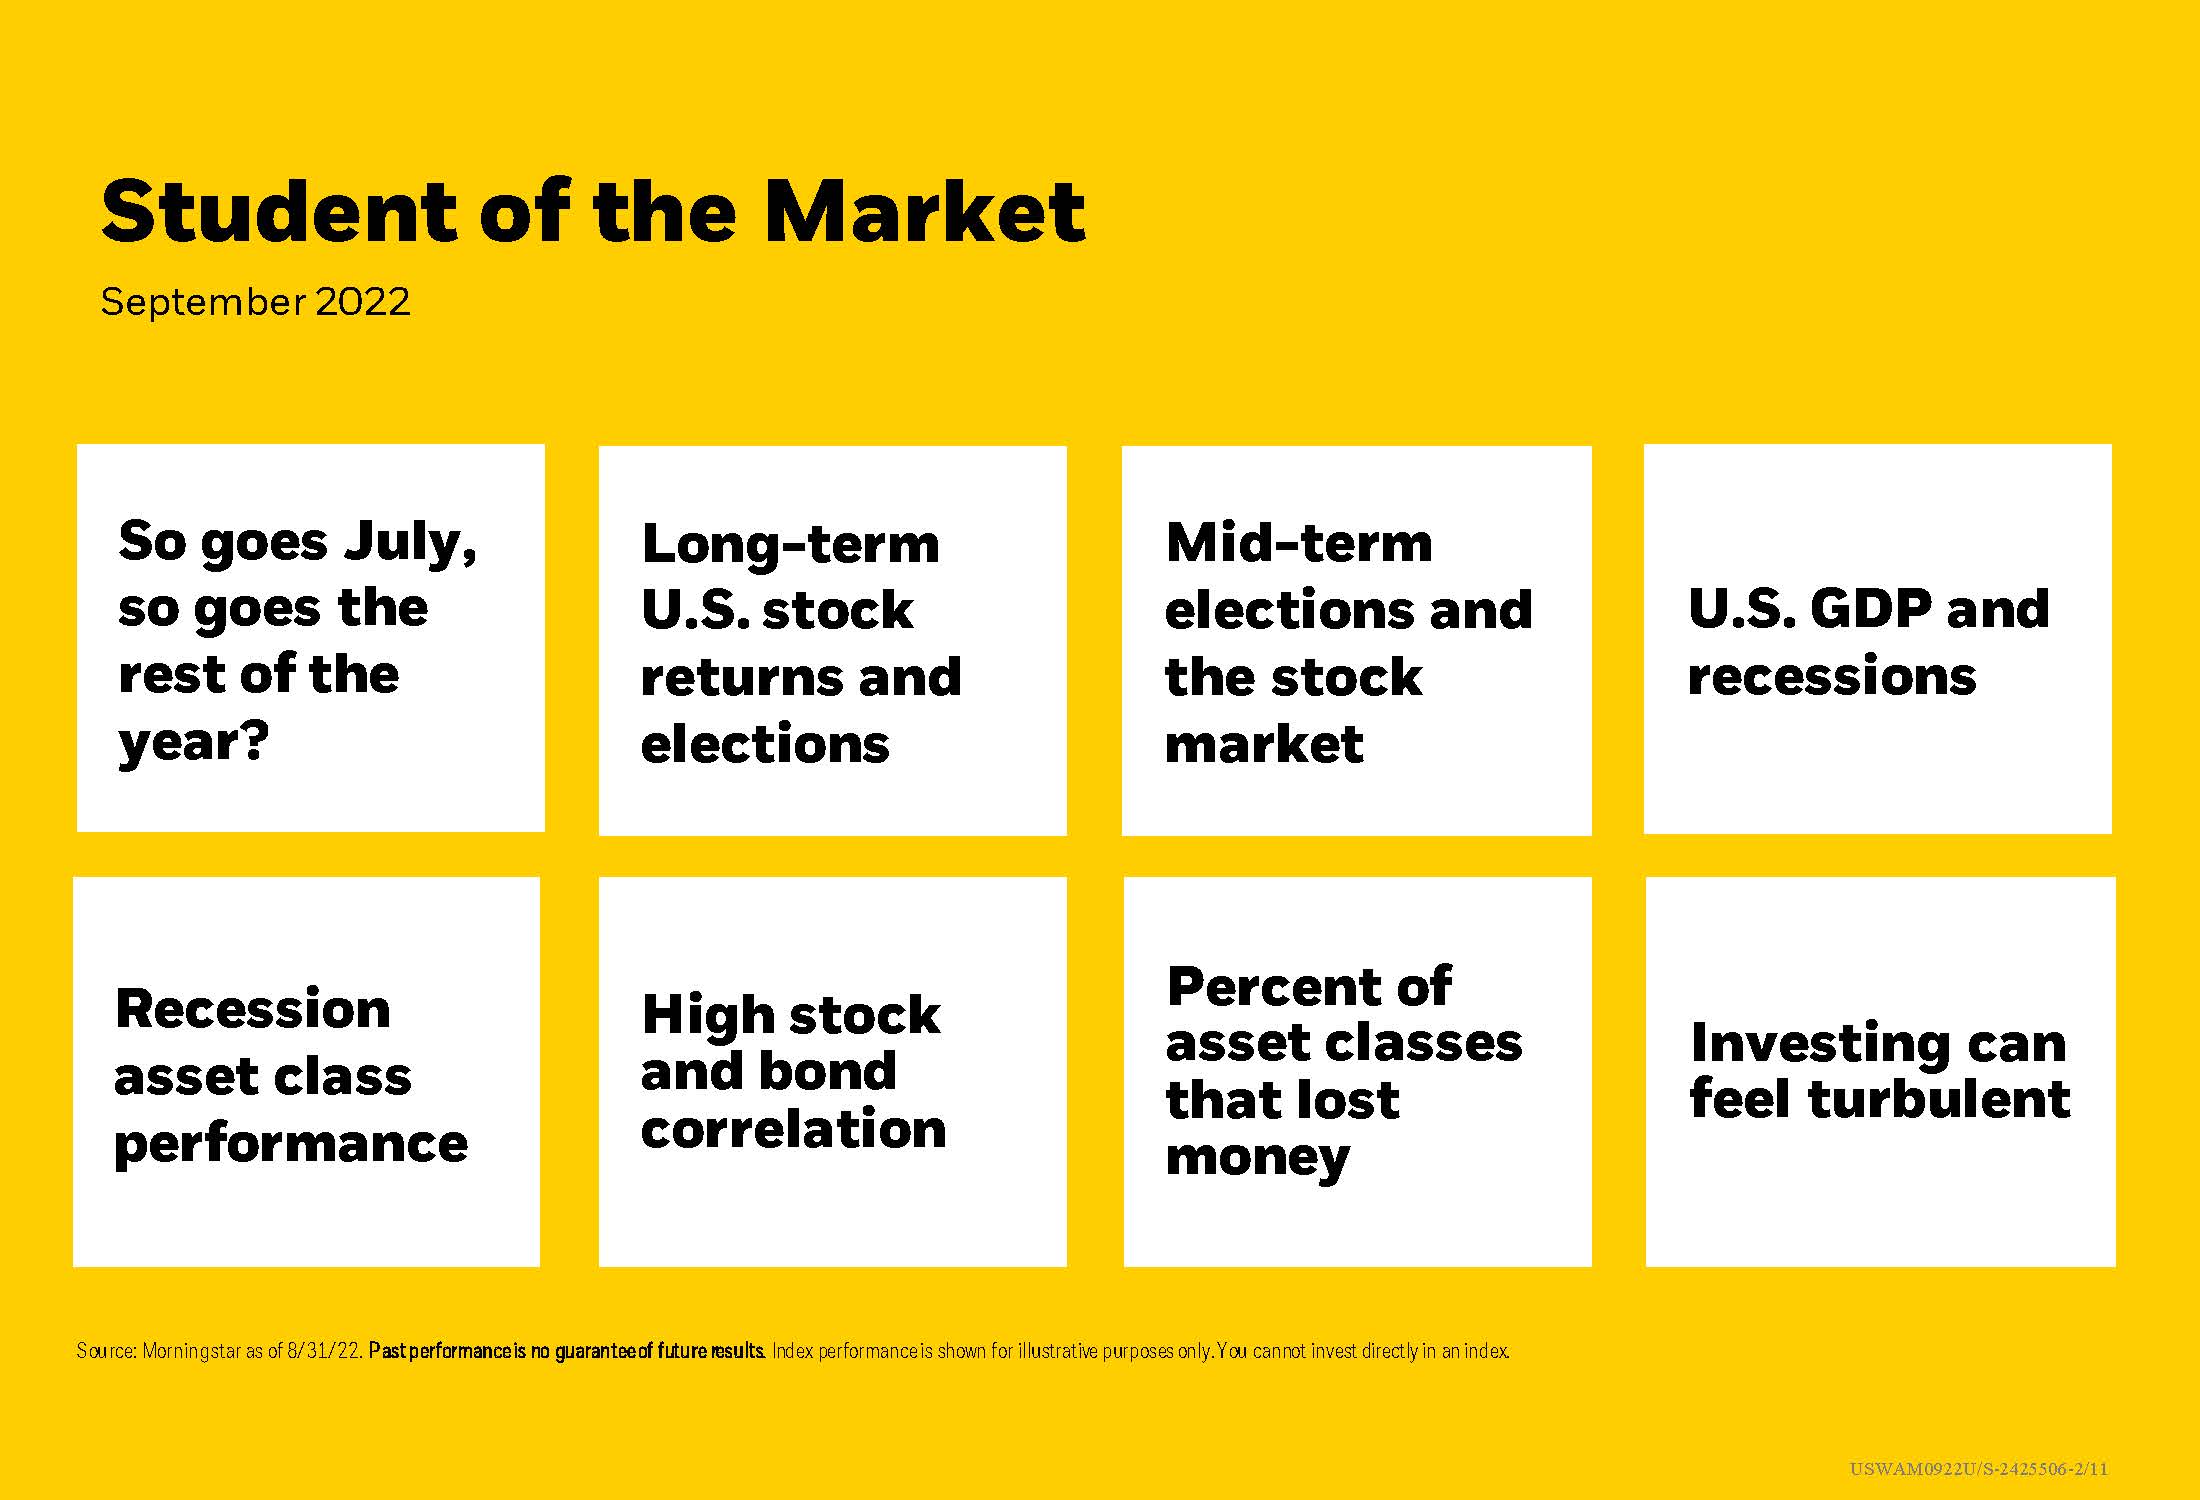
After a big July for stocks, August was a bit disappointing at -4.1% even though historically the average return after “best months” is 1.1%. This month’s Student of the Market looks at those type of U.S. Stock Market ups and downs from a historical point of view, offering some relief to turbulent feelings by looking at the big picture.

September 20, 2022
Investing Can Feel Turbulent
Important Disclosure: Content on our website and in our newsletters is for informational purposes only. The information provided may (or may not) directly apply to your situation. We recommend that readers work directly with a professional advisor when making decisions in the context of their specific situation.

Other content you may like

  • Stock Market Volatility

    So goes January . . . ?

    February 22, 2022
    Along with historical stats on how stock returns followed a positive vs. negative January, this Student of the Market explores stock market volatility, the effects of the Fed raising interest rates by looking at past periods of higher interest rates, and more numbers on headline inflation.
    Read this Article
  • Podcast Highlight - Fed Forecasts & Policy

    November 21, 2023
    Discussion centers around how inflation is tightly correlated with economic growth and the outlook, along with how outlook models have been working.
    Read this Article
  • Inflation Varies According to Your Age & Spending

    Inflation Varies According to Your Age & Spending

    August 3, 2021
    What will inflation be in the coming years? The headline Consumer Price Index is important only as a general gauge. It may not accurately reflect your individual inflation rate. This article looks at some inflation components for you to consider, to get a better picture of your unique personal inflation rate based on your age and spending habits.
    Read this Article
  • Market Performance in Mid-Term Election Years

    Market Performance in Mid-Term Election Years

    July 19, 2022
    History shows that mid-term election years have an effect on market performance. What does that look like during the kind of market volatility already encountered in 2022? This month’s Student of the Market takes a quick look at stats showing market performance across the election cycle. There is also a quick study of stats showing the trends for Bull and Bear Markets, and recession asset class performance.
    Read this Article
  • The link you have selected is located on another server. The linked site contains information that has been created, published, maintained, or otherwise posted by institutions or organizations independent of this organization. We do not endorse, approve, certify, or control any linked websites, their sponsors, or any of their policies, activities, products, or services. We do not assume responsibility for the accuracy, completeness, or timeliness of the information contained therein. Visitors to any linked websites should not use or rely on the information contained therein until they have consulted with an independent financial professional. Please click “Continue to Link” to leave this website and proceed to the selected site.
    phone-handset