Article

Historic Bear Market in Bonds

Historic Bear Market in Bonds

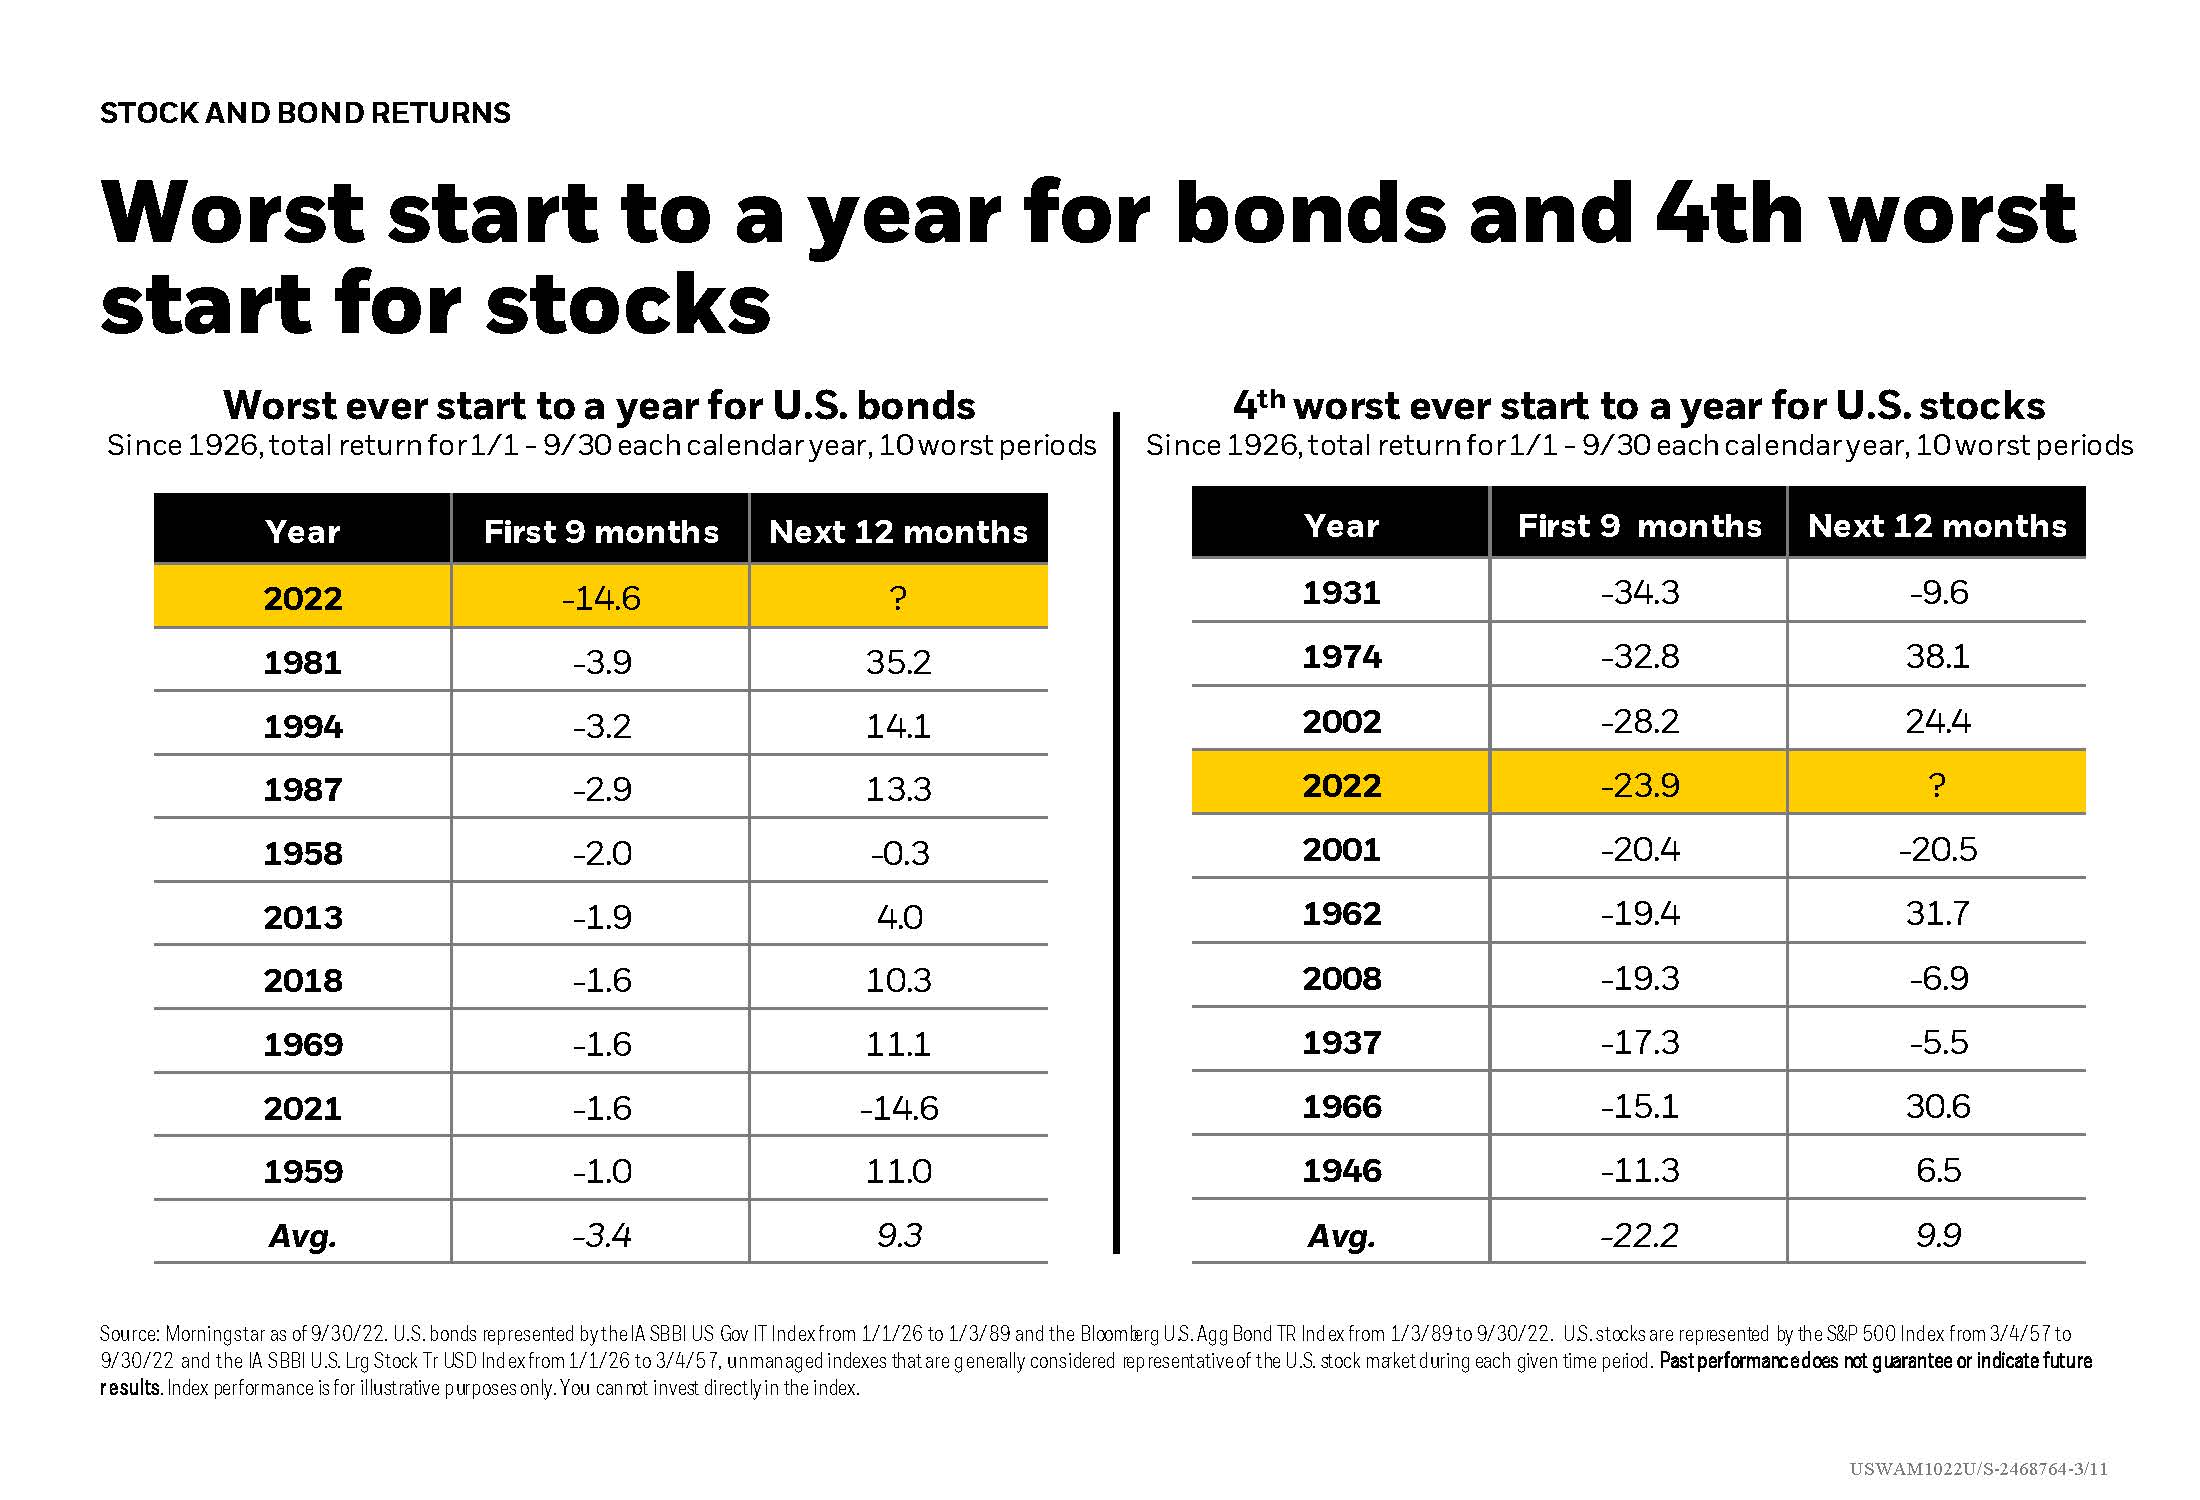
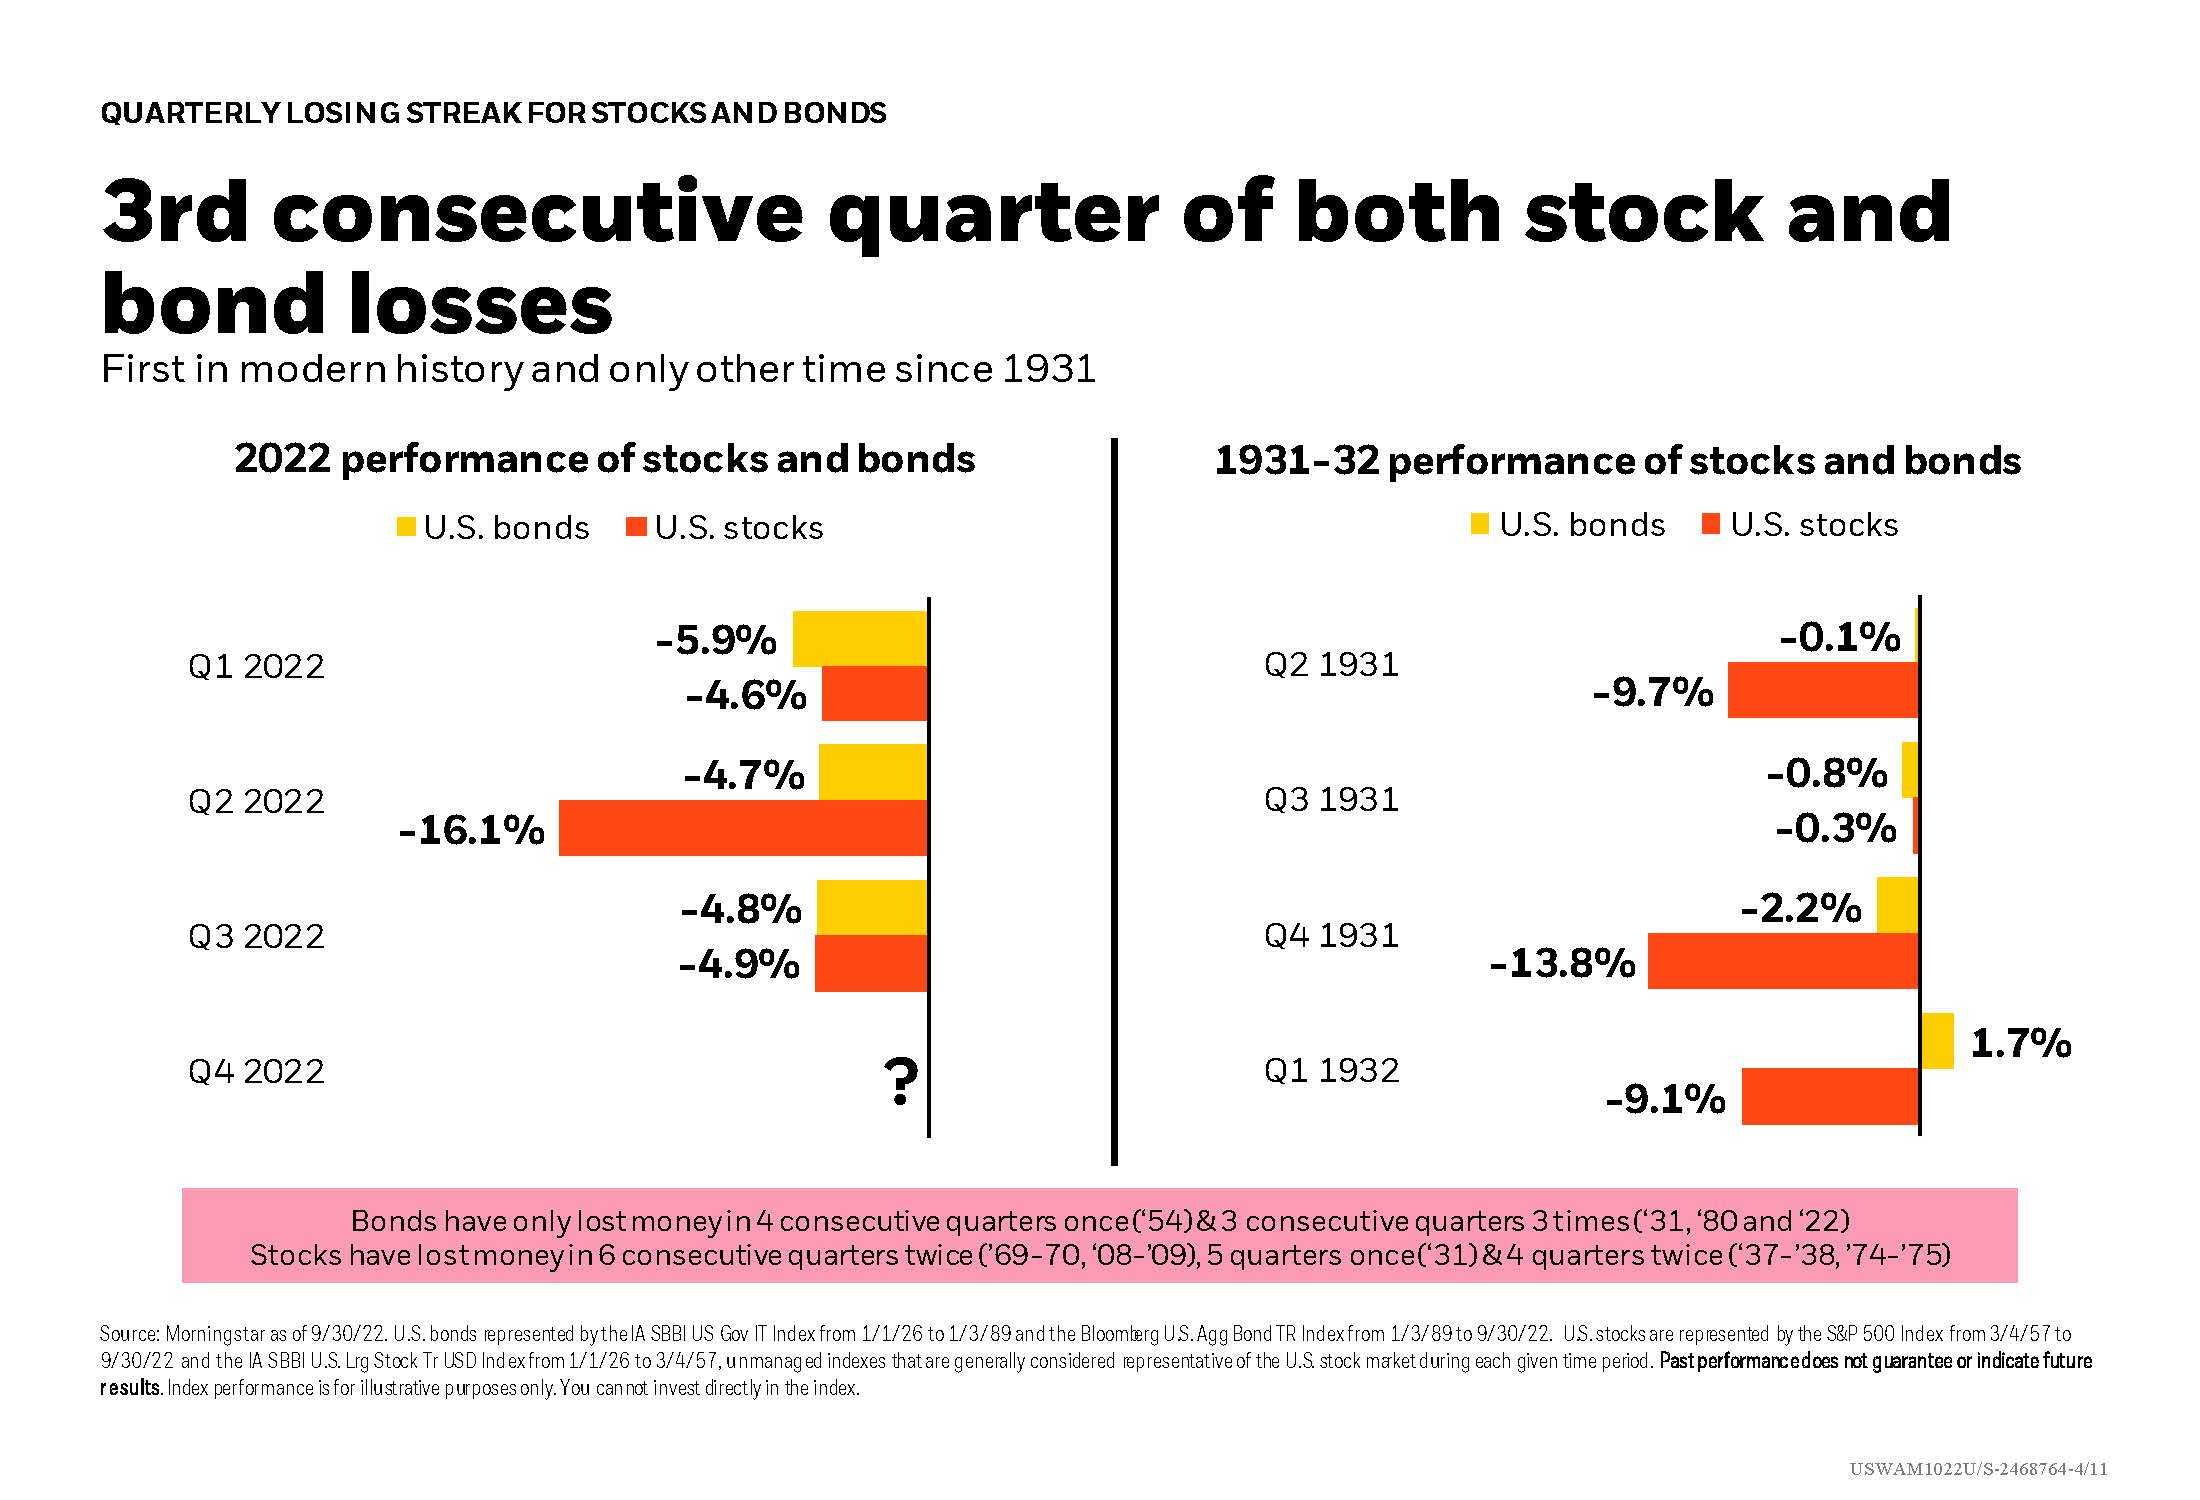
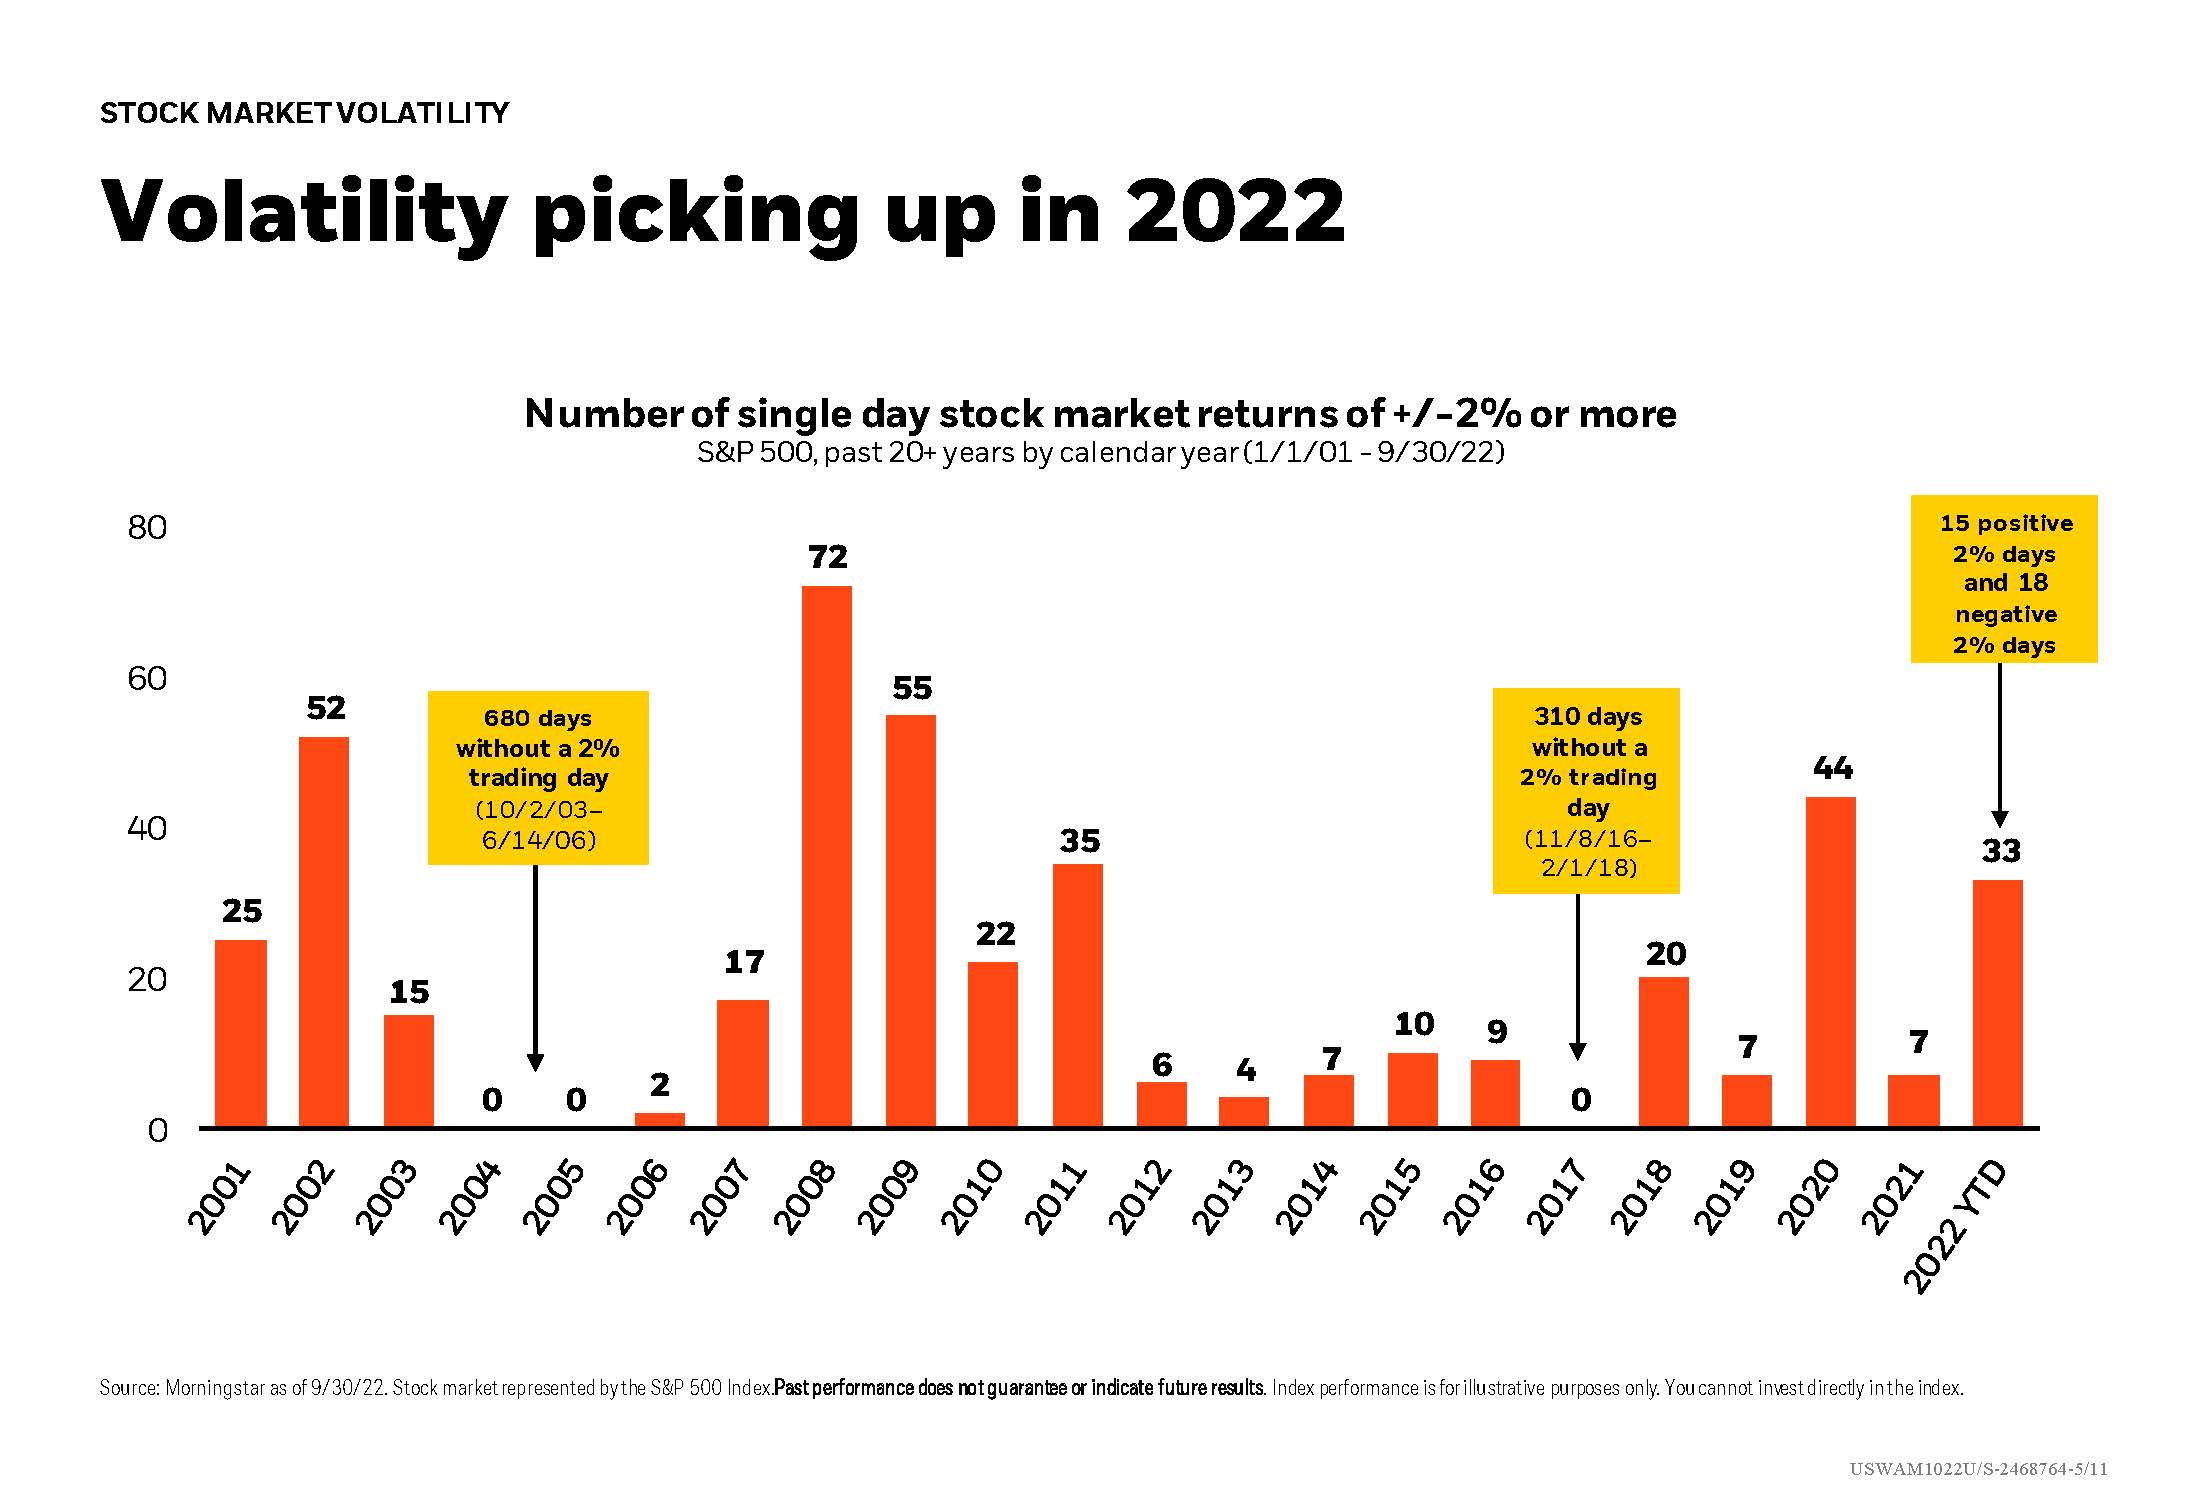
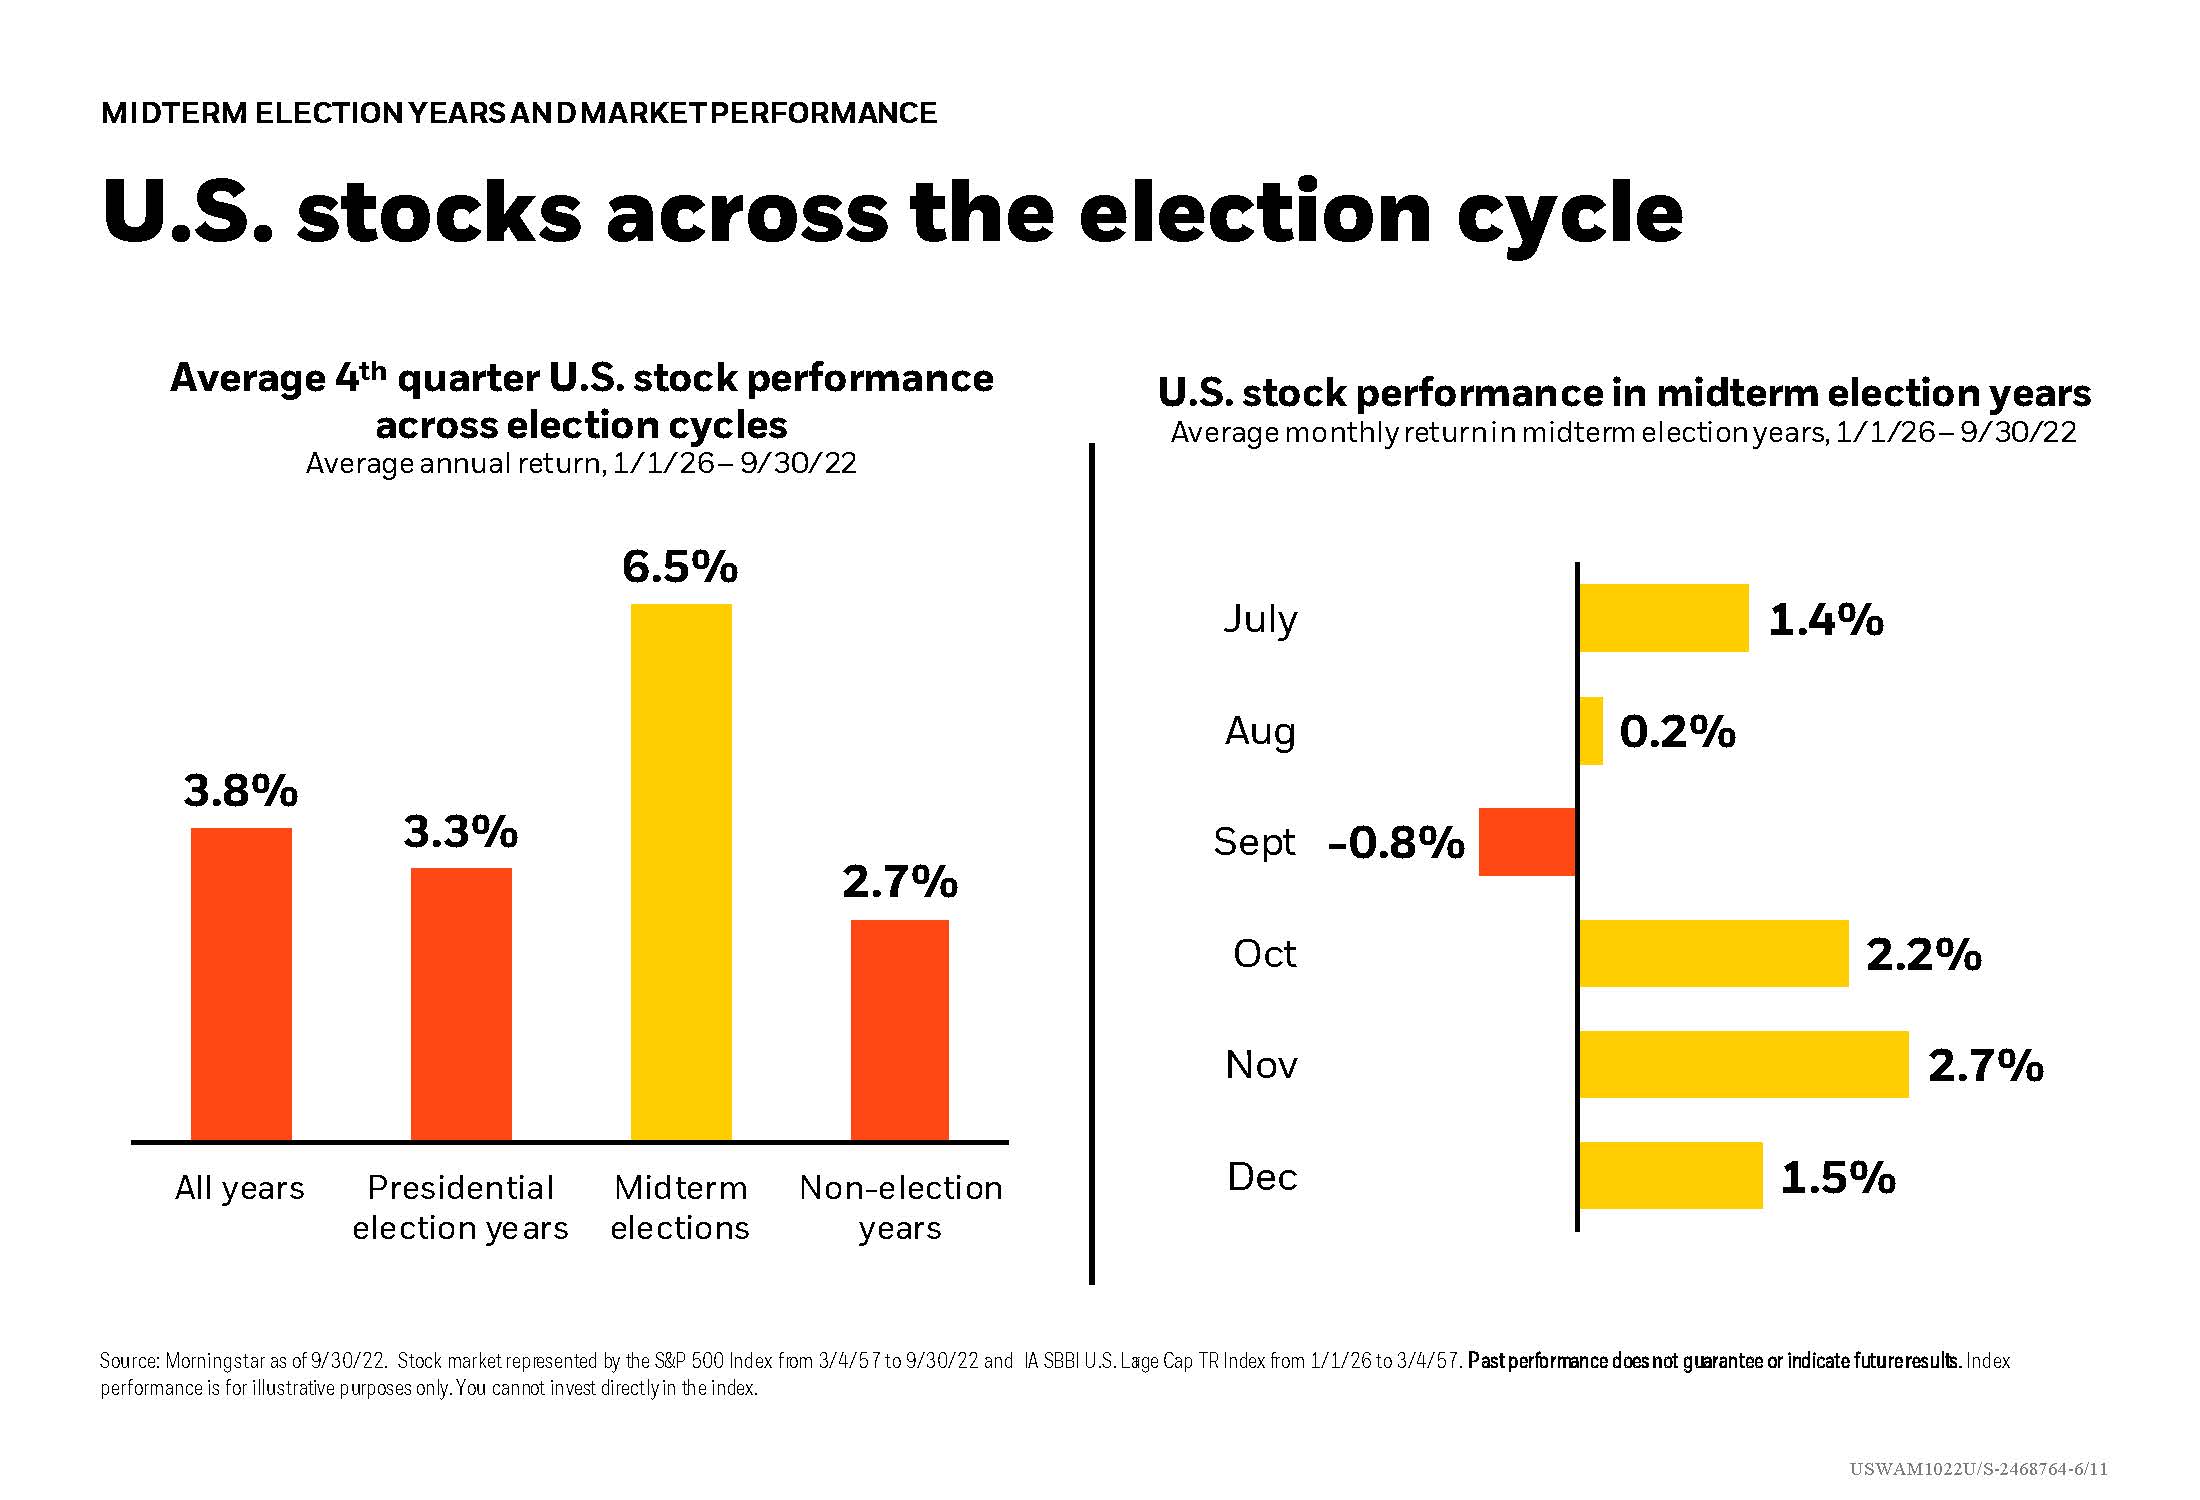
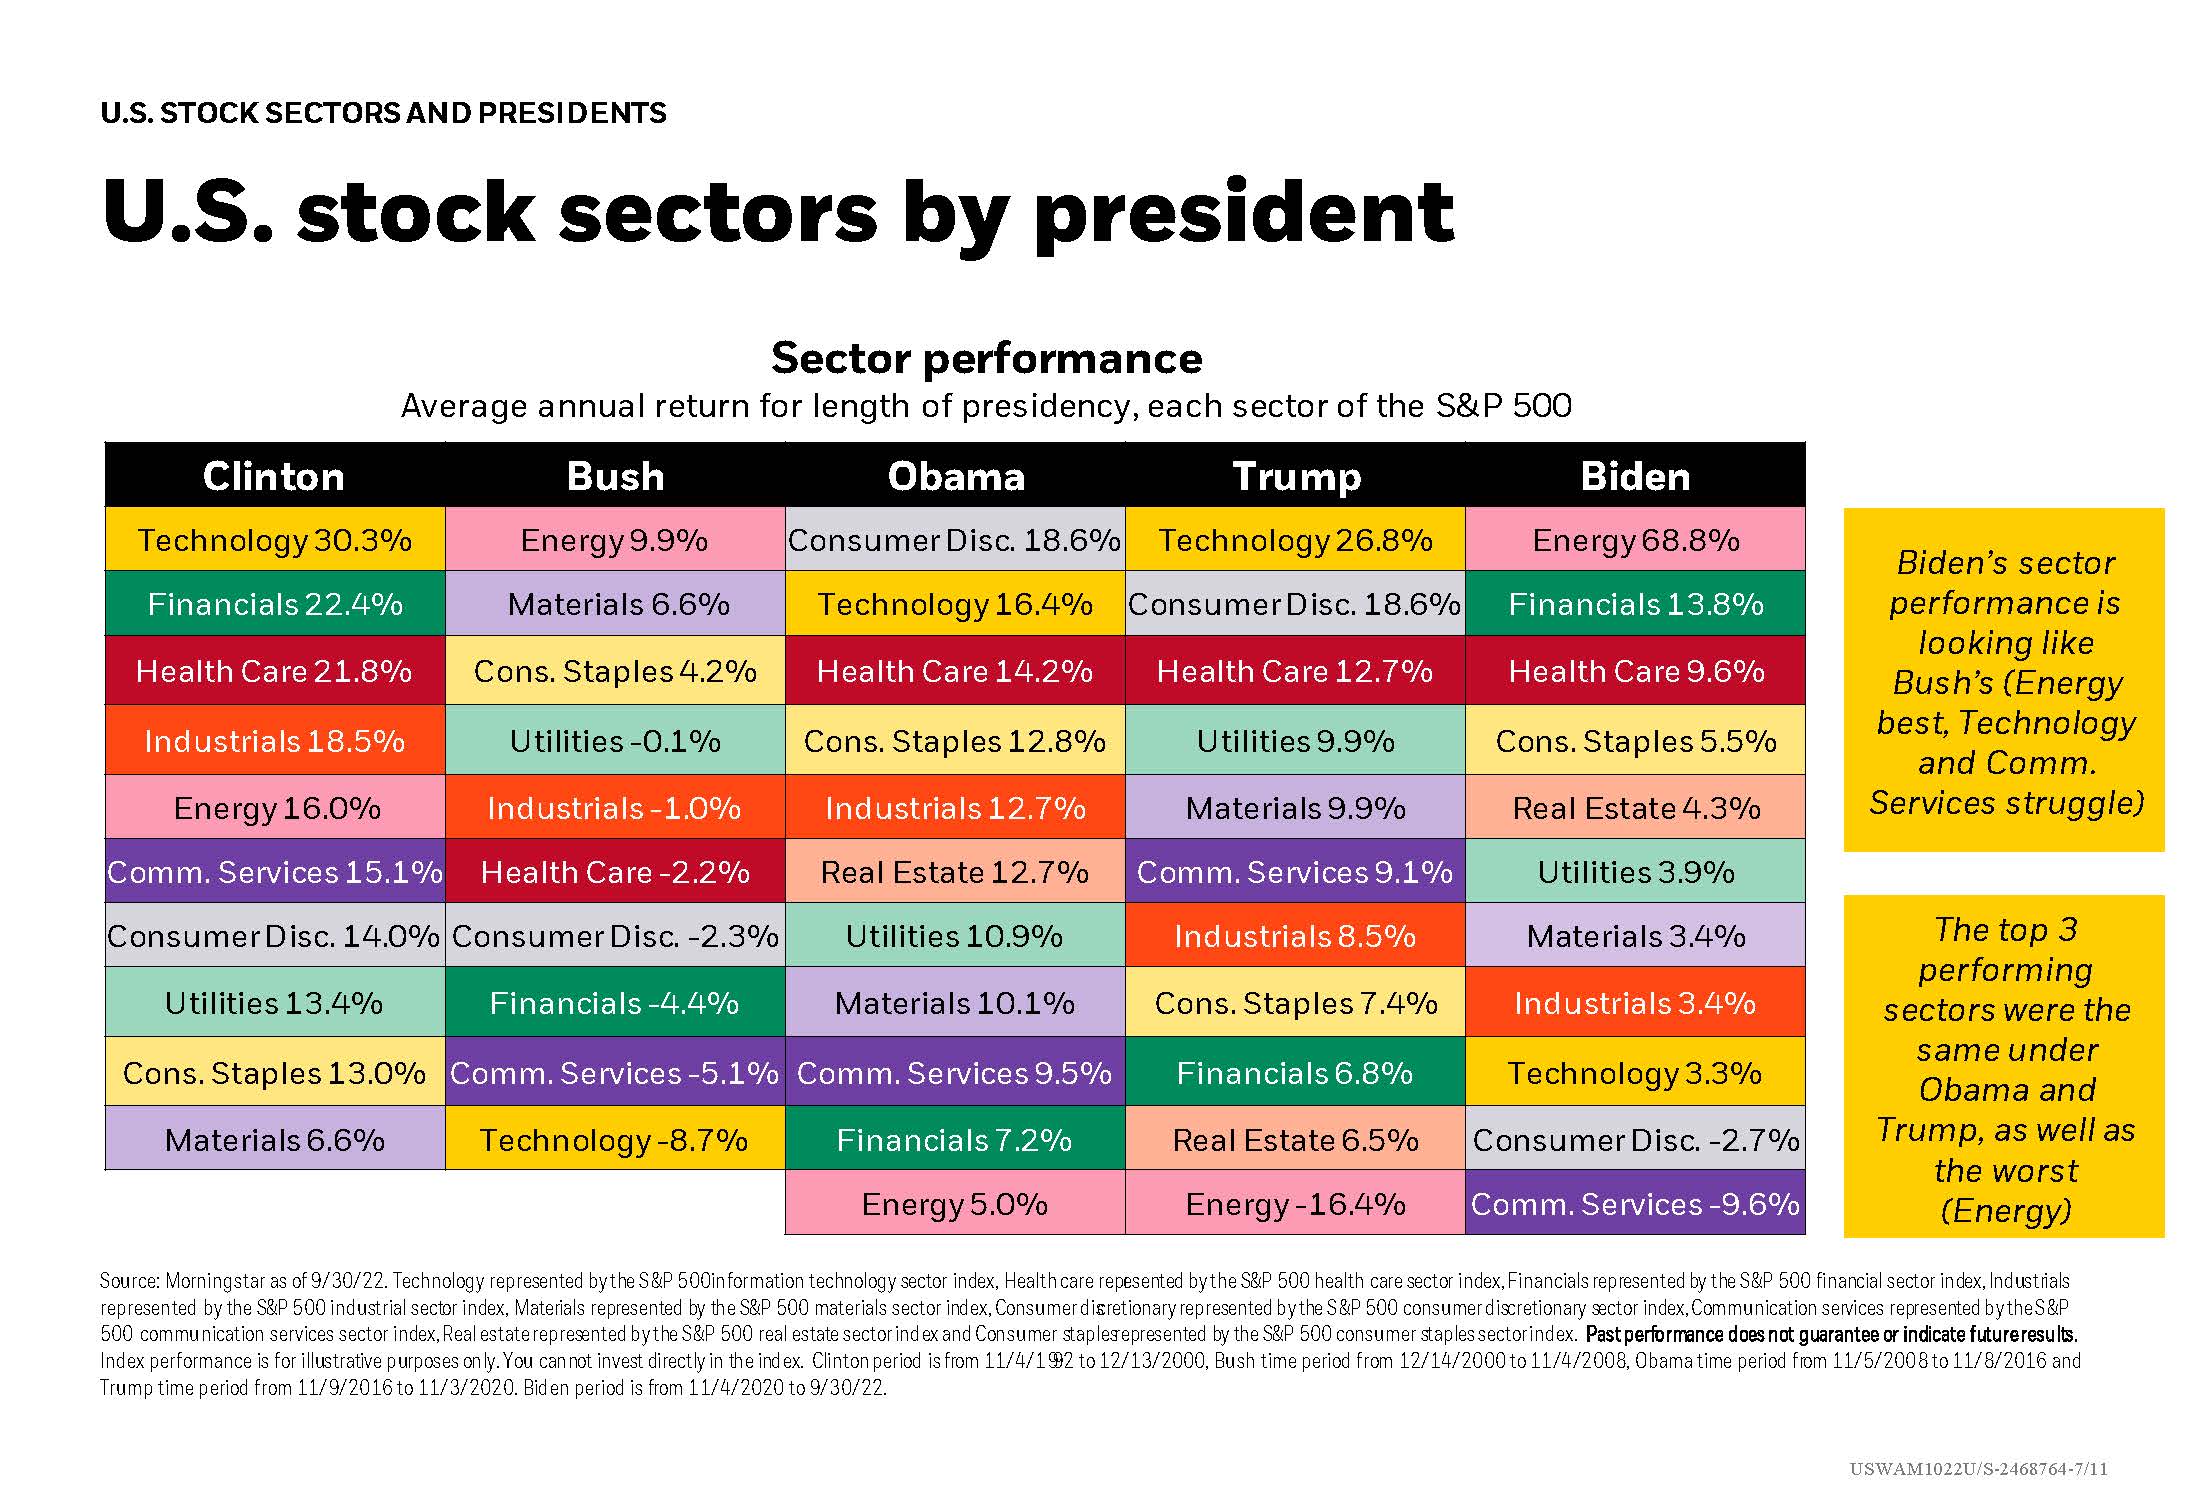
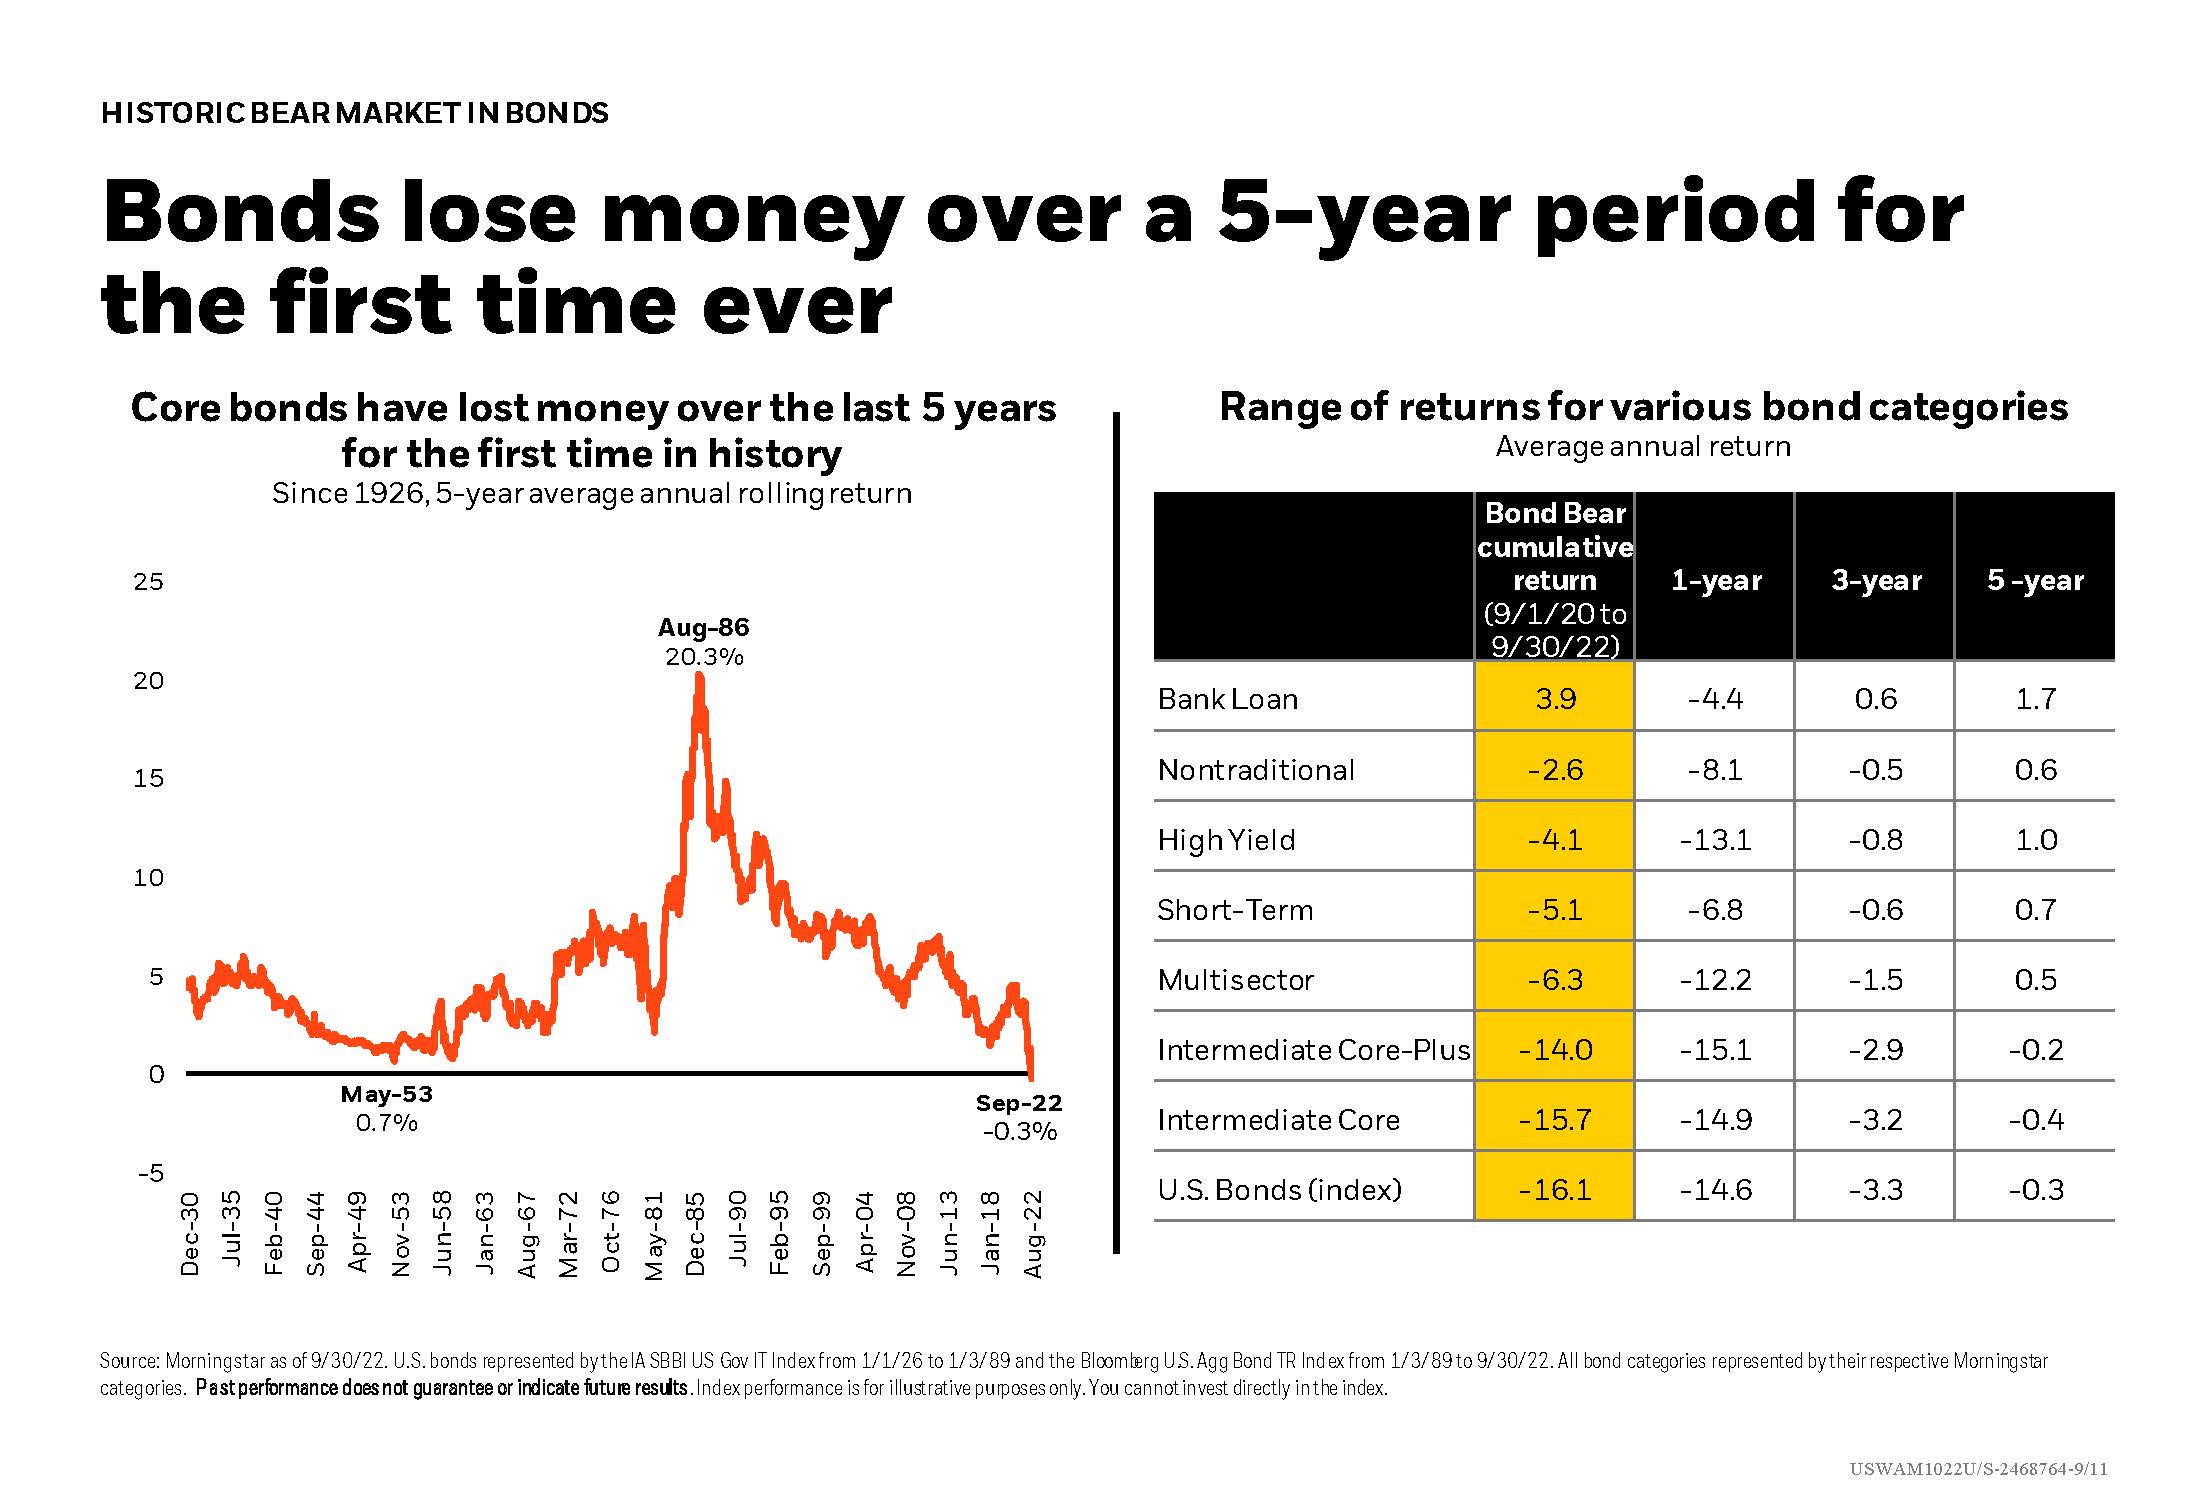
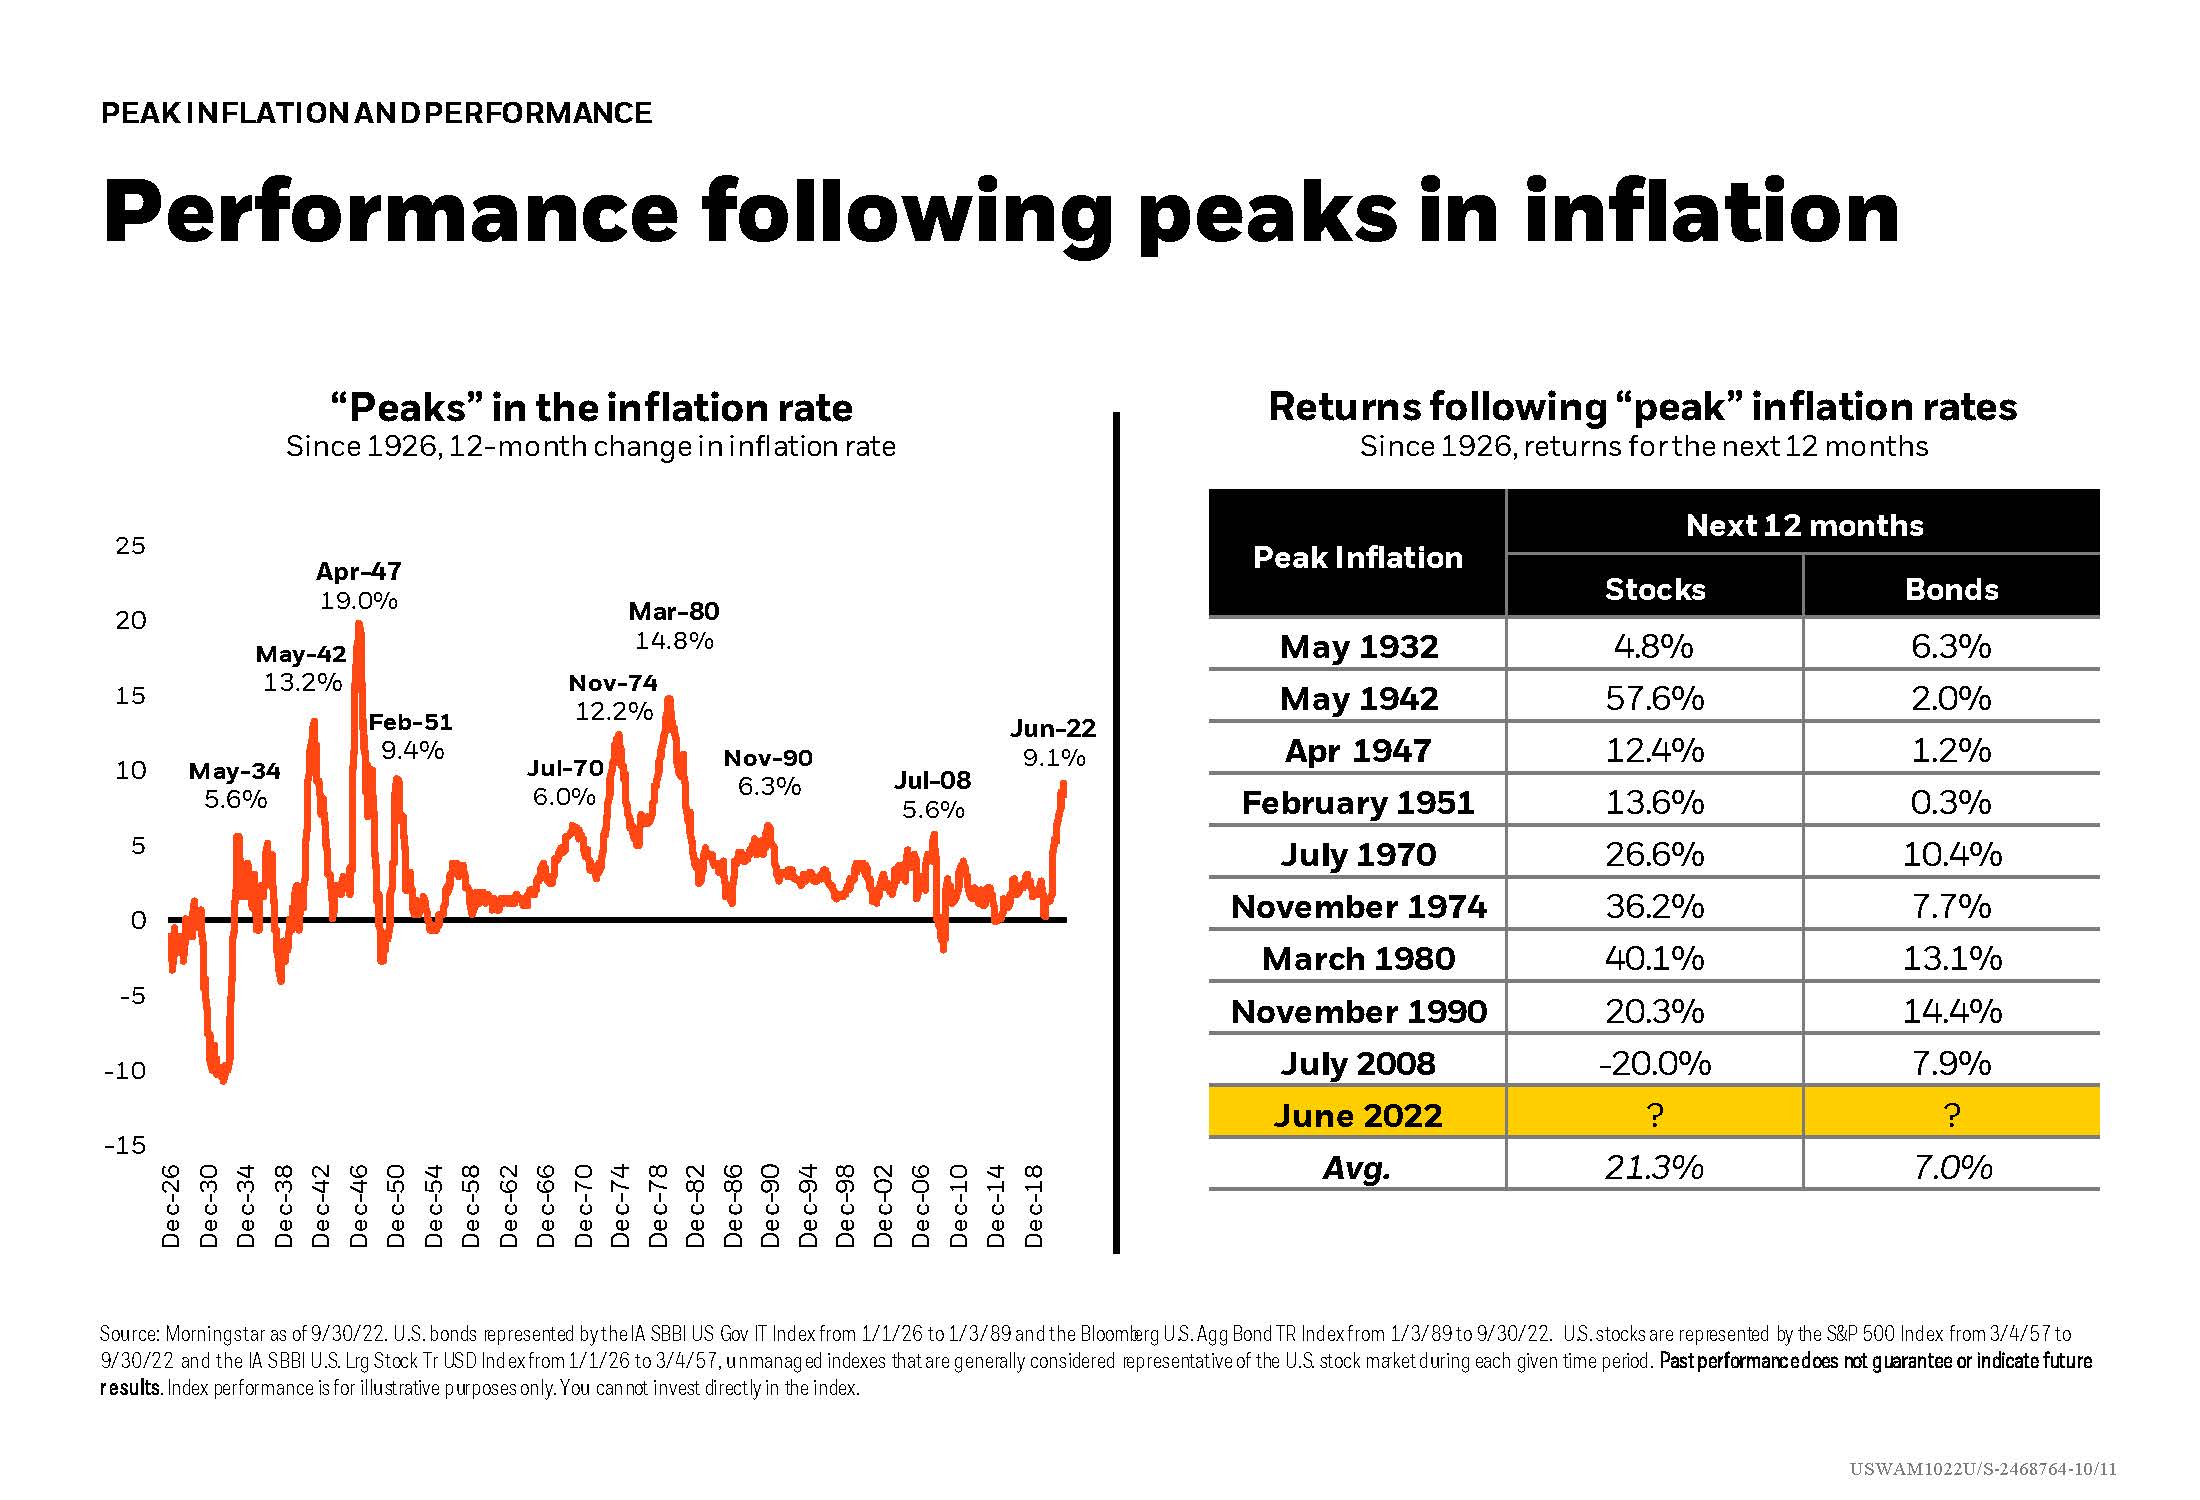
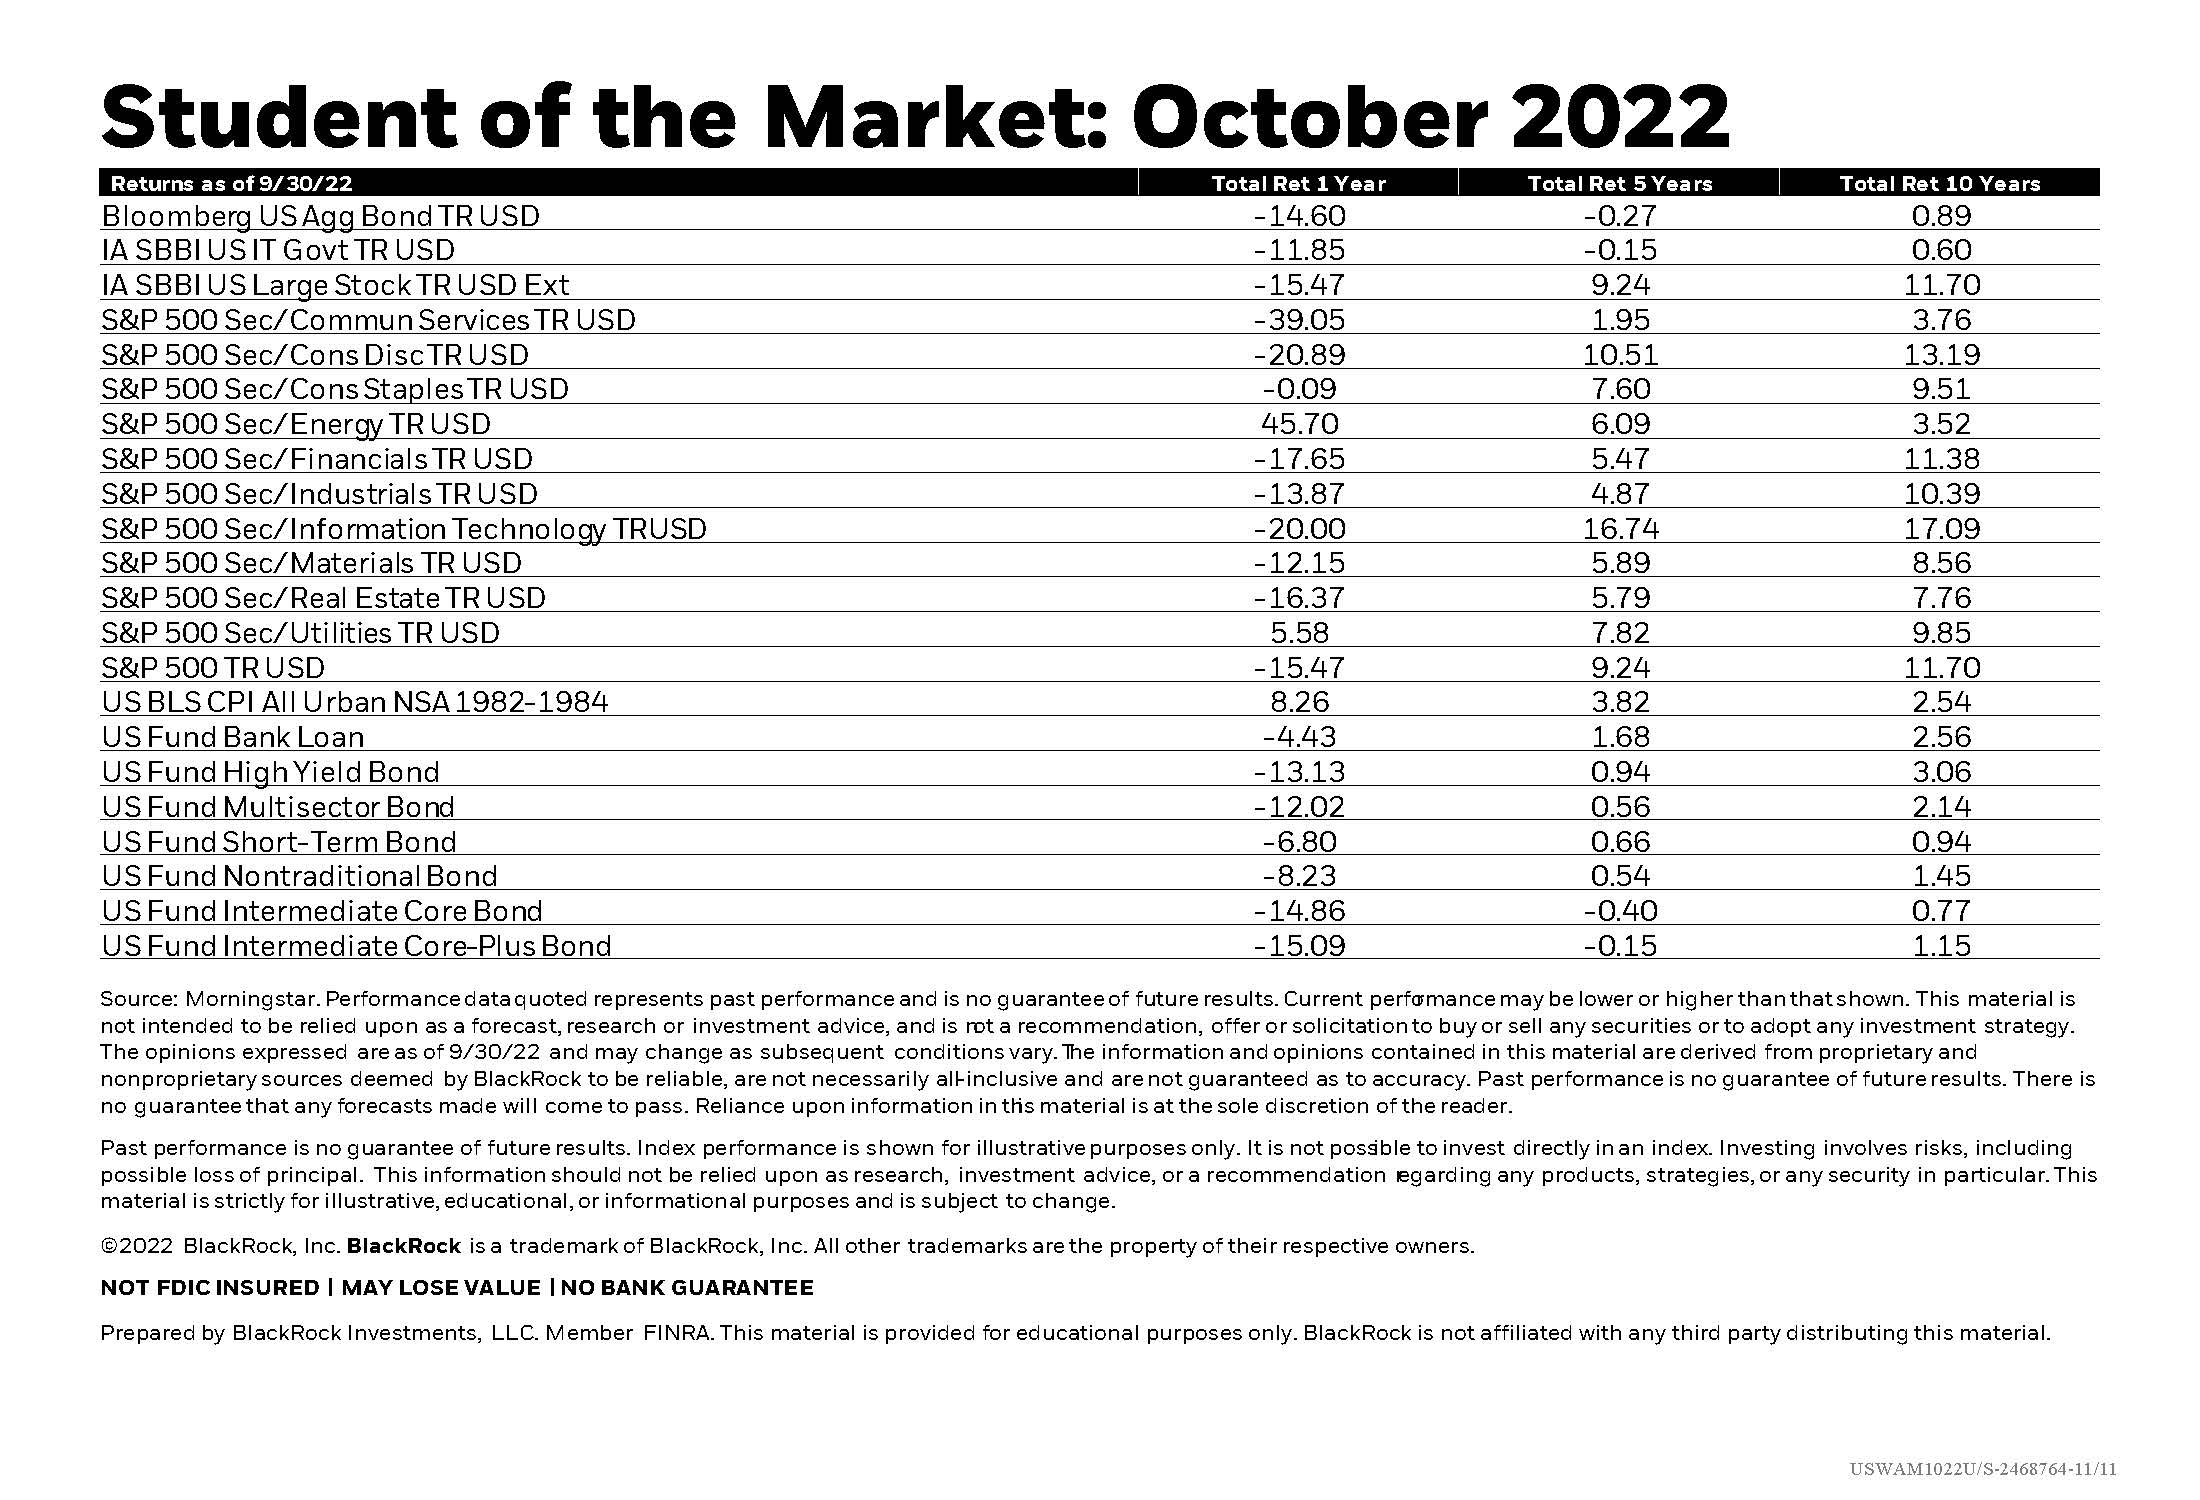
As market volatility continues and the mid-term election draws rapidly near, this month’s Student of the Market gives insight into the relationship between midterm election years and market performance.  You might be surprised to see the breakdown of U.S. stock sector performance for the last five Presidents. Also stats on performance following peaks in inflation and performance 12 months after bad starts for bonds/stocks, may bring some relief.

October 24, 2022
Historic Bear Market in Bonds
Important Disclosure: Content on our website and in our newsletters is for informational purposes only. The information provided may (or may not) directly apply to your situation. We recommend that readers work directly with a professional advisor when making decisions in the context of their specific situation.

Other content you may like

  • Stock Volatility by Presidential Election Year

    Stock Volatility by Presidential Election Year

    February 27, 2024
    Can something be learned from studying the past? Historical data showing that stock market volatility during election years has been generally subdued unless there is a large recession, such as in ’32, ’08 and ’20. A brief look at the large swings between growth and value, stocks vs cash, data gives a glimpse of the average stock market return following January since 1926, and how the bear market was recently tamed.
    Read this Article
  • Historic Tandem Stock and Bond Returns

    Historic Tandem Stock and Bond Returns

    July 21, 2021
    We’ve only seen 4 other time periods since 1926 with back-to-back calendar years of both stock returns above 16% and bond returns above 7%. This Student of the Market for July looks at those stats, along with the top 20 best starts to a year for stocks, long-term equity cycles, taxable bond fund flows and interesting inflation disconnects.
    Read this Article
  • Money Market Assets at Historic Peak

    March 30, 2023
    This month’s Student of the Market looks at U.S. stock performance after peaks in Money Market fund assets and performance following peaks in inflation. The big question in many minds is “how long will this inflation last?” An answer might be found in these stats on prior inflation cycles. Plus a chart on a possible downside with risky income asset classes and more market insights.
    Read this Article
  • Pioneers of Hope

    June 30, 2020
    We know that there are many reasons to have concern during these times, but we also believe that there are many reasons to celebrate and have hope for the future.
    Read this Article
  • The link you have selected is located on another server. The linked site contains information that has been created, published, maintained, or otherwise posted by institutions or organizations independent of this organization. We do not endorse, approve, certify, or control any linked websites, their sponsors, or any of their policies, activities, products, or services. We do not assume responsibility for the accuracy, completeness, or timeliness of the information contained therein. Visitors to any linked websites should not use or rely on the information contained therein until they have consulted with an independent financial professional. Please click “Continue to Link” to leave this website and proceed to the selected site.
    phone-handset