Article

Stock Volatility by Presidential Election Year

Stock Volatility by Presidential Election Year

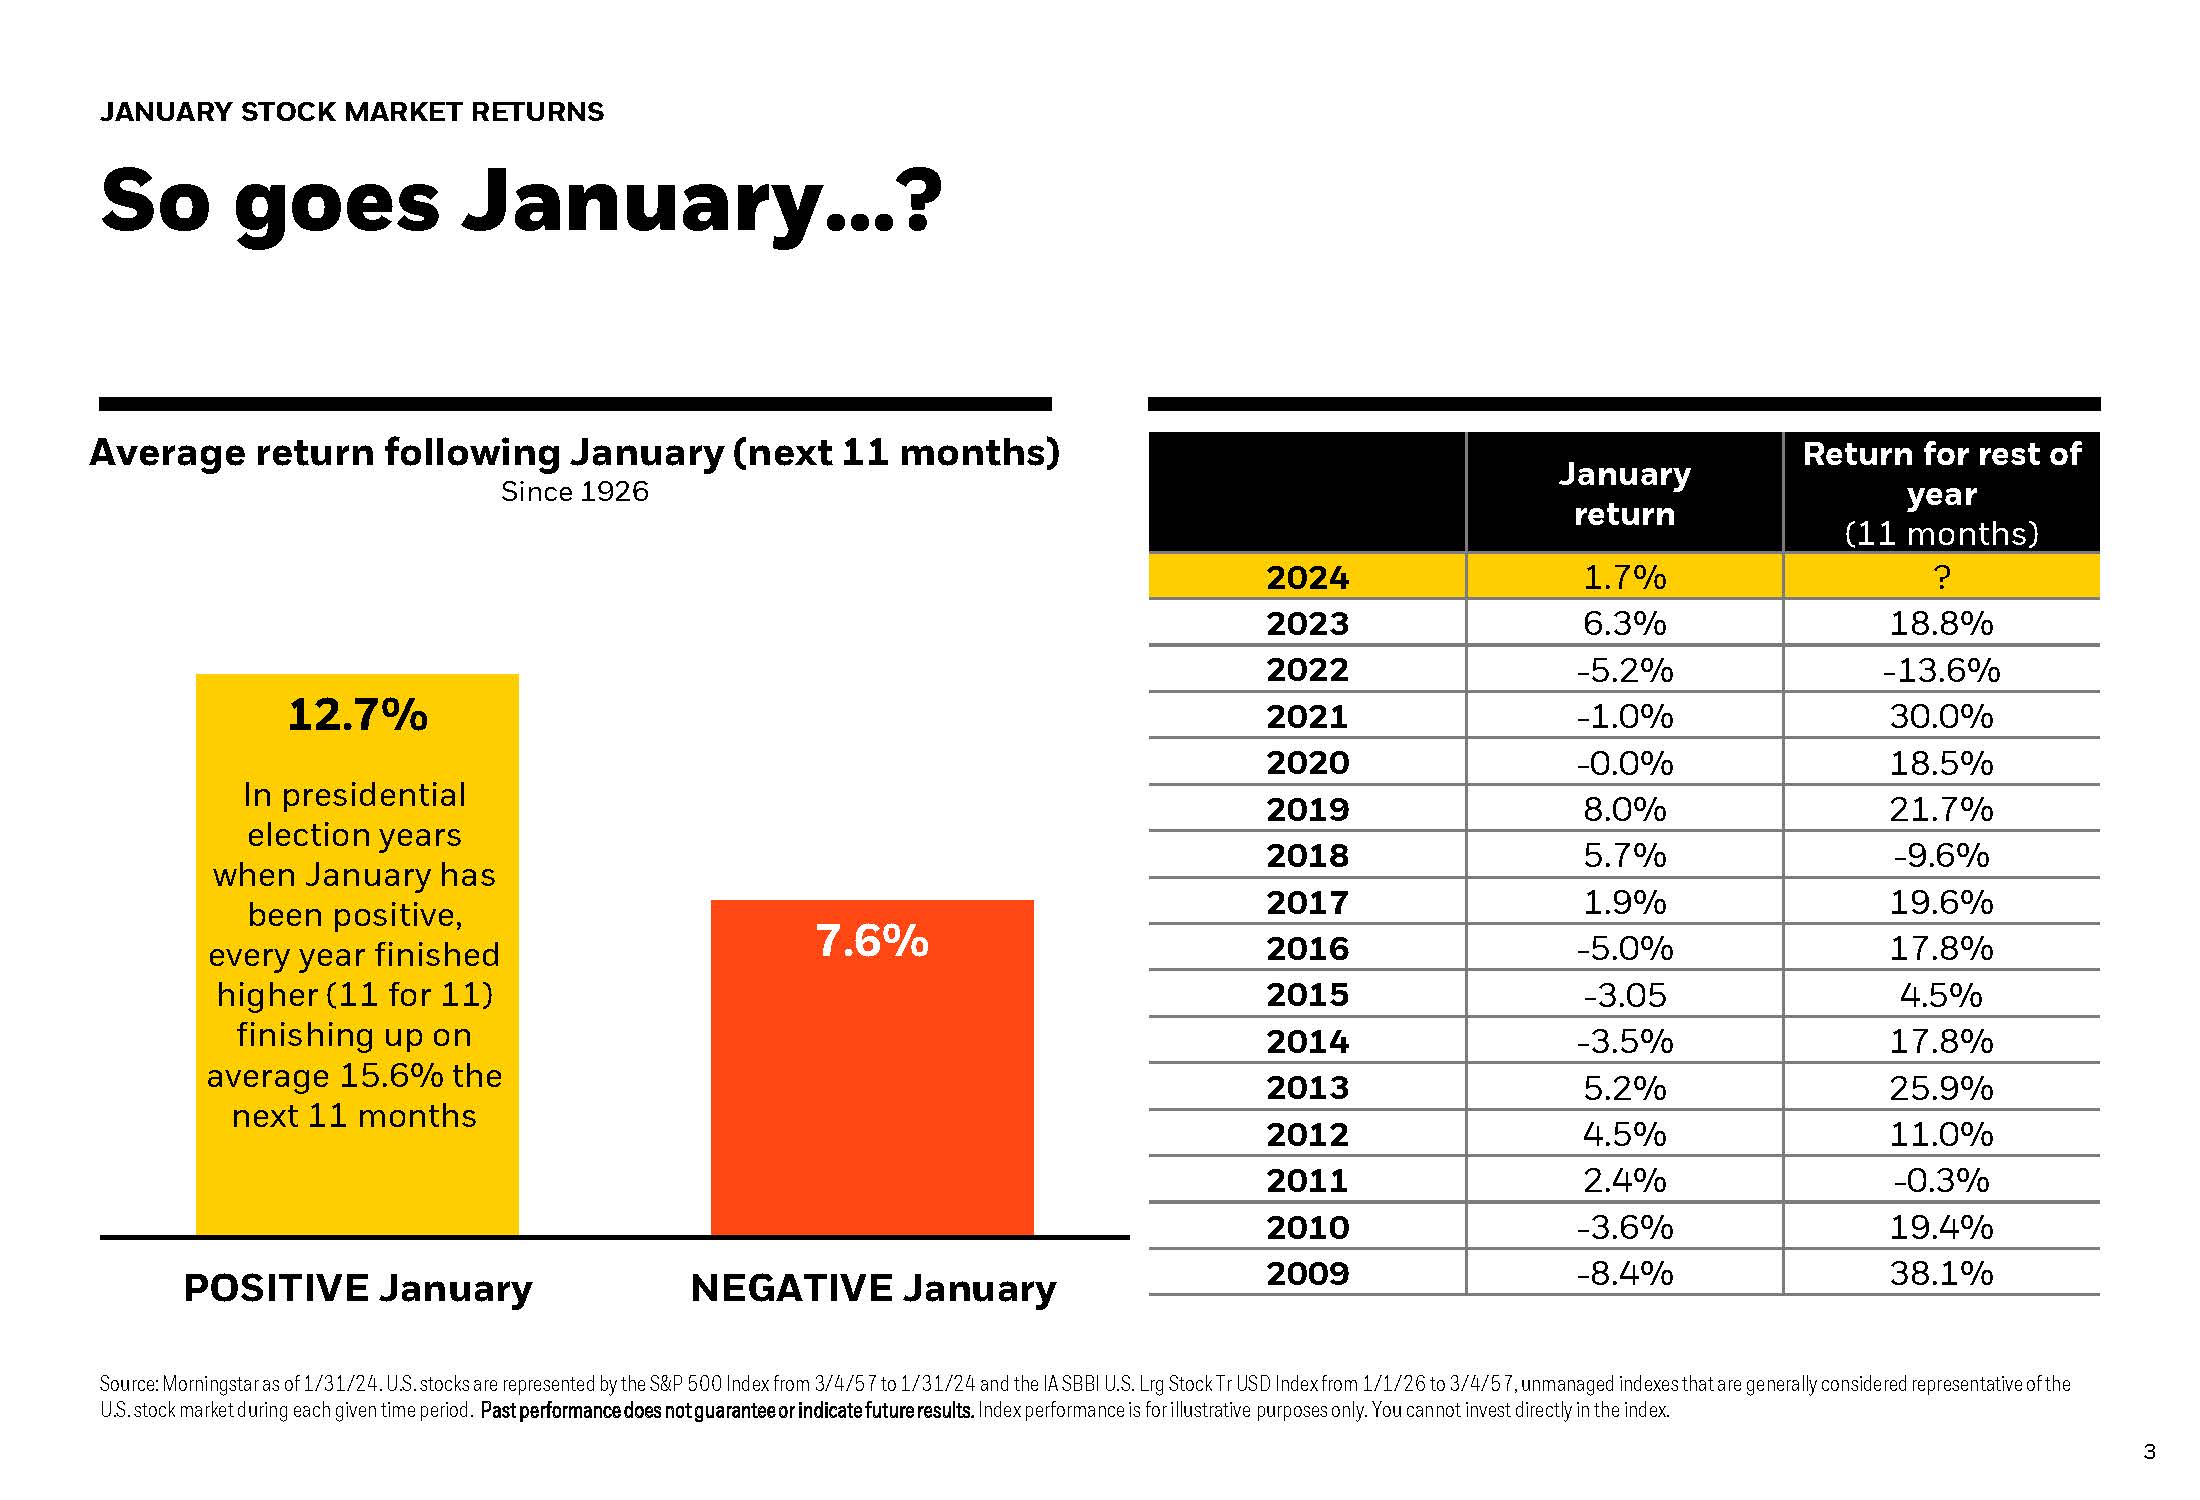
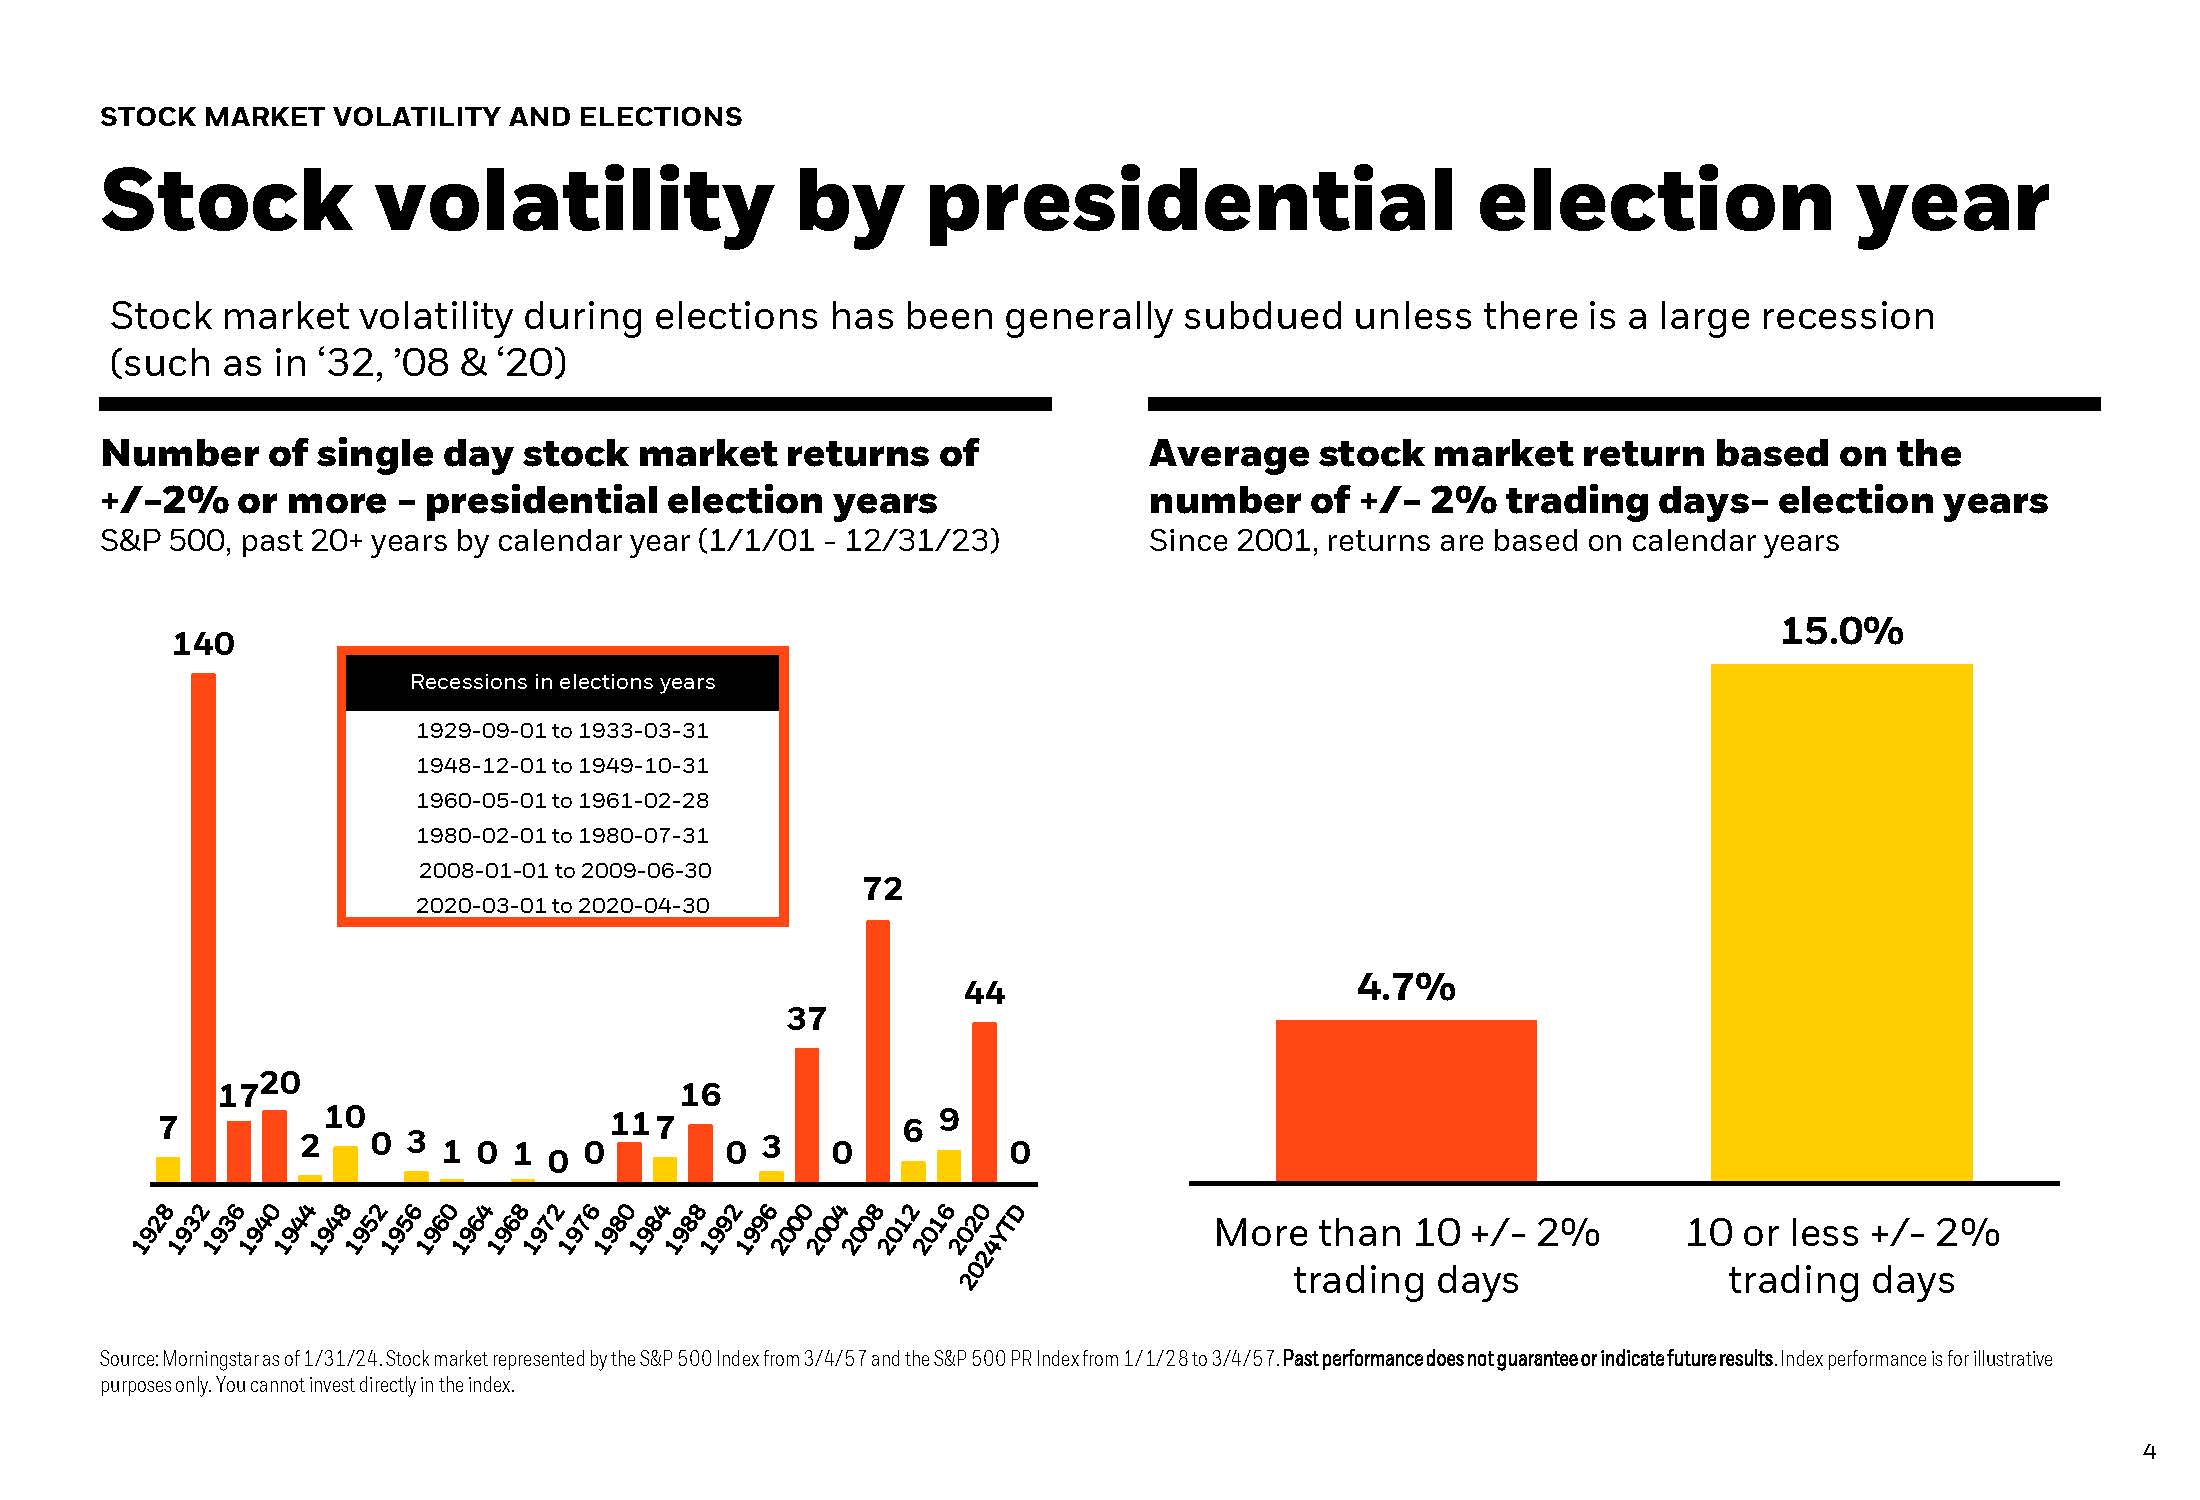
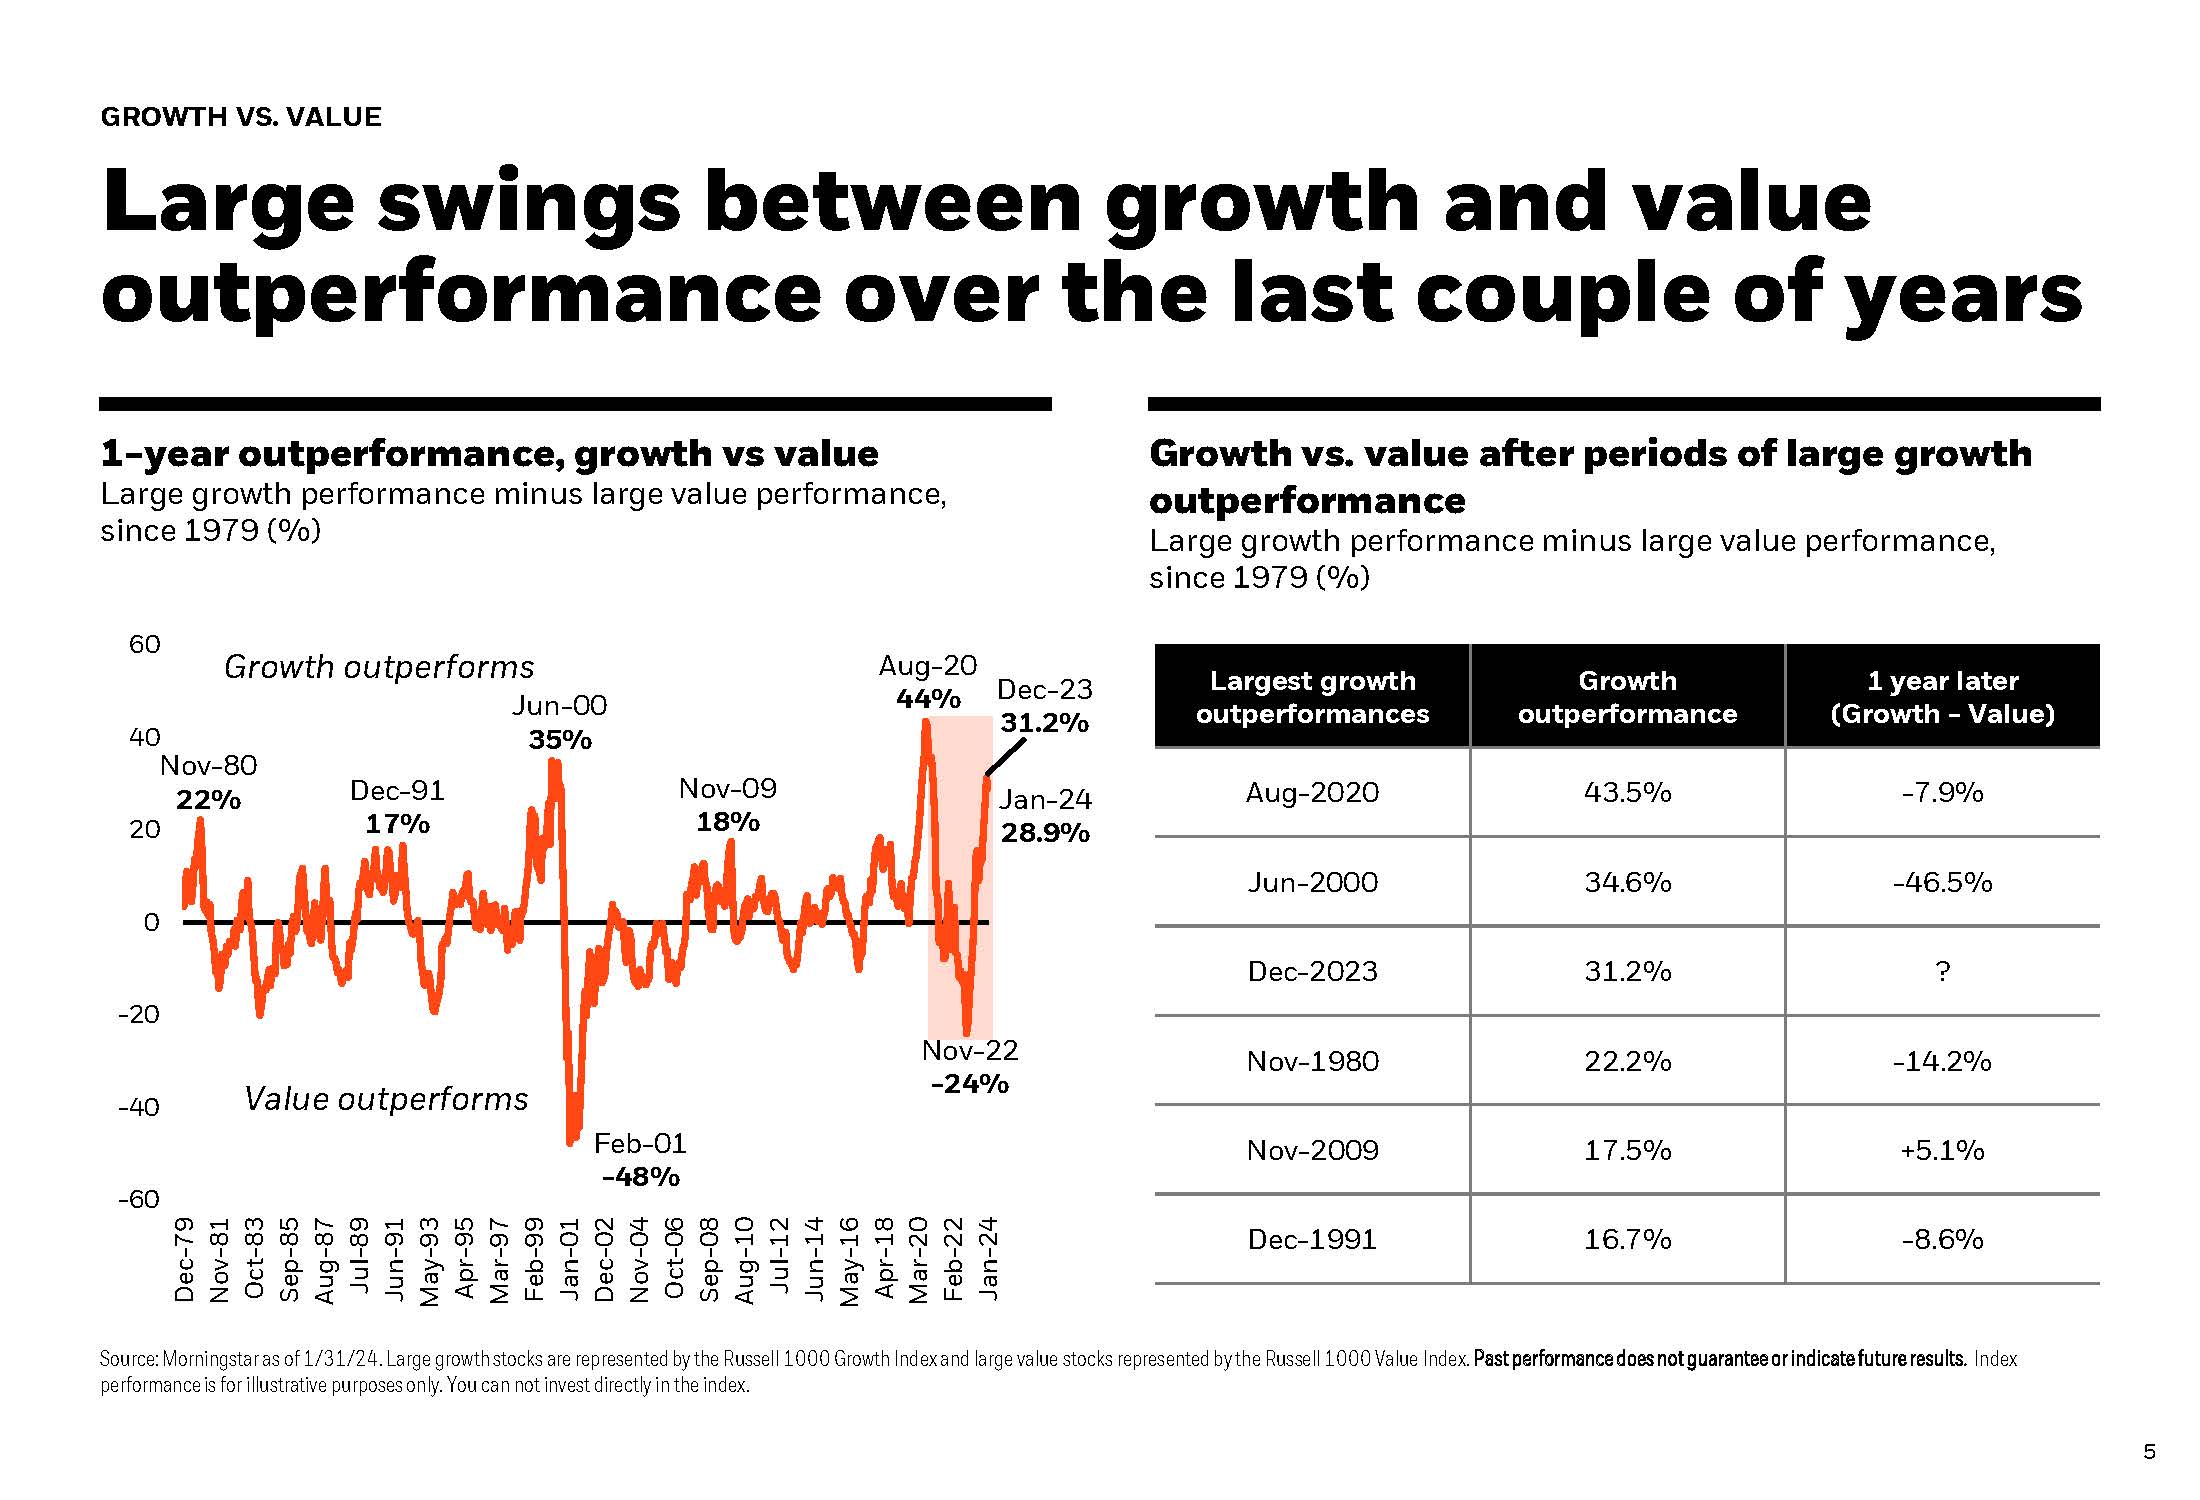
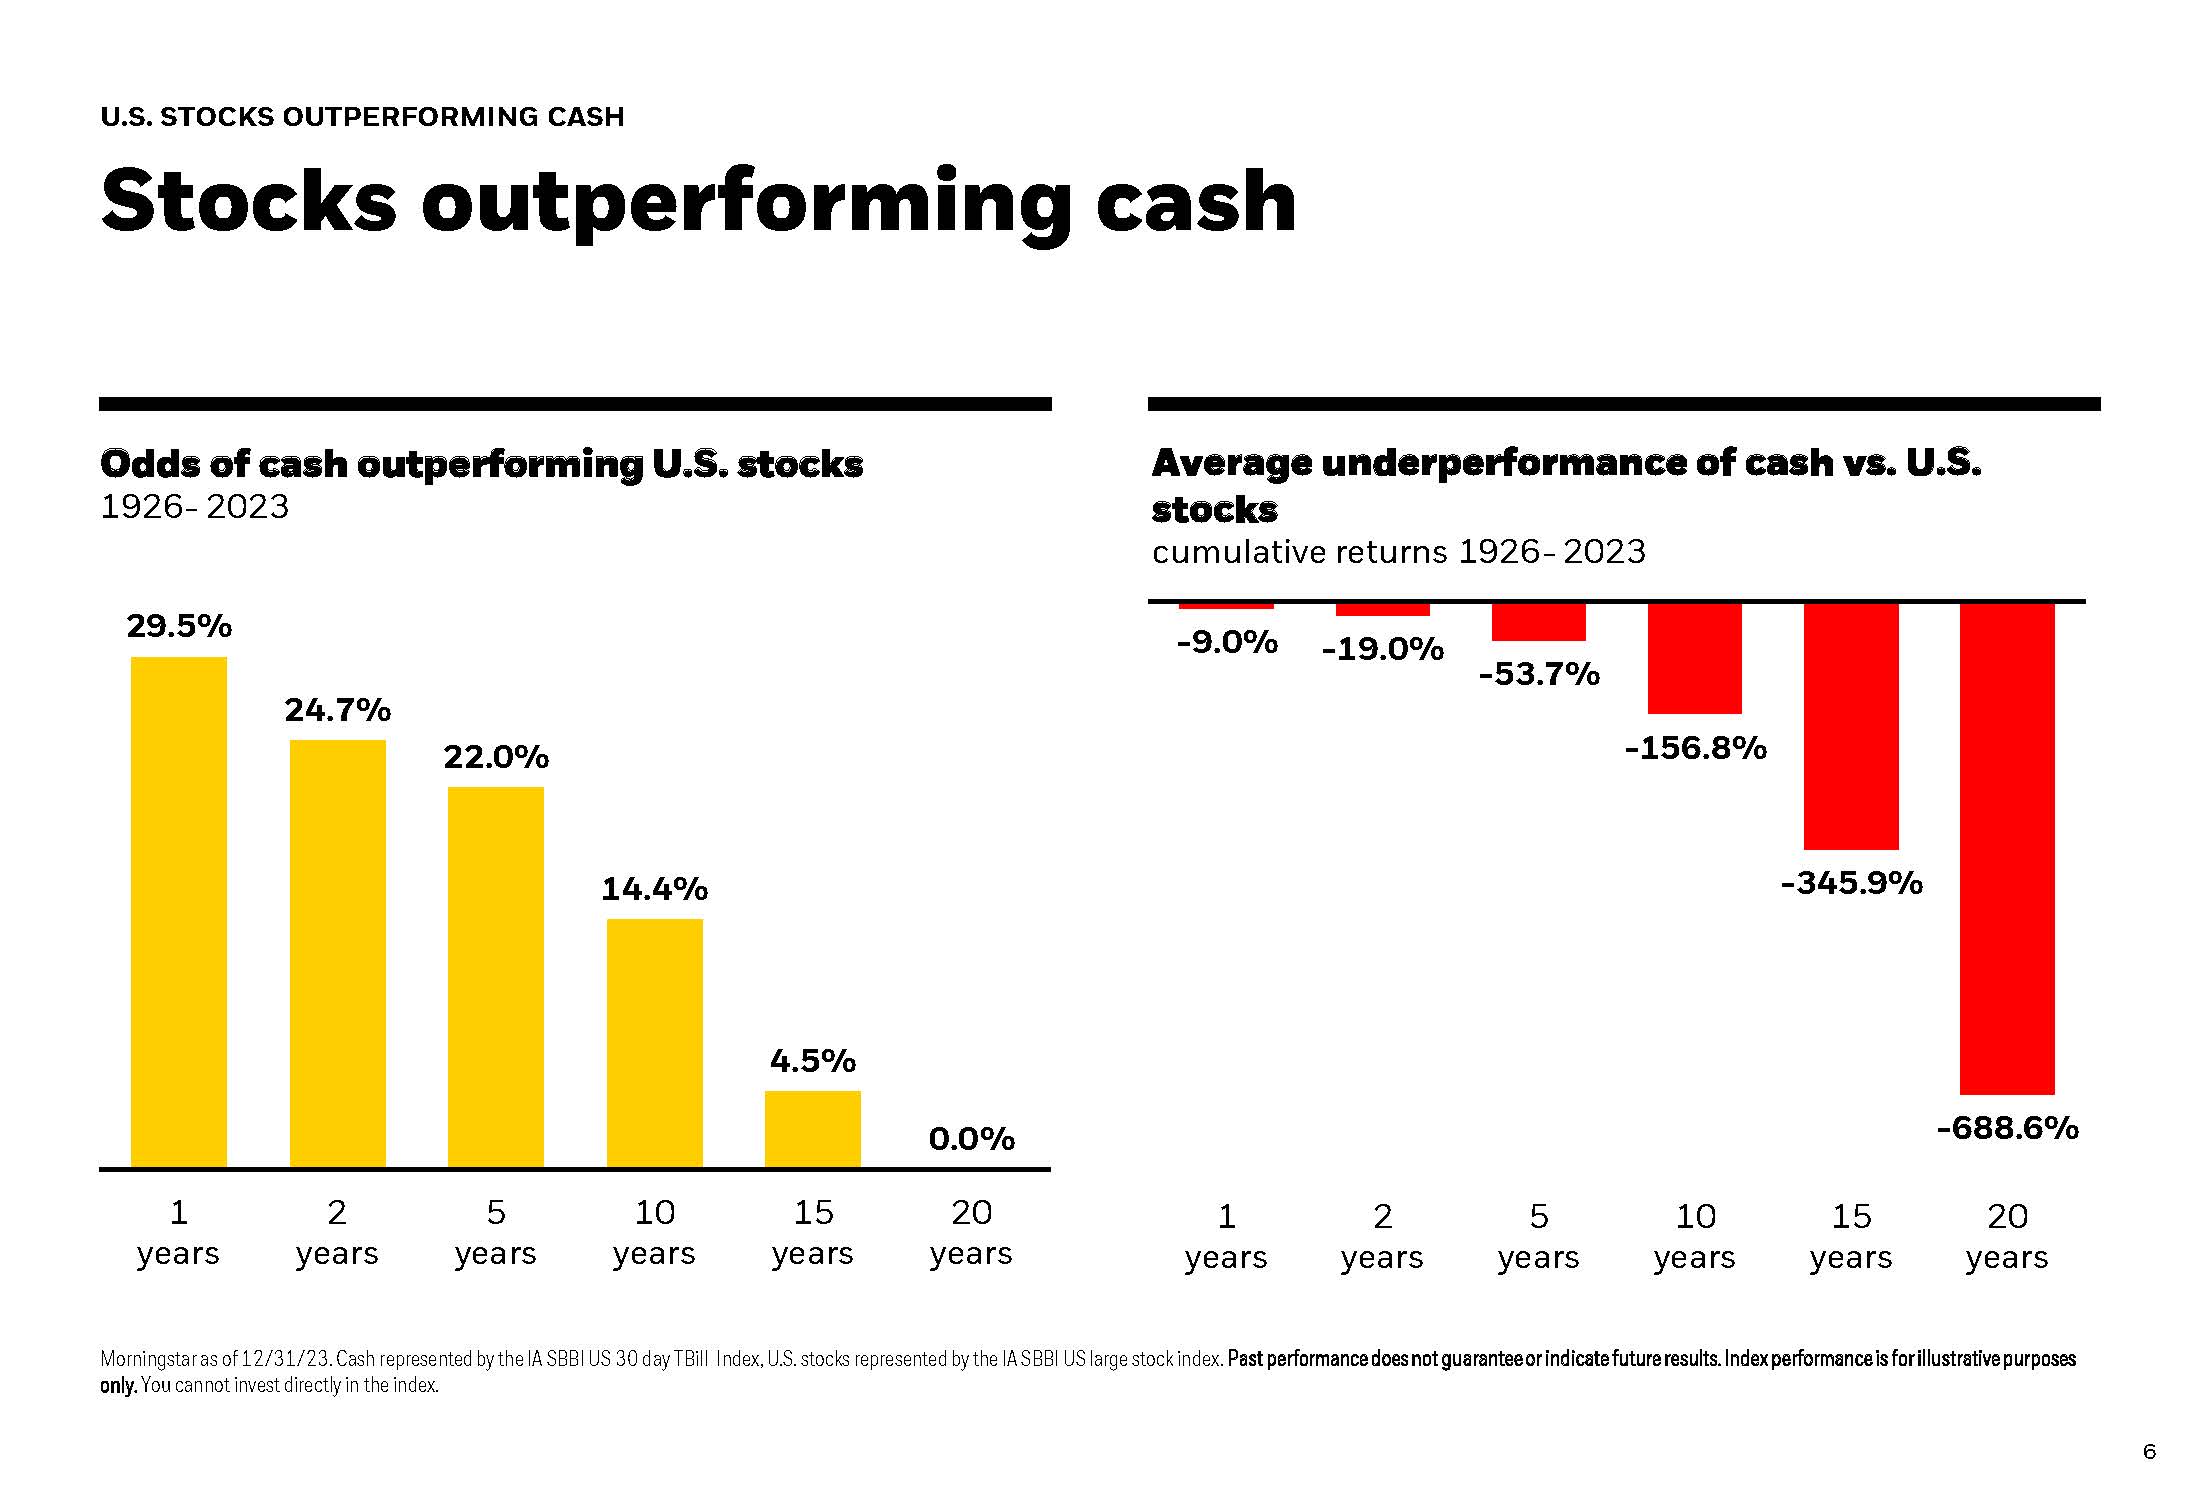
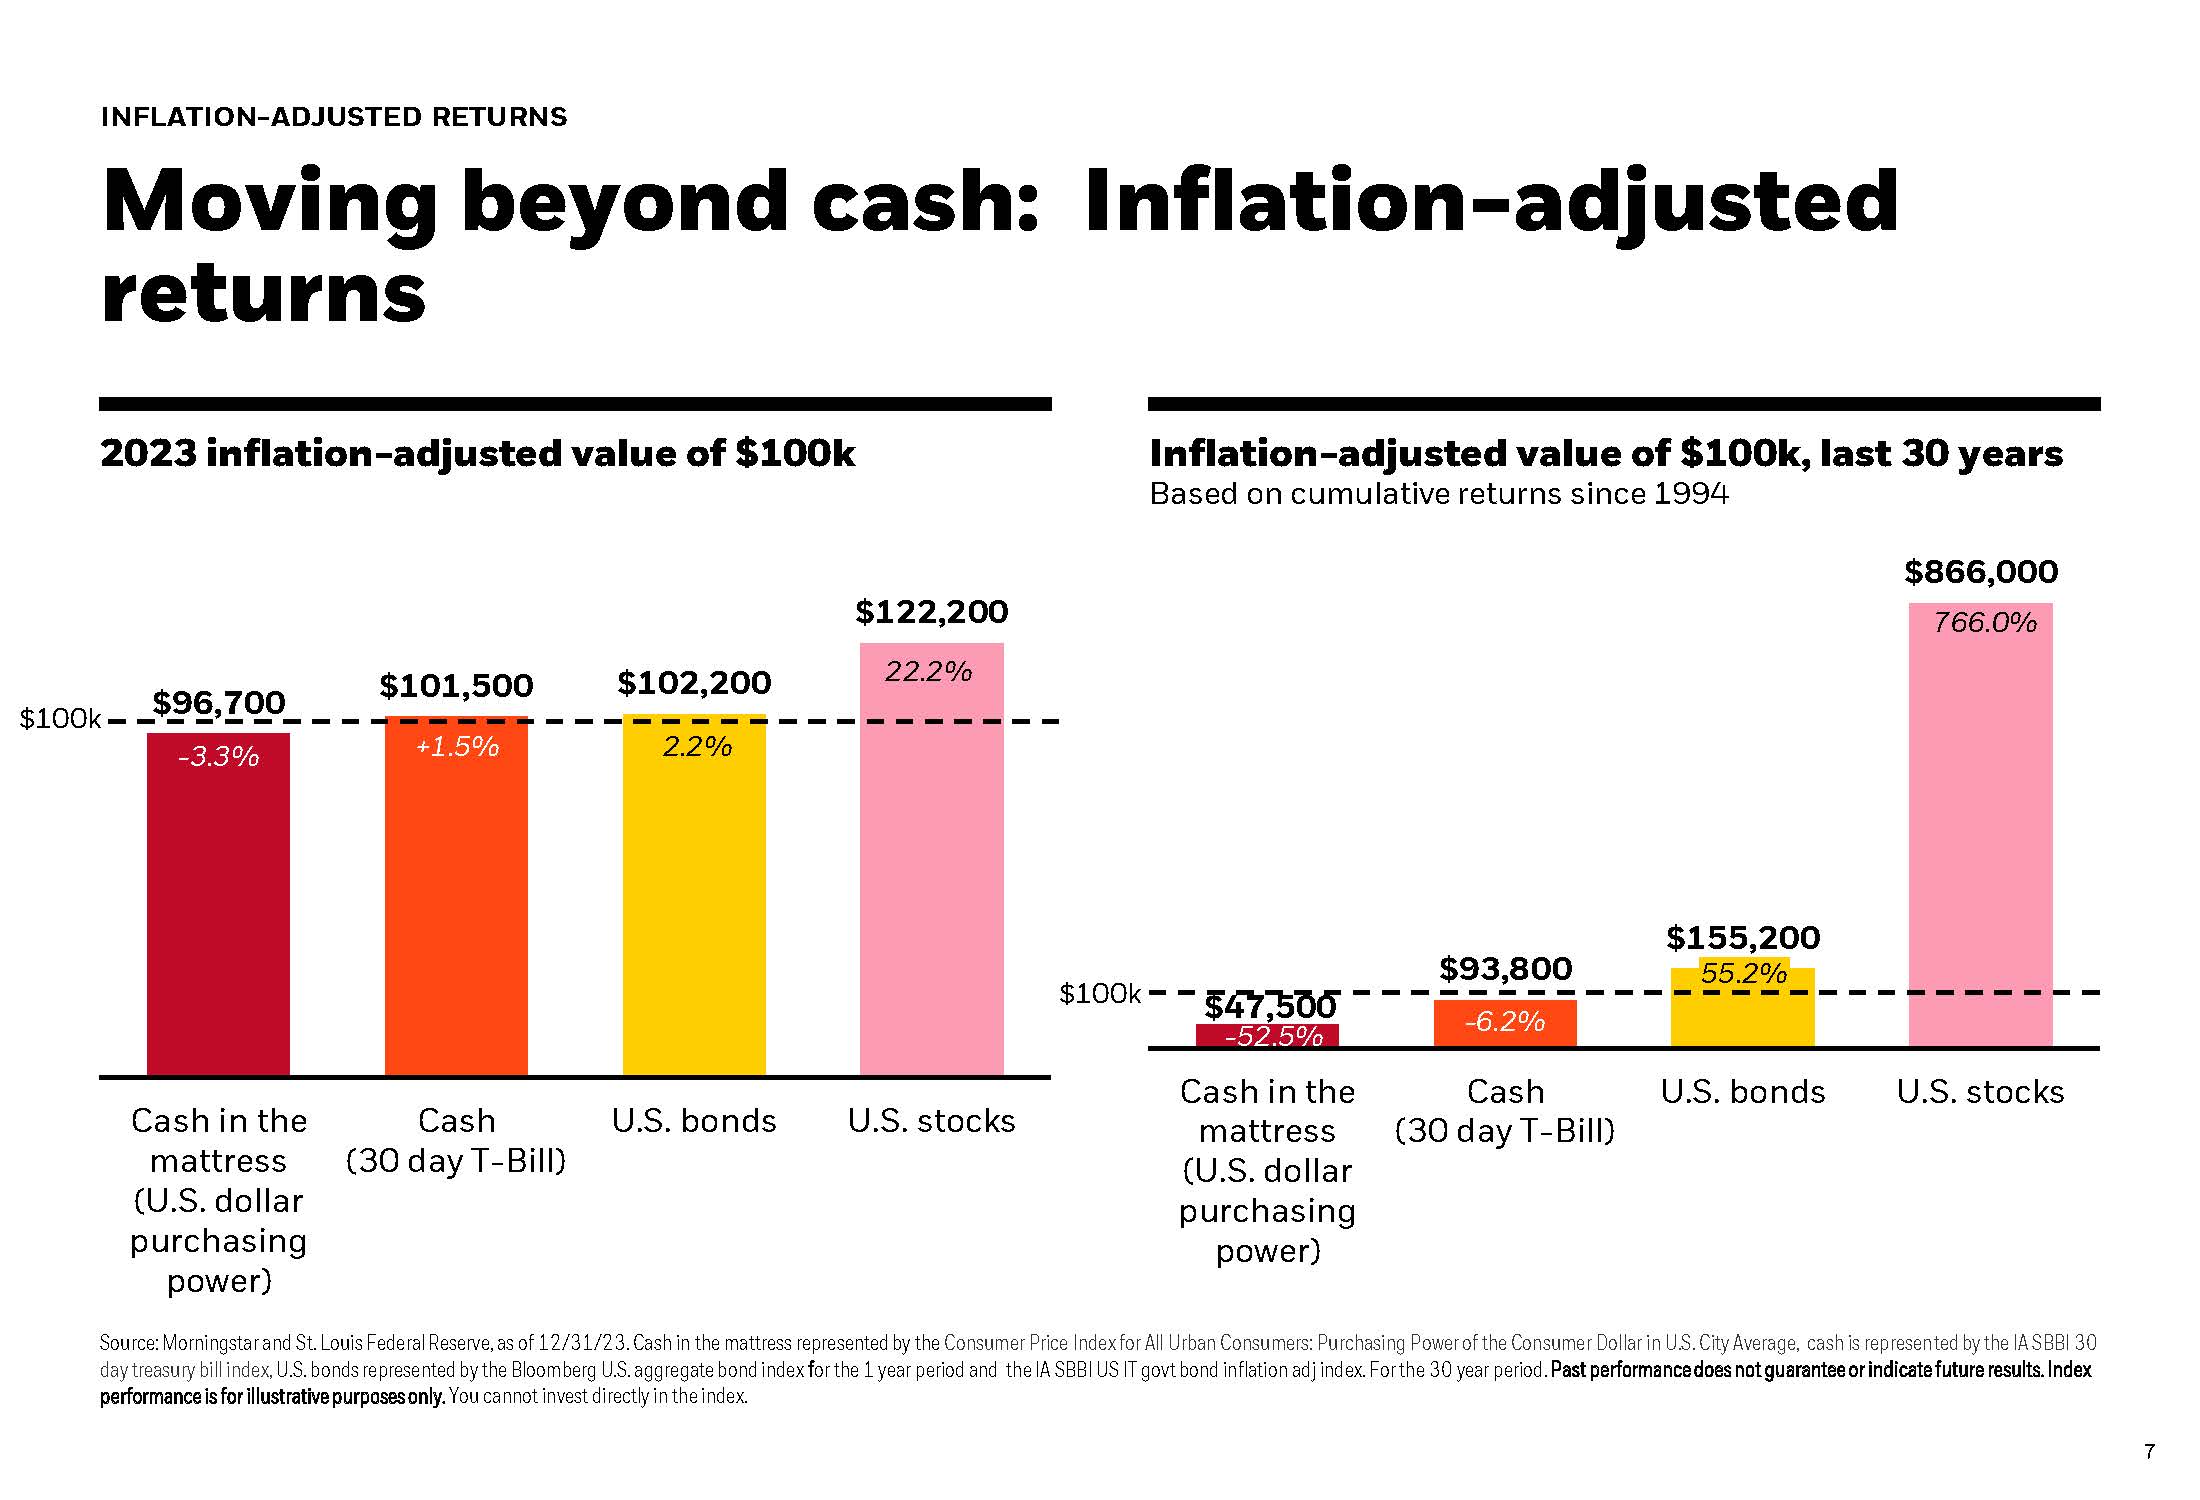
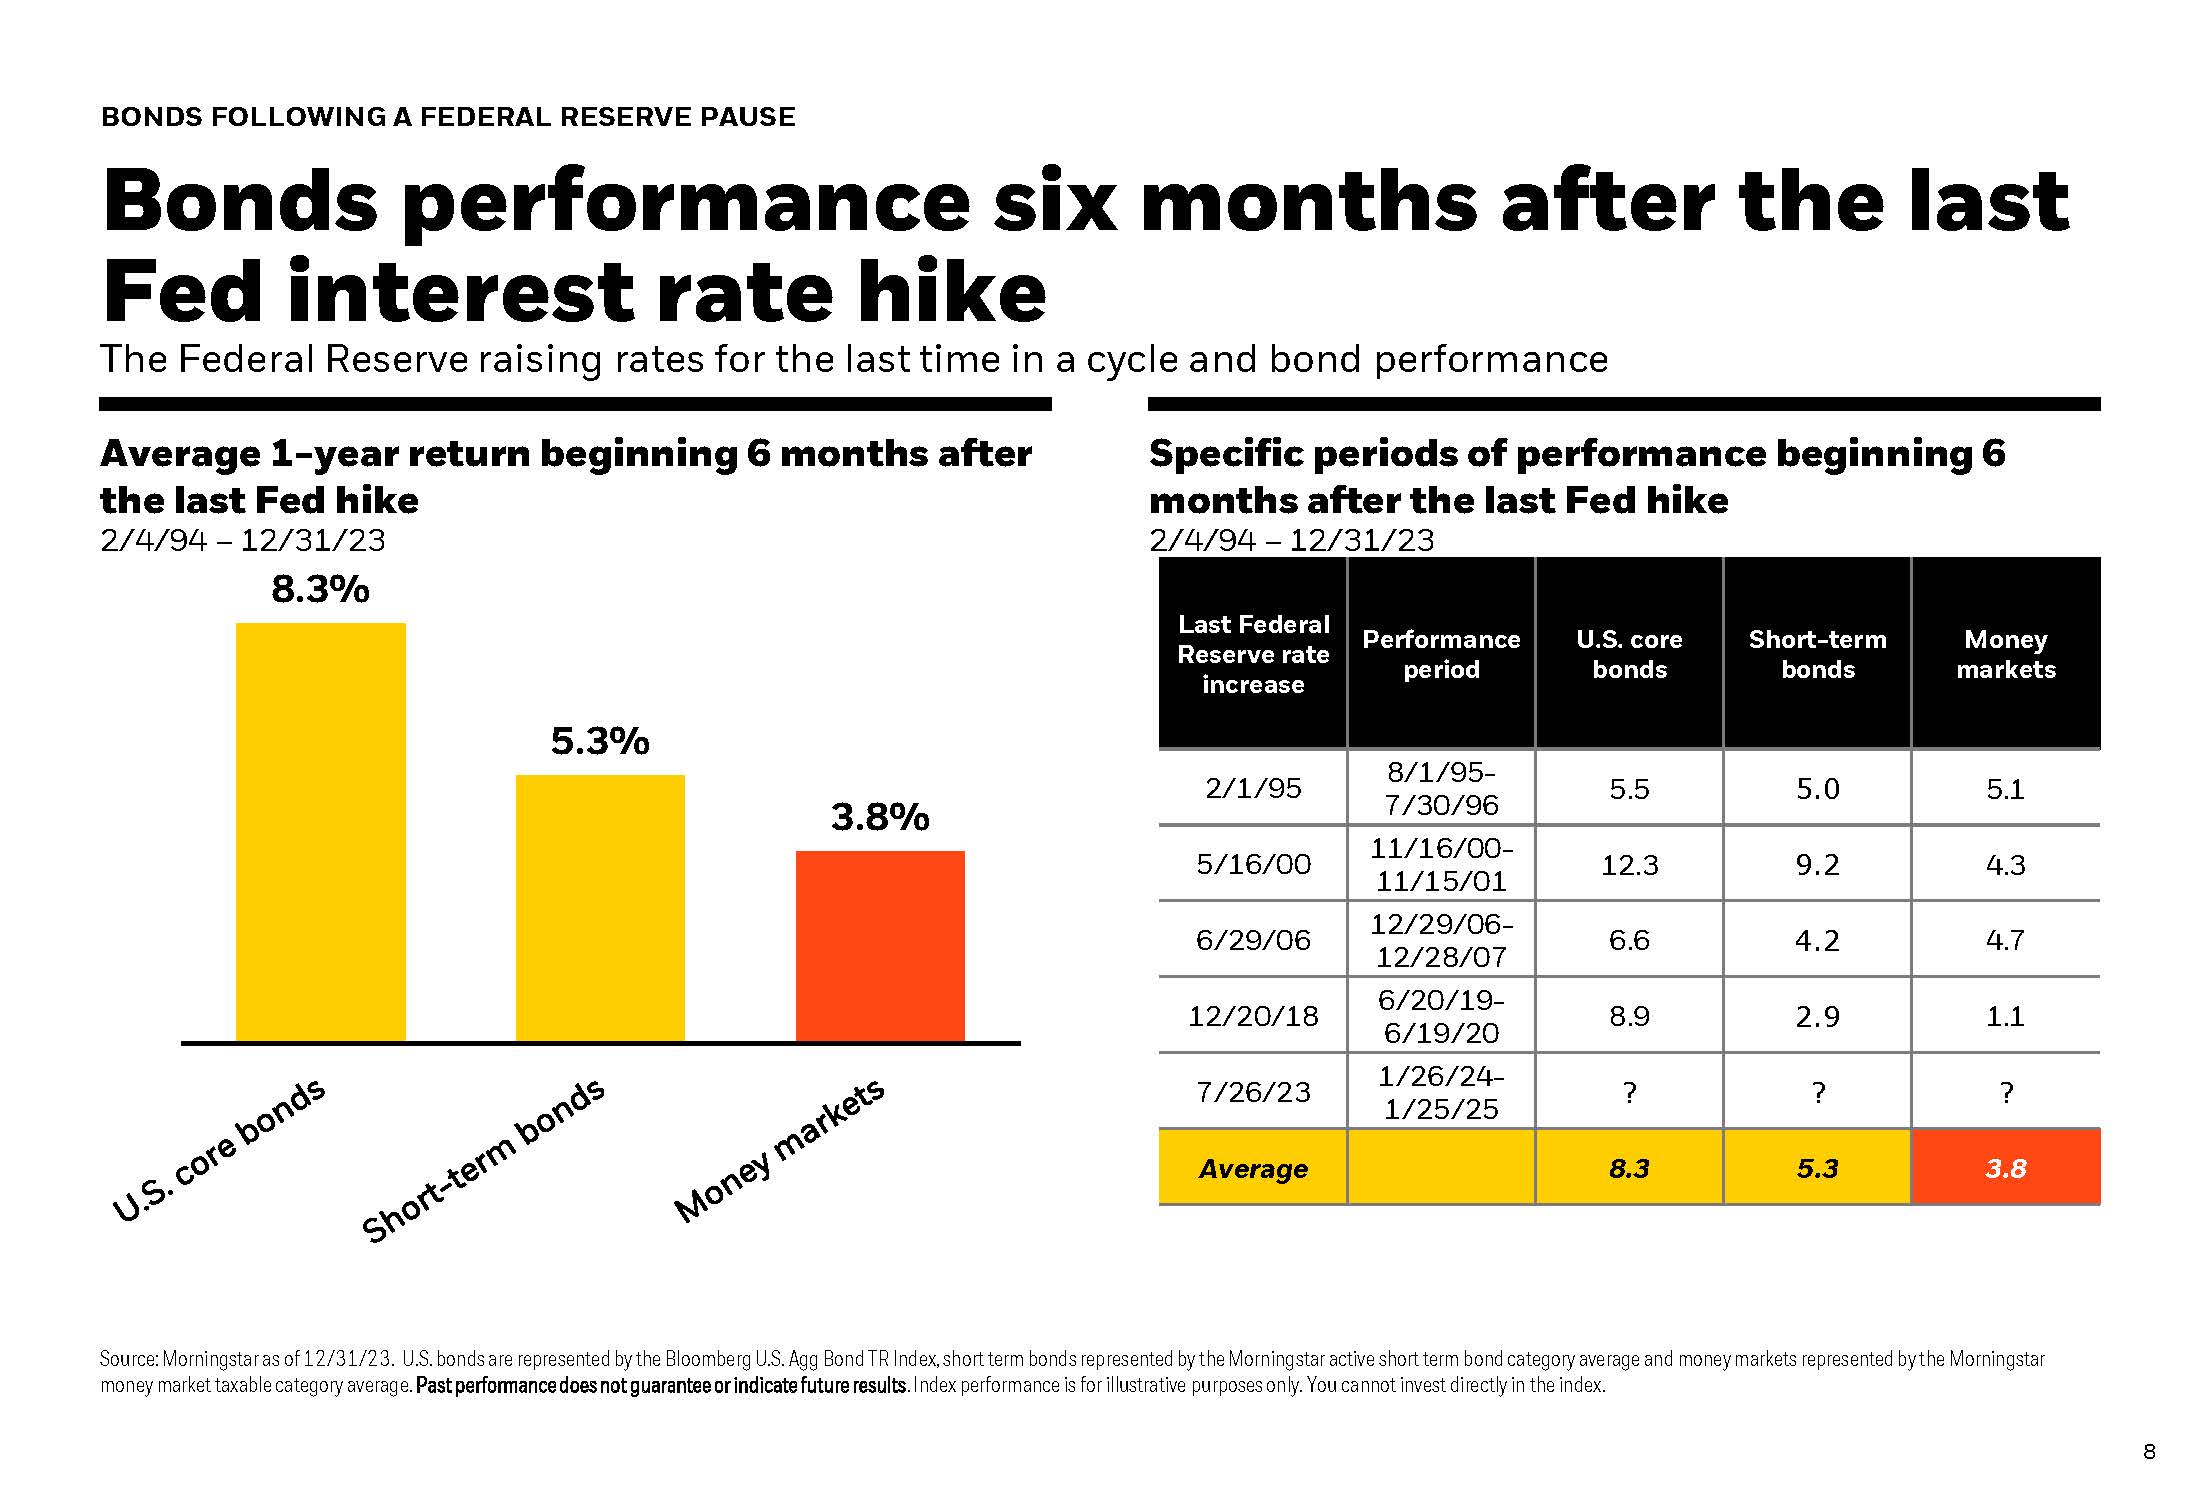
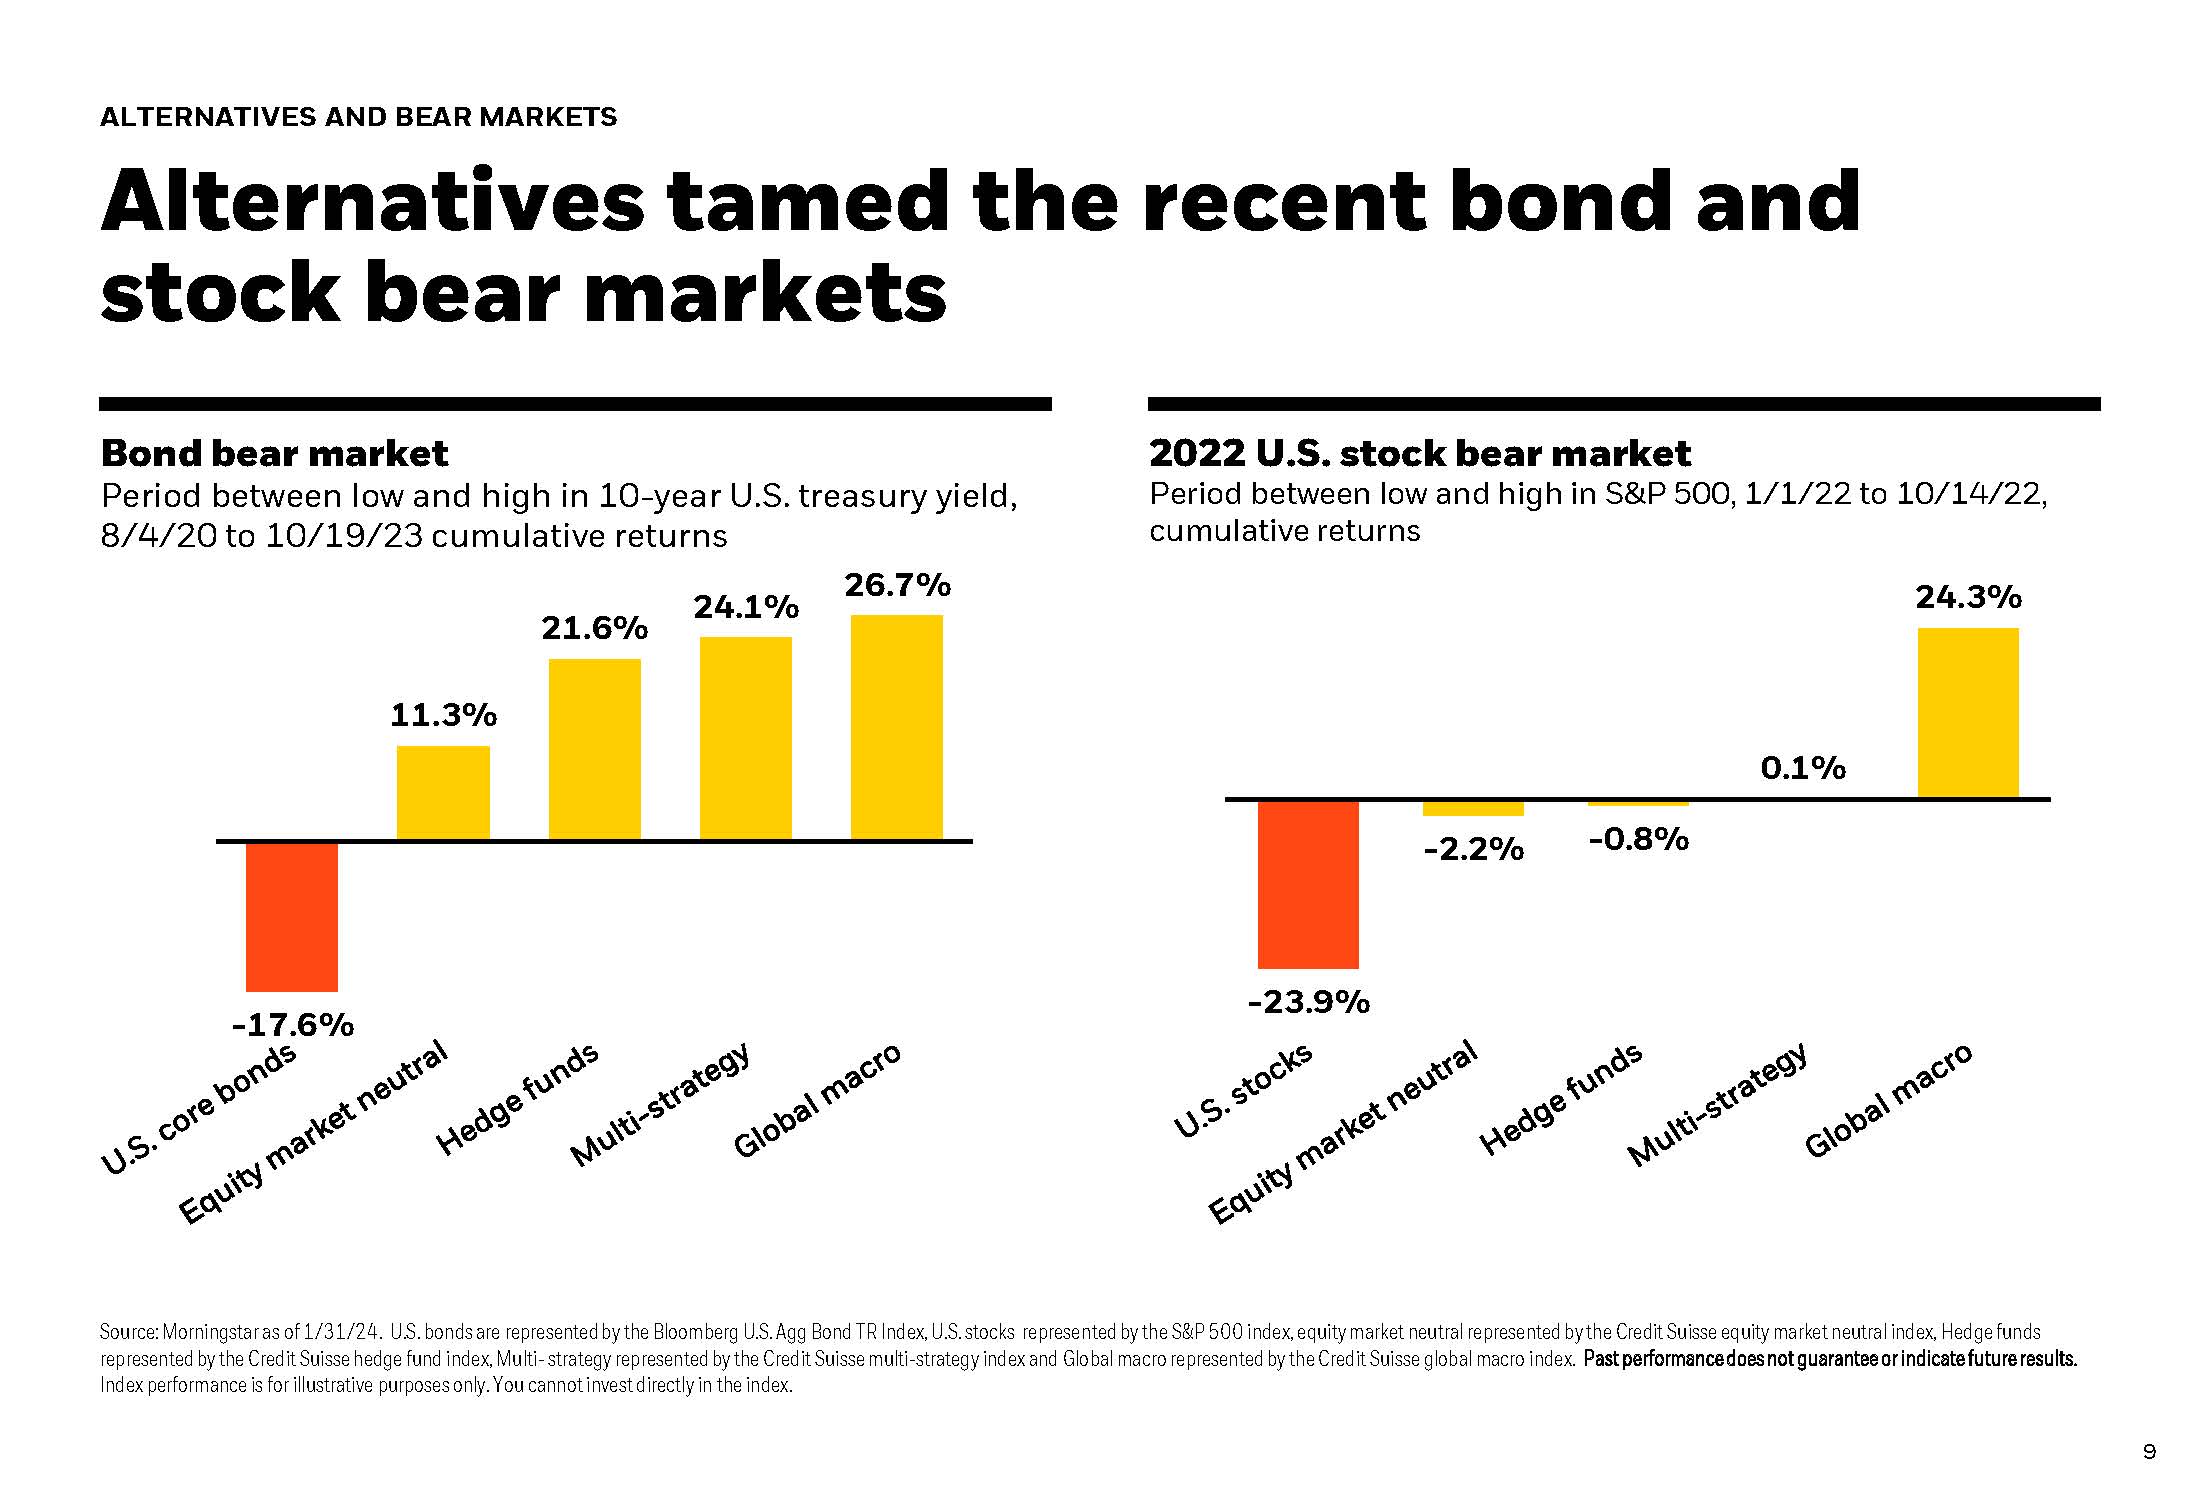
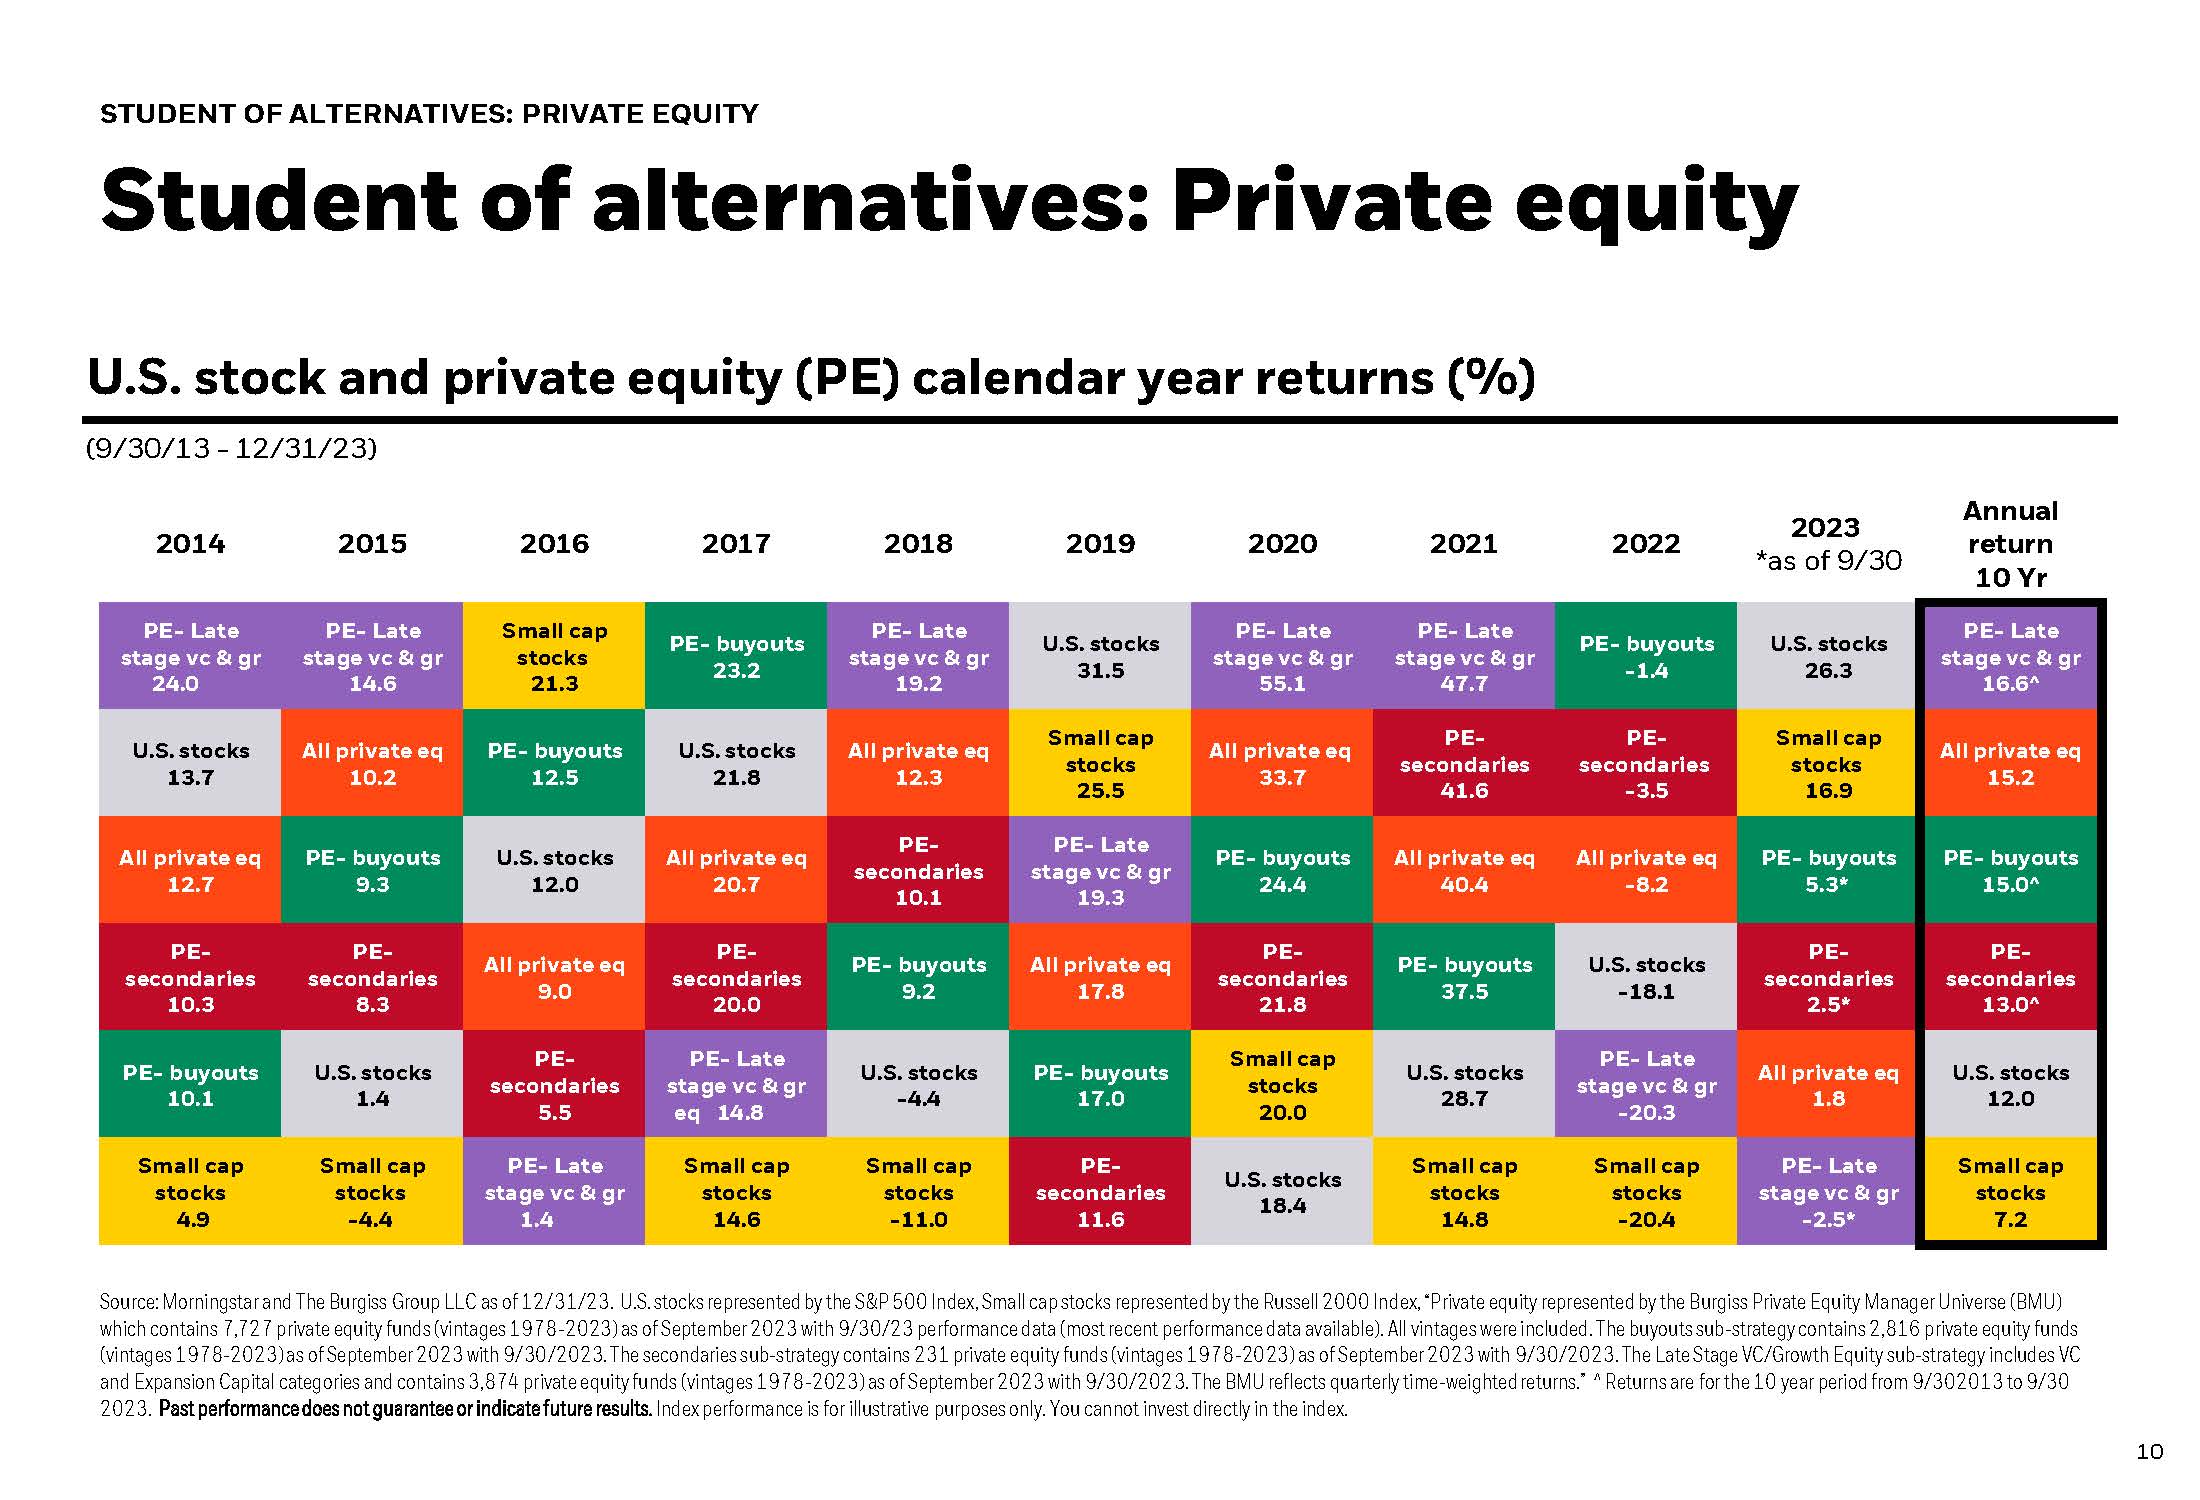
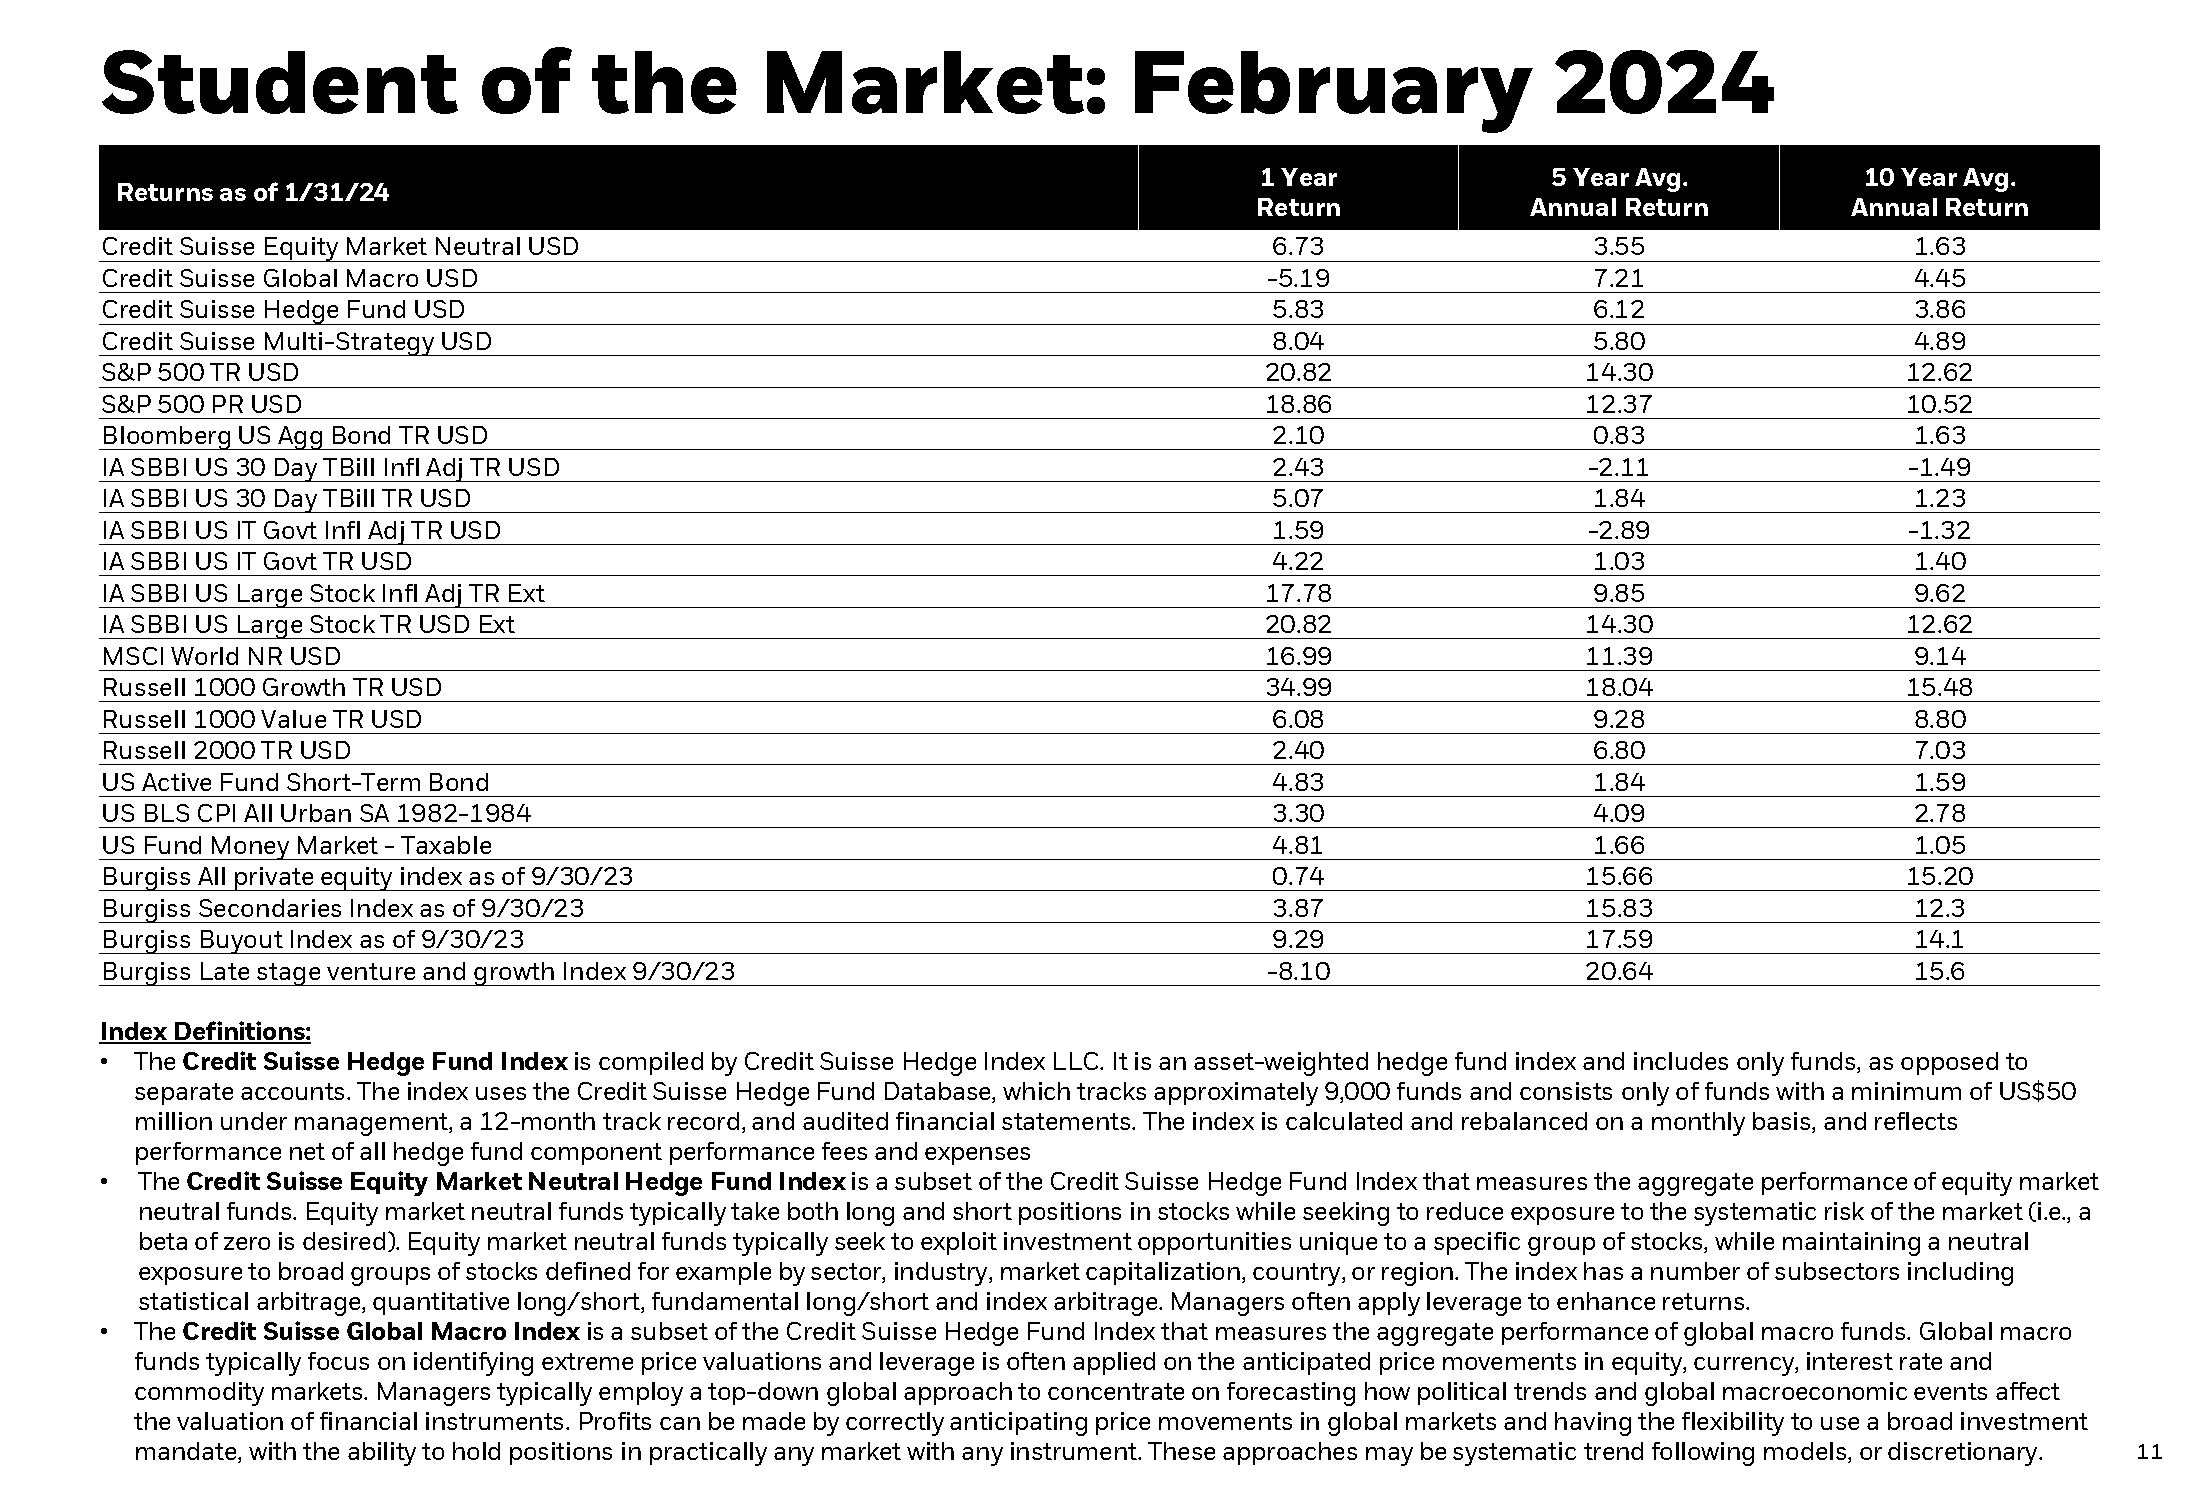
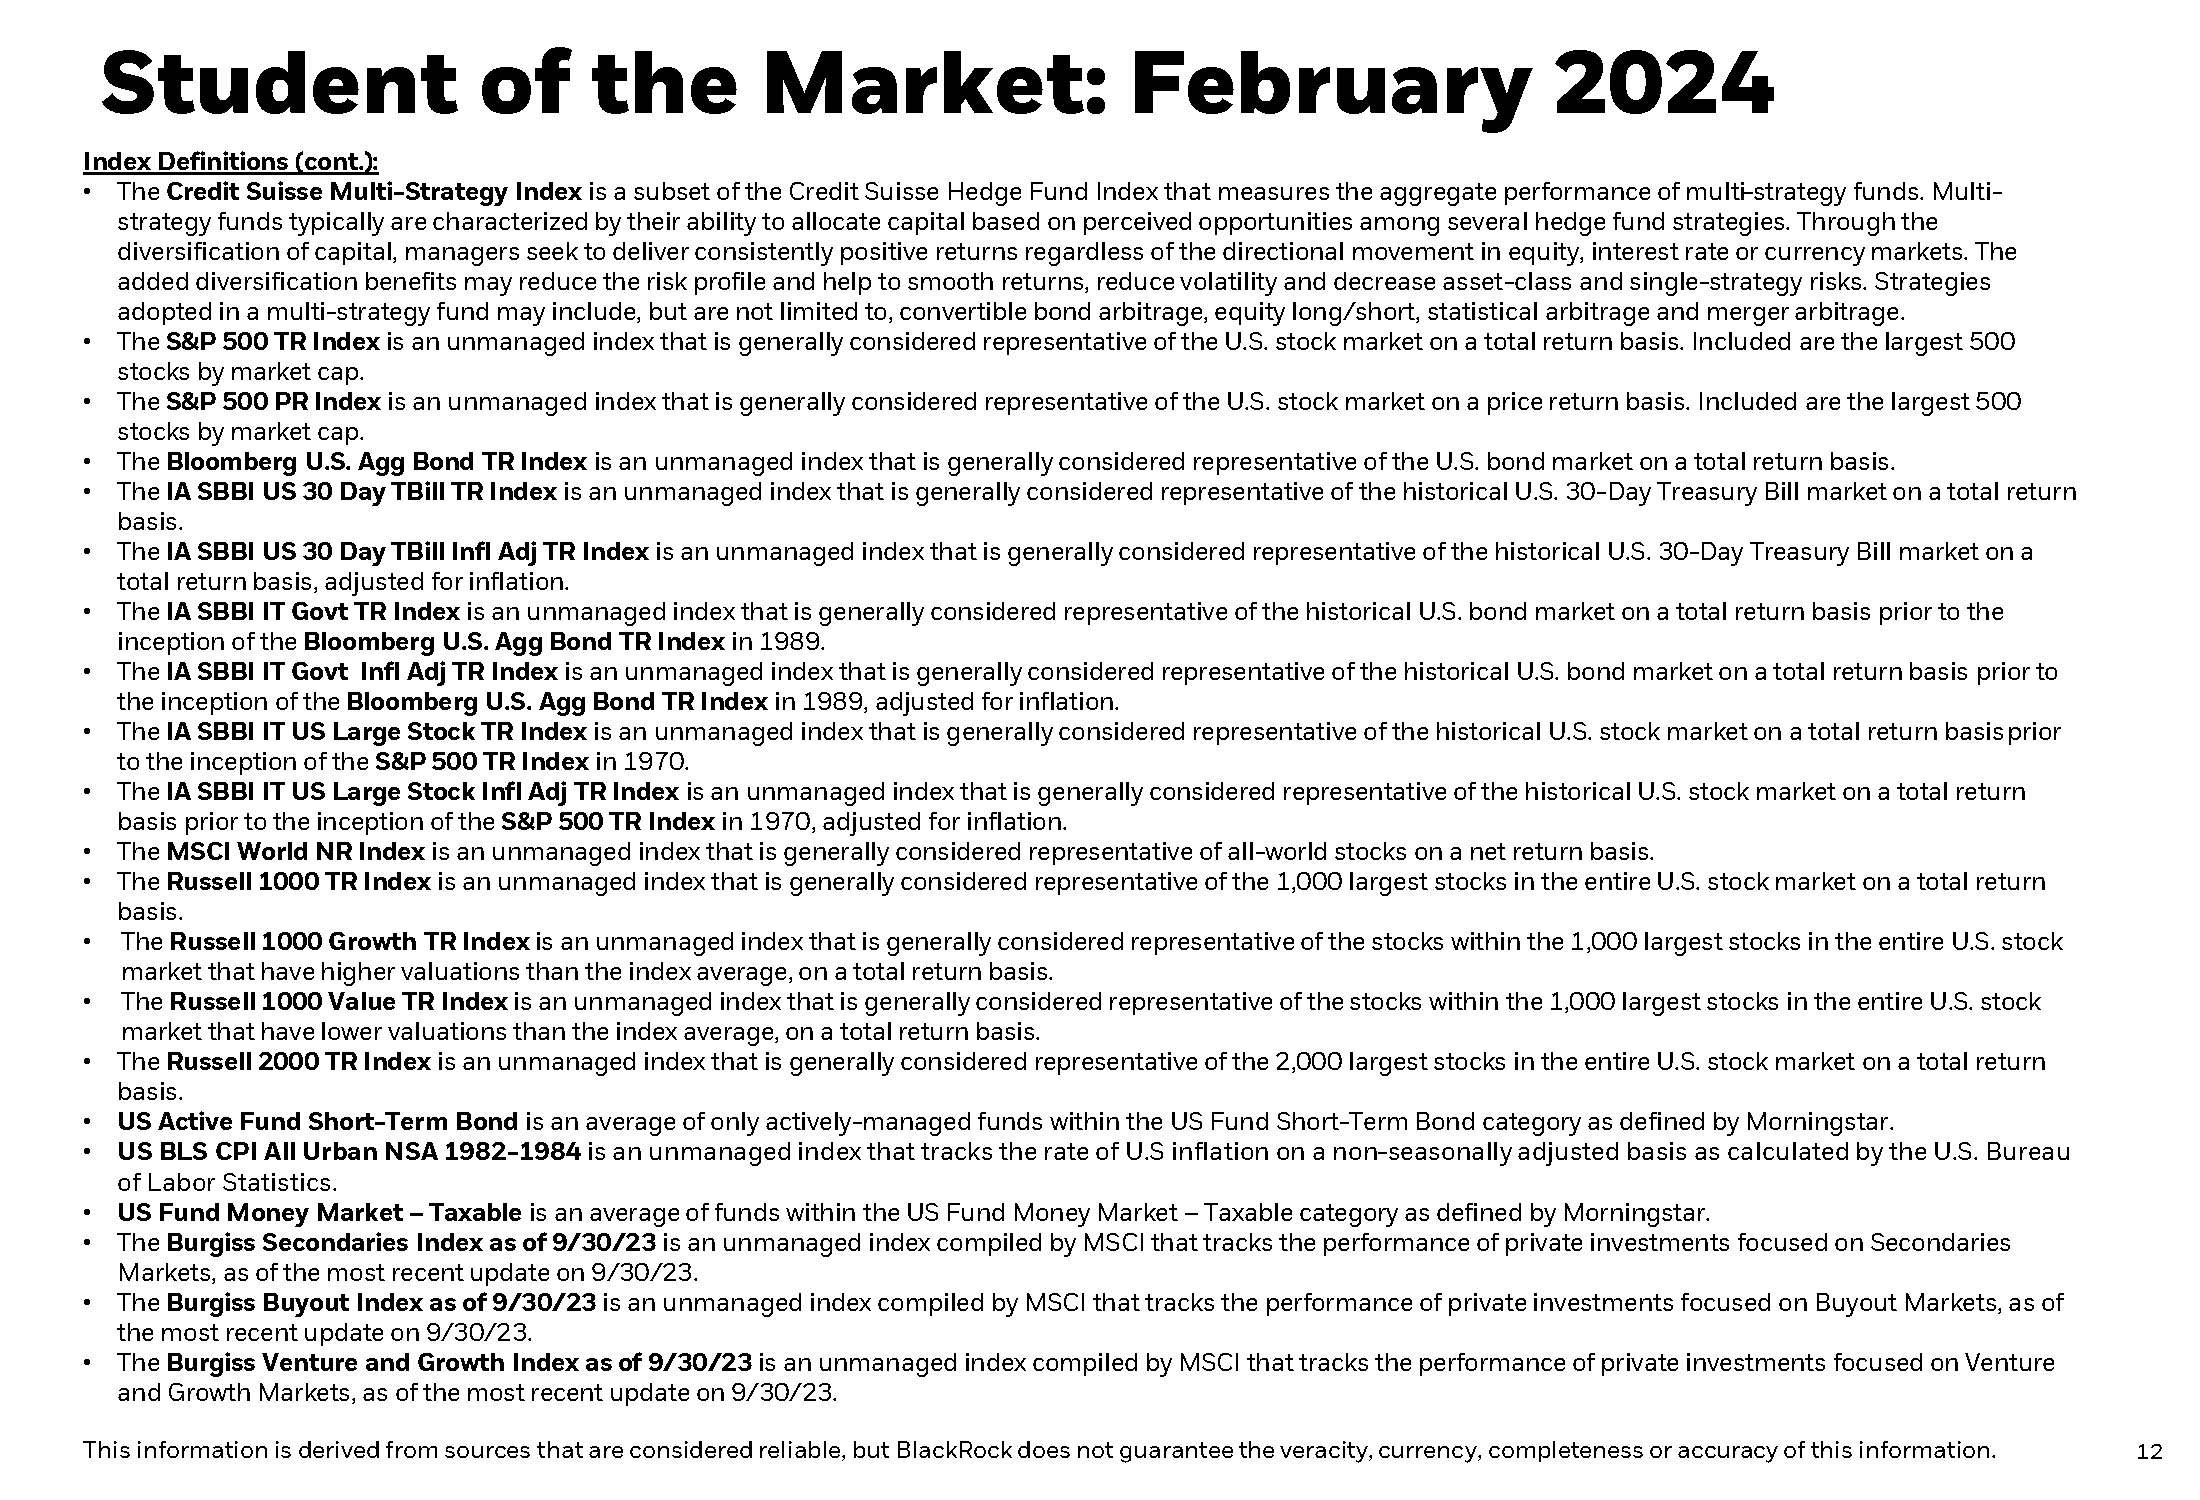
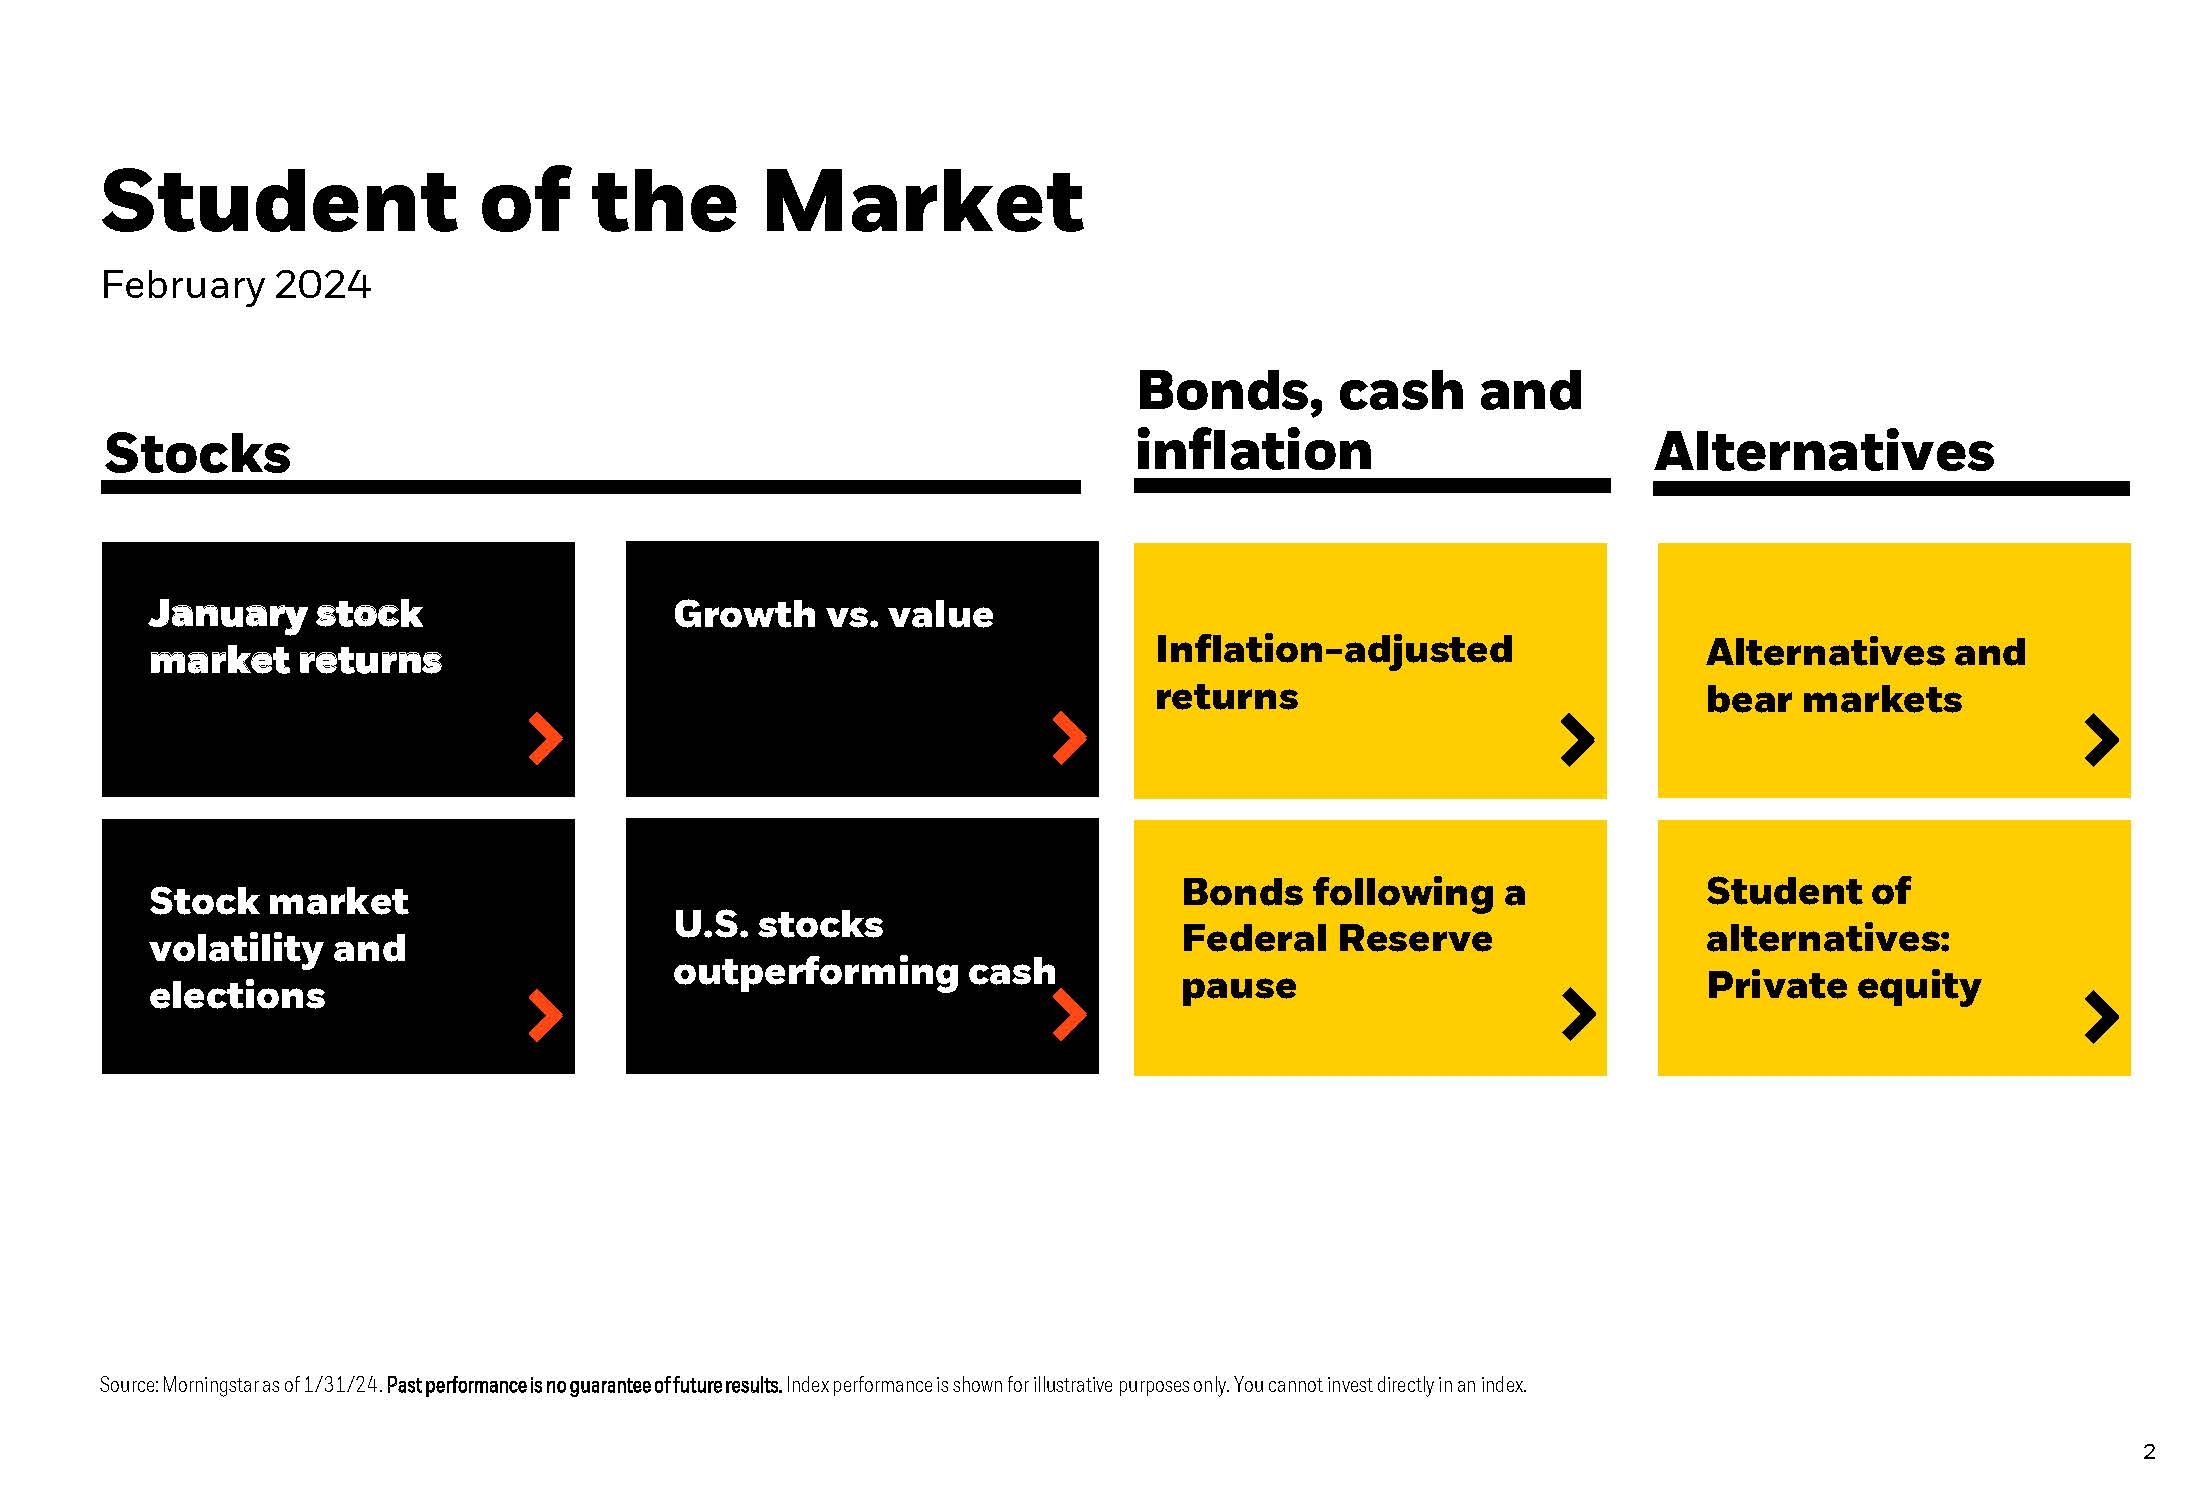
Can something be learned from studying the past? Historical data showing that stock market volatility during election years has been generally subdued unless there is a large recession, such as in ’32, ’08 and ’20. A brief look at the large swings between growth and value, stocks vs cash, data gives a glimpse of the average stock market return following January since 1926, and how the bear market was recently tamed.

February 27, 2024
Stock Volatility by Presidential Election Year
Important Disclosure: Content on our website and in our newsletters is for informational purposes only. The information provided may (or may not) directly apply to your situation. We recommend that readers work directly with a professional advisor when making decisions in the context of their specific situation.

Other content you may like

  • Mid-Quarter Roundtable Highlights

    Podcast Highlight - More Adjustments to the Federal Fund Reserve Rate

    November 30, 2022
    The team offers their predictions on where the Fed Funds may be going in the New Year, with a recap of what has happened this past year, especially in relation to bond performance.
    Read this Article
  • Finally, A 2022 Wrap-Up

    Finally, A 2022 Wrap-Up

    January 4, 2023
    It’s been a rough year and there’s no way to sugarcoat it. Strong Valley team members Jason and Kyle give a quick look at what happened overall, who it hurt most, and what could happen next by looking at historical examples. They also discuss the stats and how our feelings may not paint a true picture. Here are some of the topics we cover in this brief 2022 update: • 2023 performance recap • Federal Rate Hikes • Inflation
    Read this Article
  • Market Performance and a Recession Indicator

    Market Performance and a Recession Indicator

    December 1, 2022
    U.S. stocks historically average 10% per year but rarely do they finish a year at that level. See the difference between the average annual return and what happened to stocks YTD in 2022 by looking at the range of returns for stocks by the full calendar year. A quick glance at the most reliable recession indicator and how alternative asset classes do better when the return on “cash” is higher. Plus stats on market performance.
    Read this Article
  • A person working on tax forms, in front of a computer and using a calculator.

    Tax Season Has Begun

    March 6, 2026
    As tax season kicks off in 2026, Americans may be able to take advantage of the temporary tax changes recently implemented. This includes higher standard deductions, new senior deductions, as well as changes for tips, overtime and qualified car loans. Take a look!
    Read this Article
  • The link you have selected is located on another server. The linked site contains information that has been created, published, maintained, or otherwise posted by institutions or organizations independent of this organization. We do not endorse, approve, certify, or control any linked websites, their sponsors, or any of their policies, activities, products, or services. We do not assume responsibility for the accuracy, completeness, or timeliness of the information contained therein. Visitors to any linked websites should not use or rely on the information contained therein until they have consulted with an independent financial professional. Please click “Continue to Link” to leave this website and proceed to the selected site.
    phone-handset