Article

Podcast Highlight - Recap + Indexes Explained

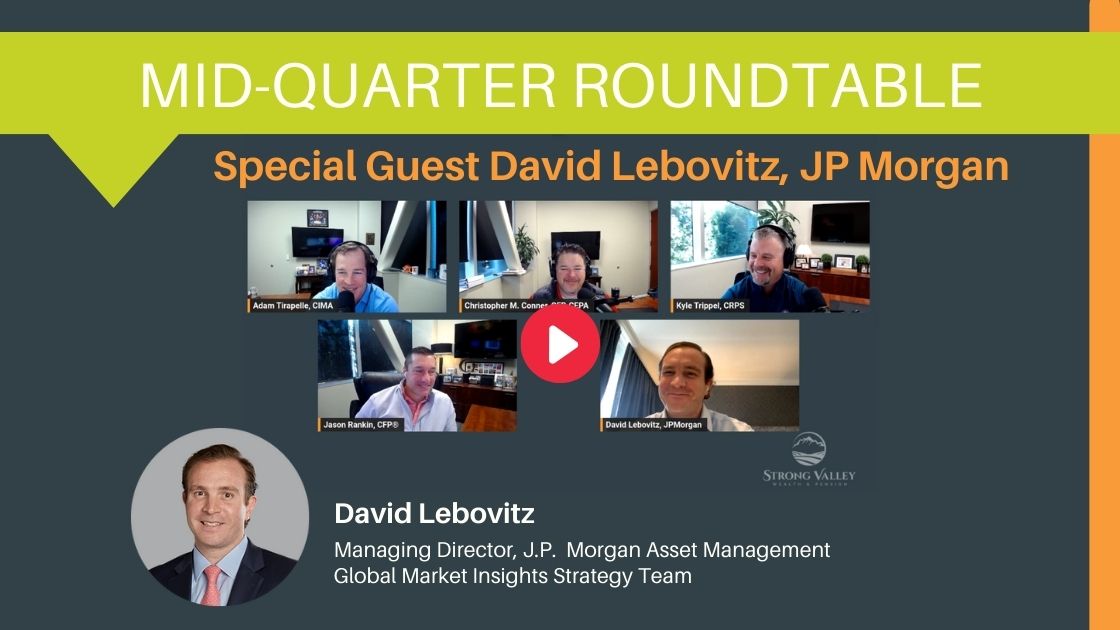
The Strong Valley Team discusses a recap of mid-November to February, along with information about what makes an Index like DOW or S&P and basics on how are they managed.

Enjoy this highlight clip from the Strong Valley Mid-Quarter Roundtable. If you have questions for the Strong Valley team, submit your question at strongvalley.com/contact.

March 14, 2024
Important Disclosure: Content on our website and in our newsletters is for informational purposes only. The information provided may (or may not) directly apply to your situation. We recommend that readers work directly with a professional advisor when making decisions in the context of their specific situation.

Other content you may like

  • A little boy holding out a red, plastic heart

    Planning to Give? Giving Tuesday is December 2nd!

    November 13, 2025
    Have you considered the benefits of giving back? This article explores the benefits and practical steps for engaging with this global movement. Discover ways you can contribute and be involved in Giving Tuesday! Find out everything you need to know to make a difference!
    Read this Article
  • Utilizing New Technology for Our Seniors

    November 12, 2024
    New tech brings convenience, increased autonomy and investment opportunities across all age groups, and seniors are no exception. From simple gadgets to comprehensive health platforms, seniors now have access to tools that were unimaginable just a decade ago, as well as presenting opportunities for healthcare investors.
    Read this Article
  • Risk Tolerance: What's Right for You?

    March 31, 2025
    When it comes to investing, each person has a different tolerance for risk. A friend or coworker may not give a second thought to an investment that leaves you feeling uneasy. Do you know what factors to consider when coming up with the level of risk that best suits you?
    Read this Article
  • Market Performance and a Recession Indicator

    Market Performance and a Recession Indicator

    December 1, 2022
    U.S. stocks historically average 10% per year but rarely do they finish a year at that level. See the difference between the average annual return and what happened to stocks YTD in 2022 by looking at the range of returns for stocks by the full calendar year. A quick glance at the most reliable recession indicator and how alternative asset classes do better when the return on “cash” is higher. Plus stats on market performance.
    Read this Article
  • The link you have selected is located on another server. The linked site contains information that has been created, published, maintained, or otherwise posted by institutions or organizations independent of this organization. We do not endorse, approve, certify, or control any linked websites, their sponsors, or any of their policies, activities, products, or services. We do not assume responsibility for the accuracy, completeness, or timeliness of the information contained therein. Visitors to any linked websites should not use or rely on the information contained therein until they have consulted with an independent financial professional. Please click “Continue to Link” to leave this website and proceed to the selected site.
    phone-handset