Article

Stock Performance in Election Years

Stock Performance in Election Years

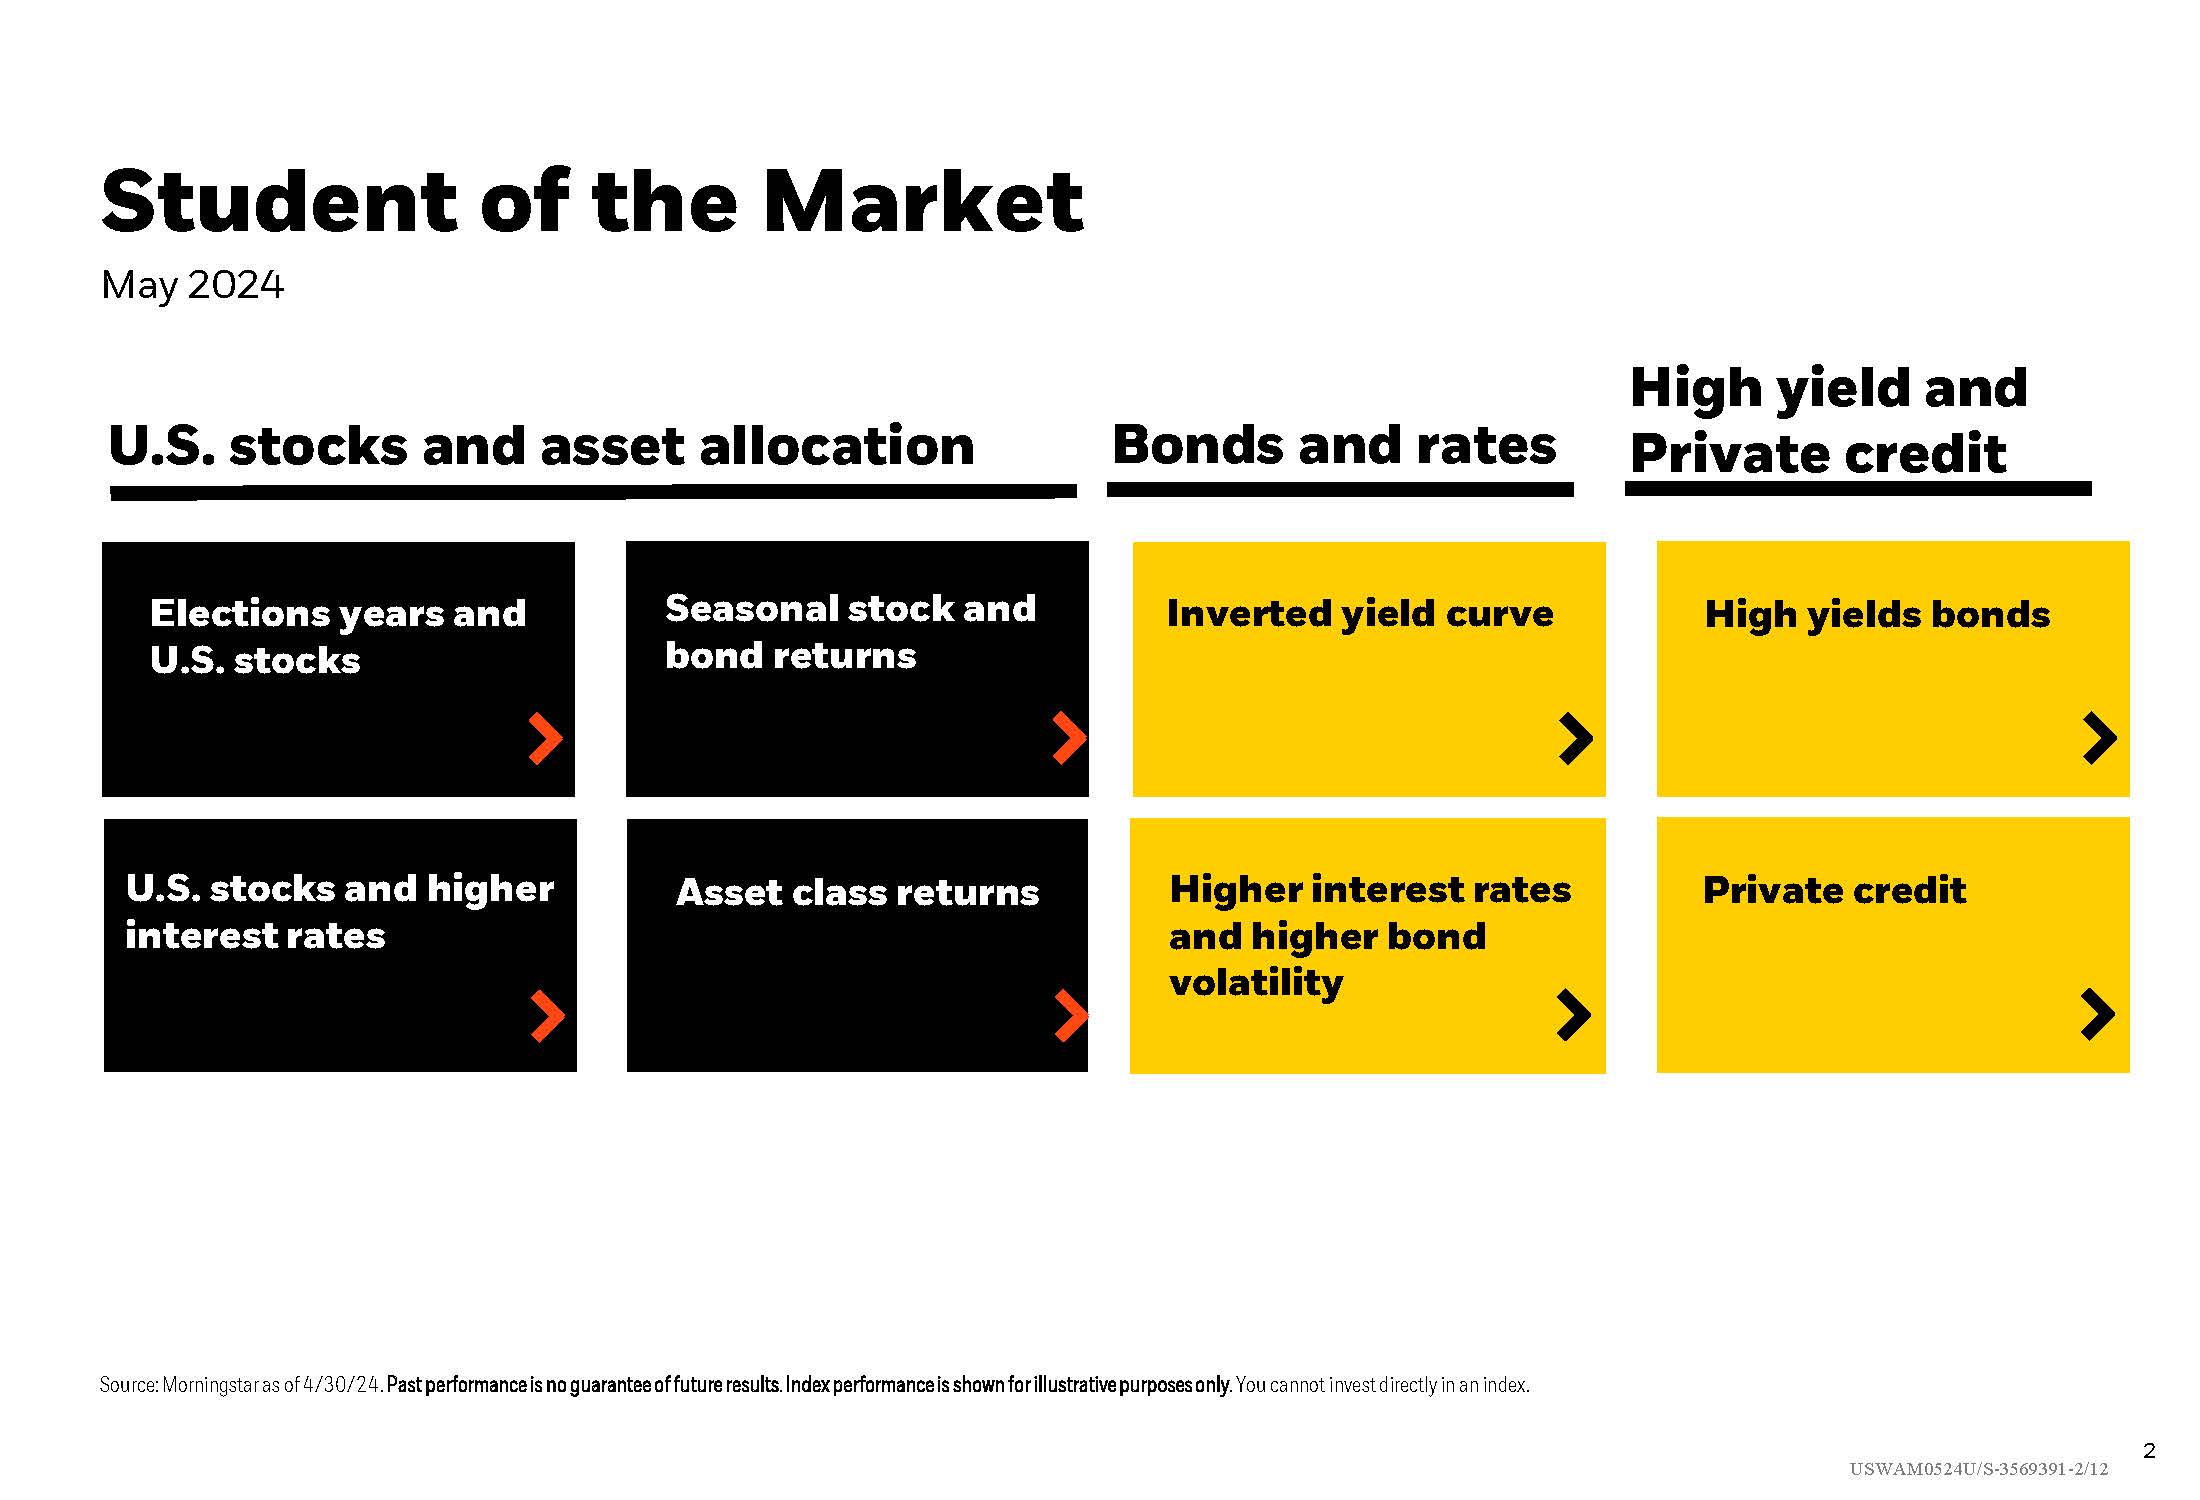
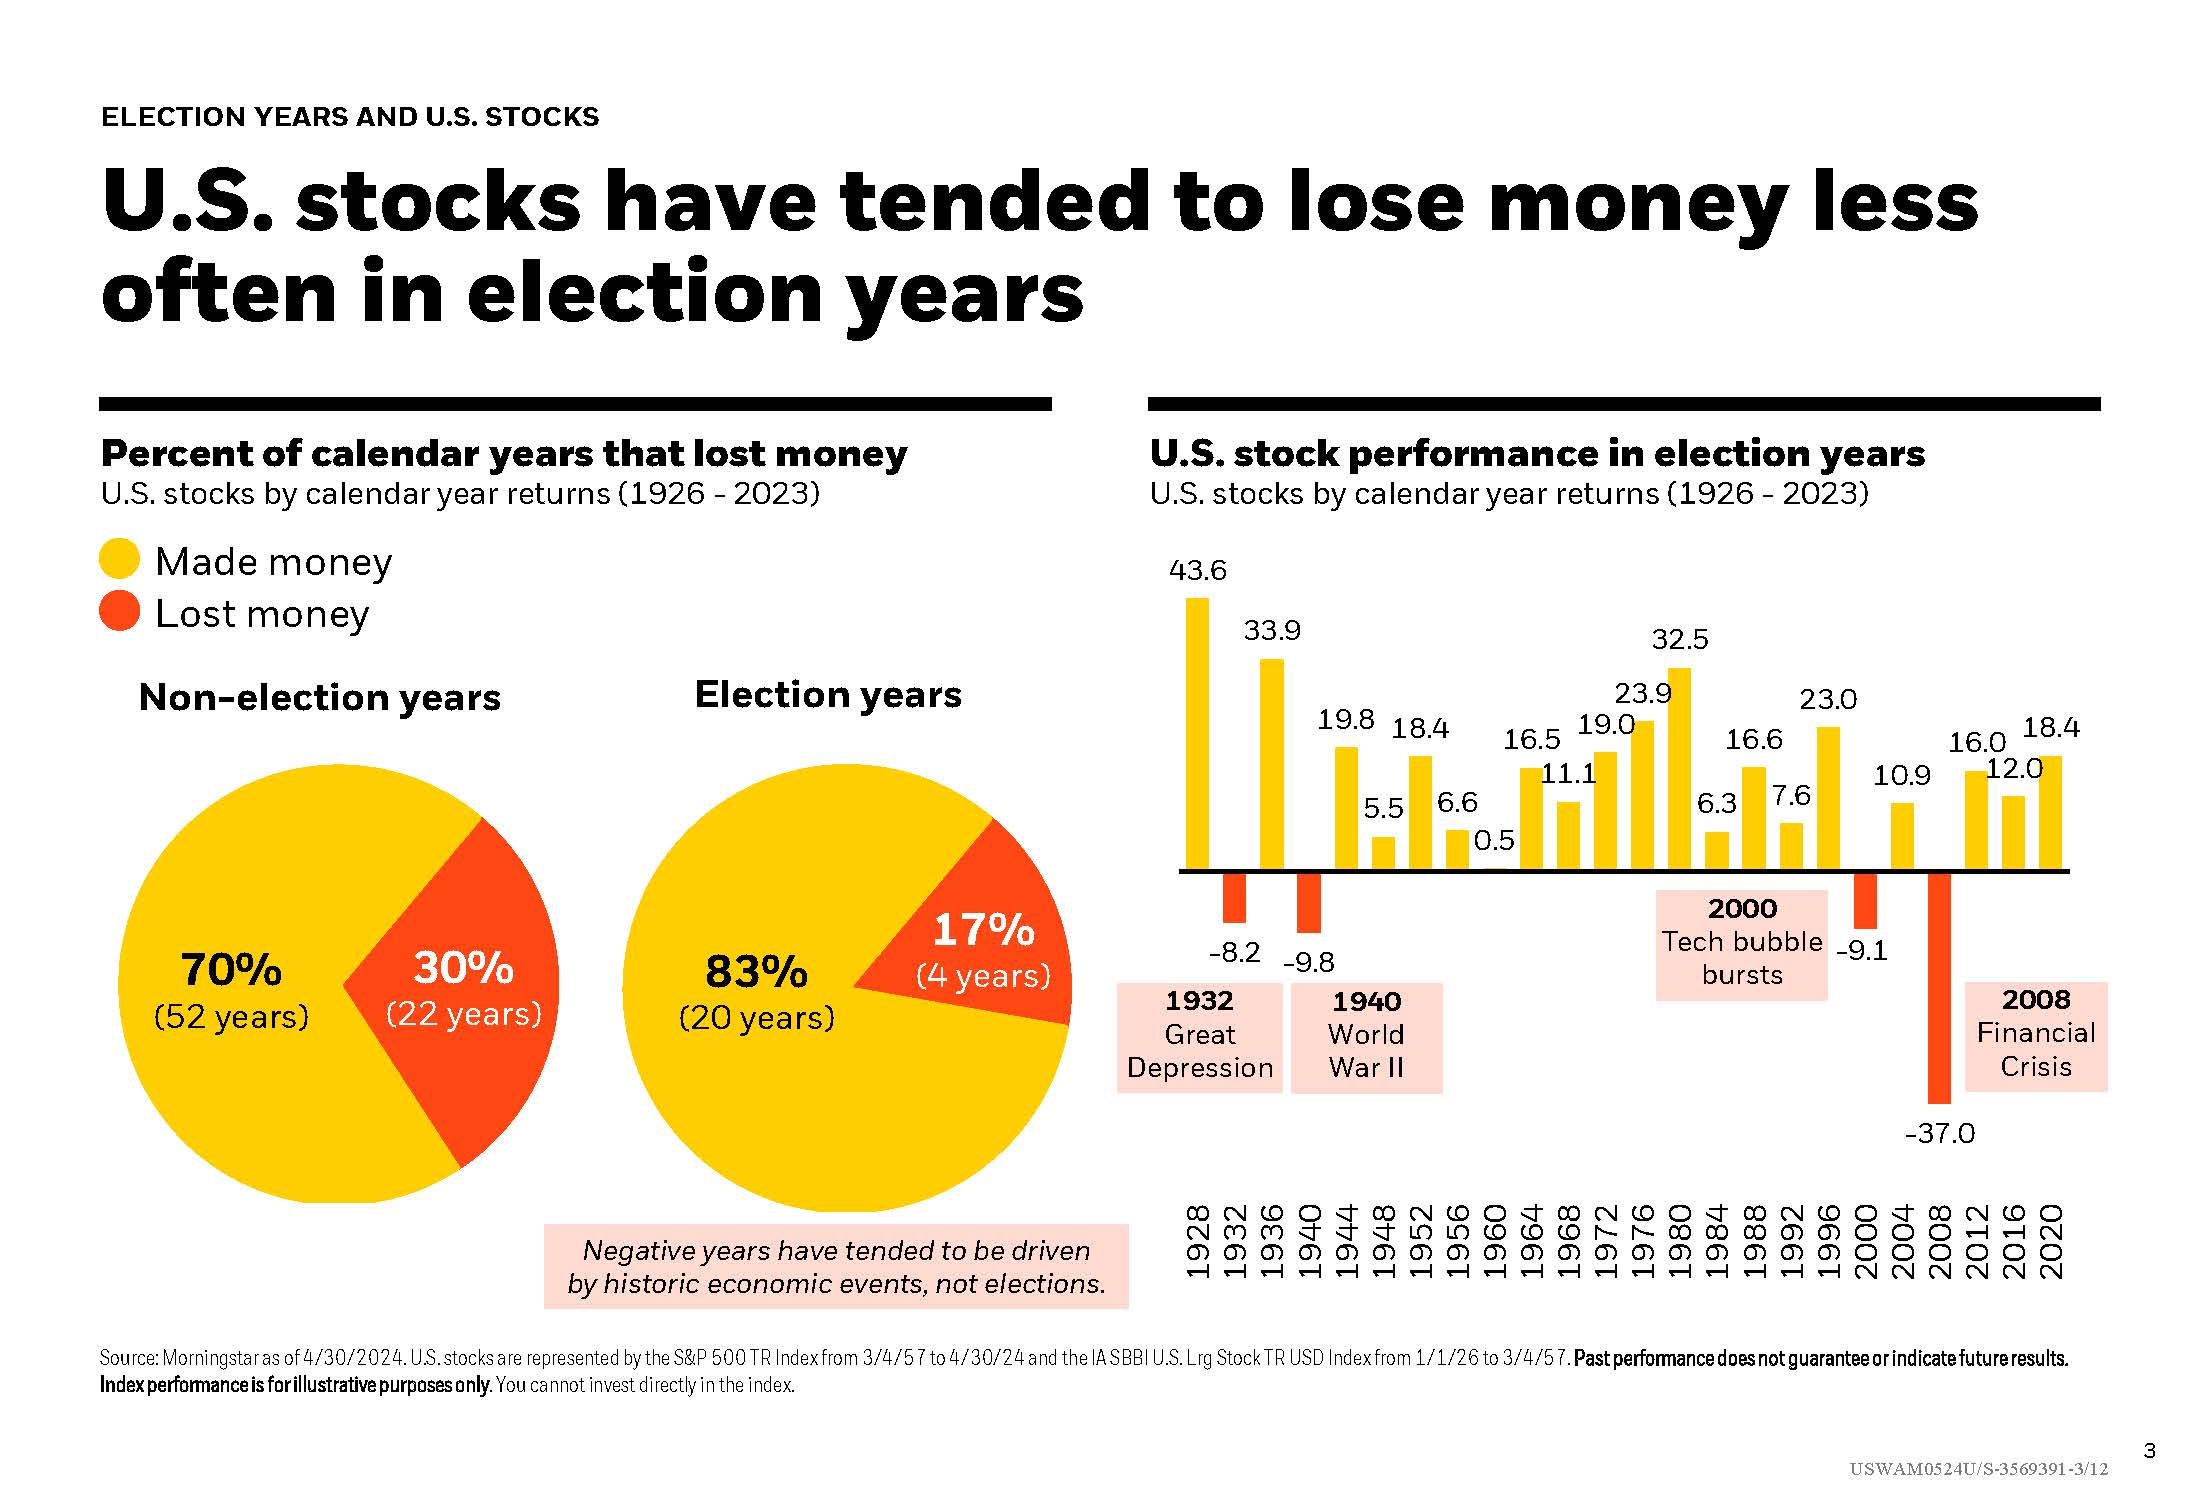
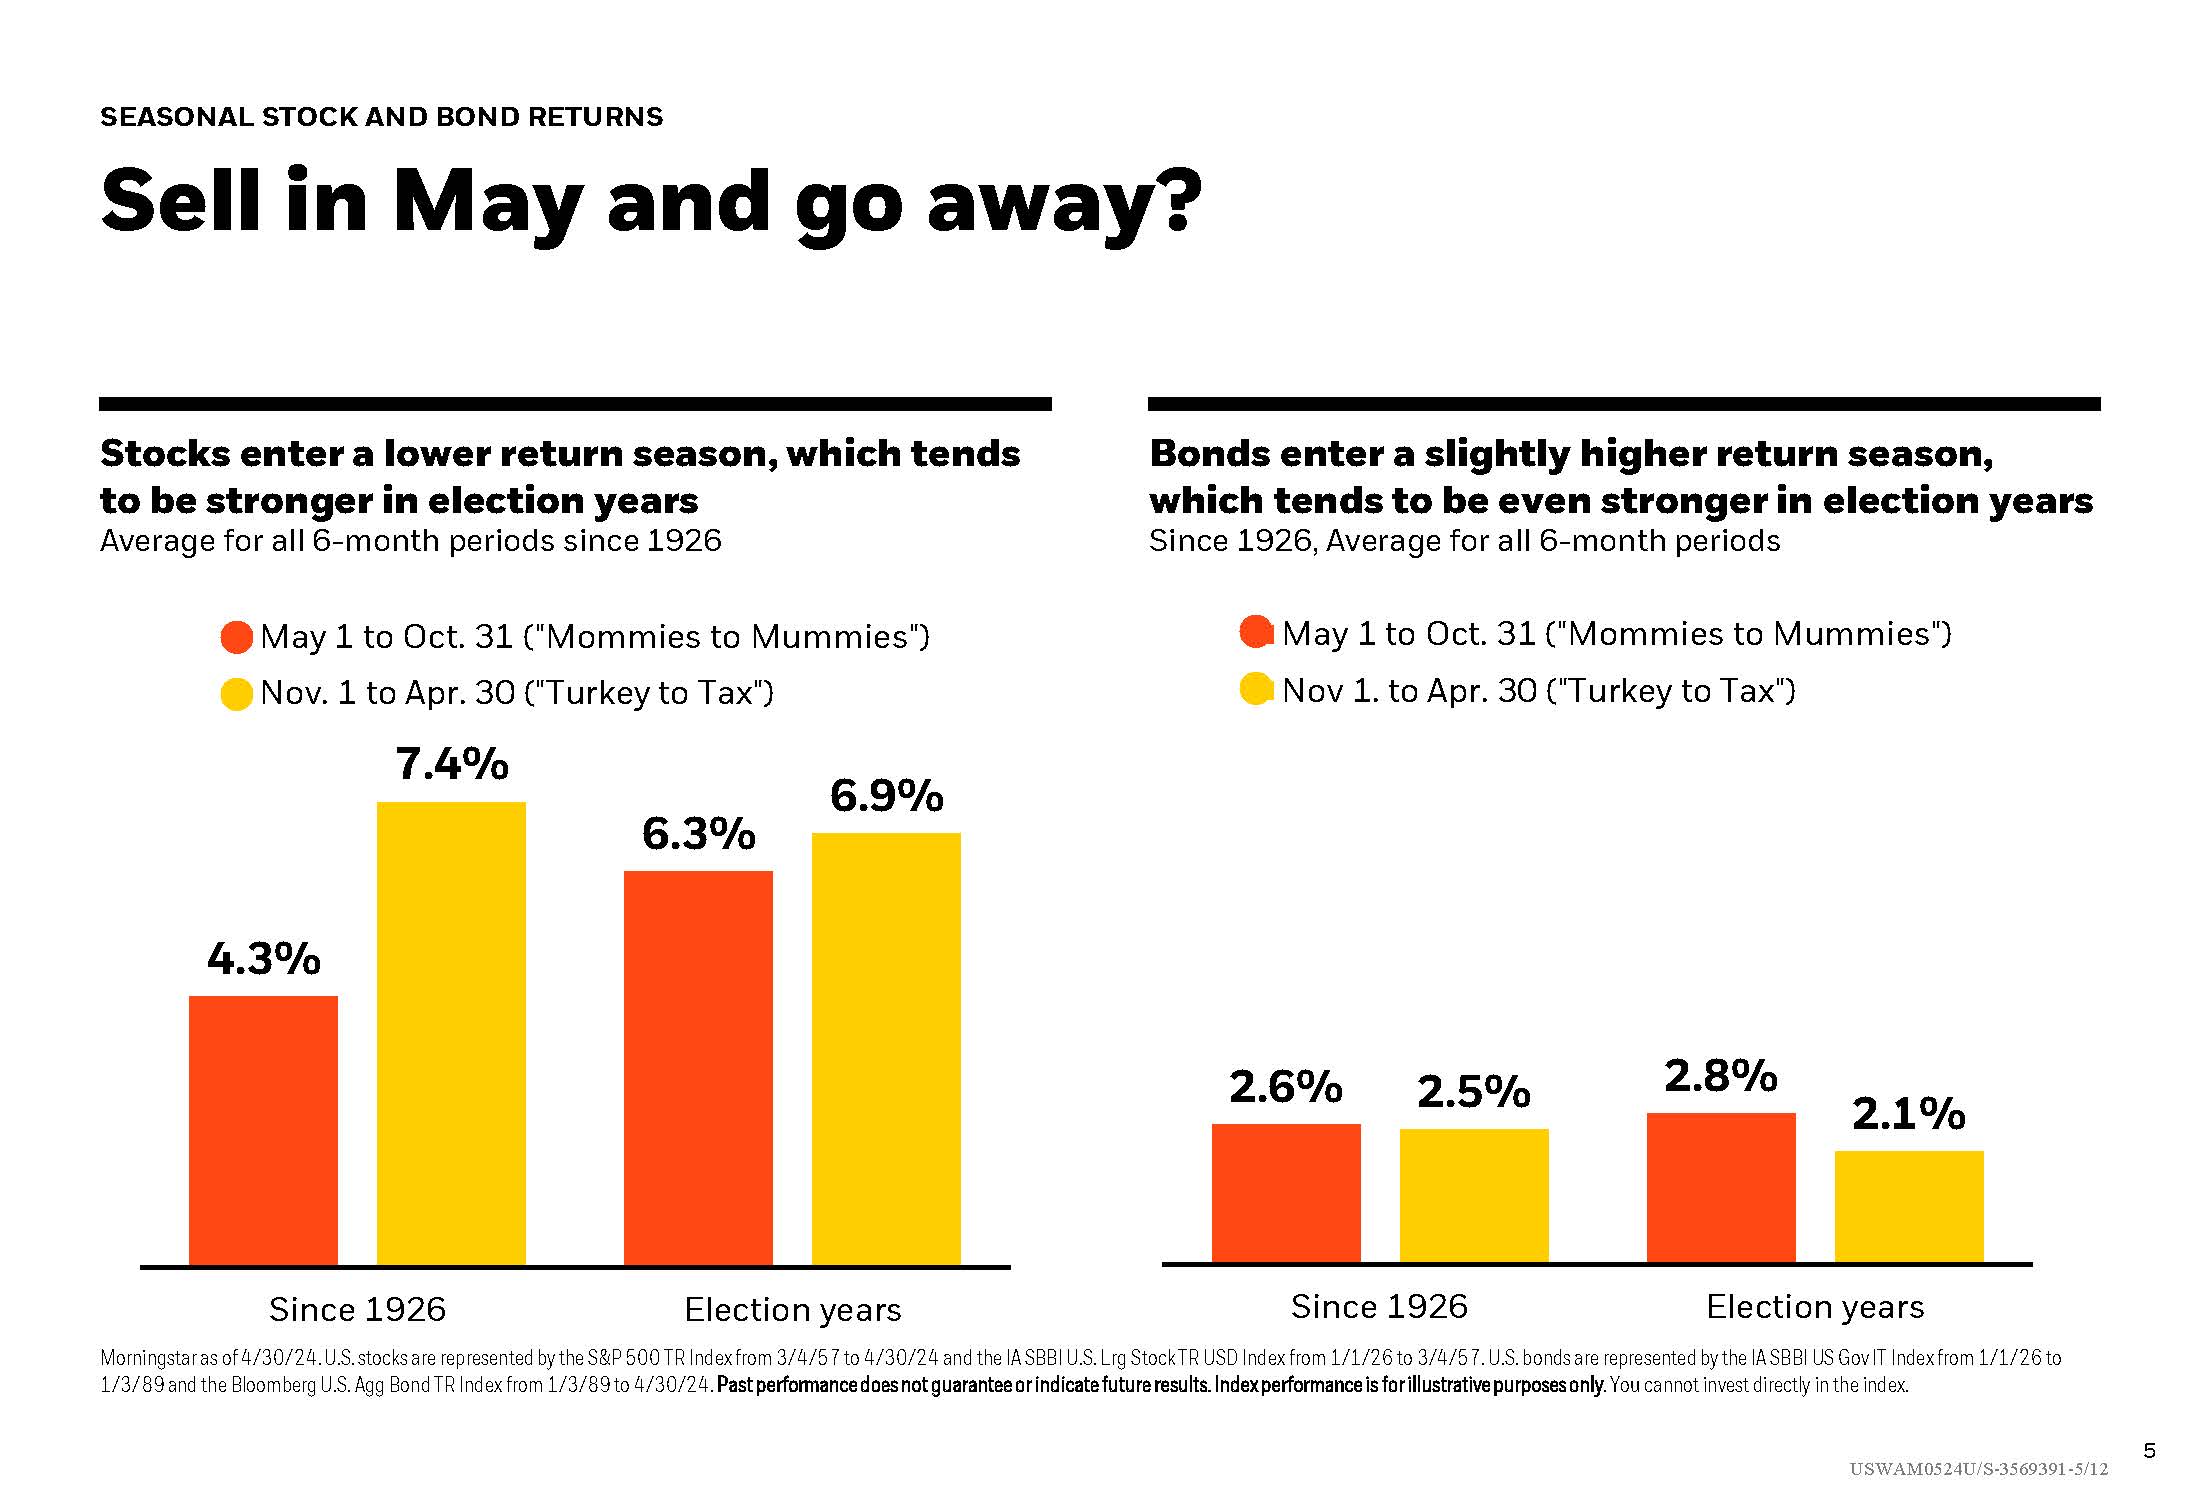
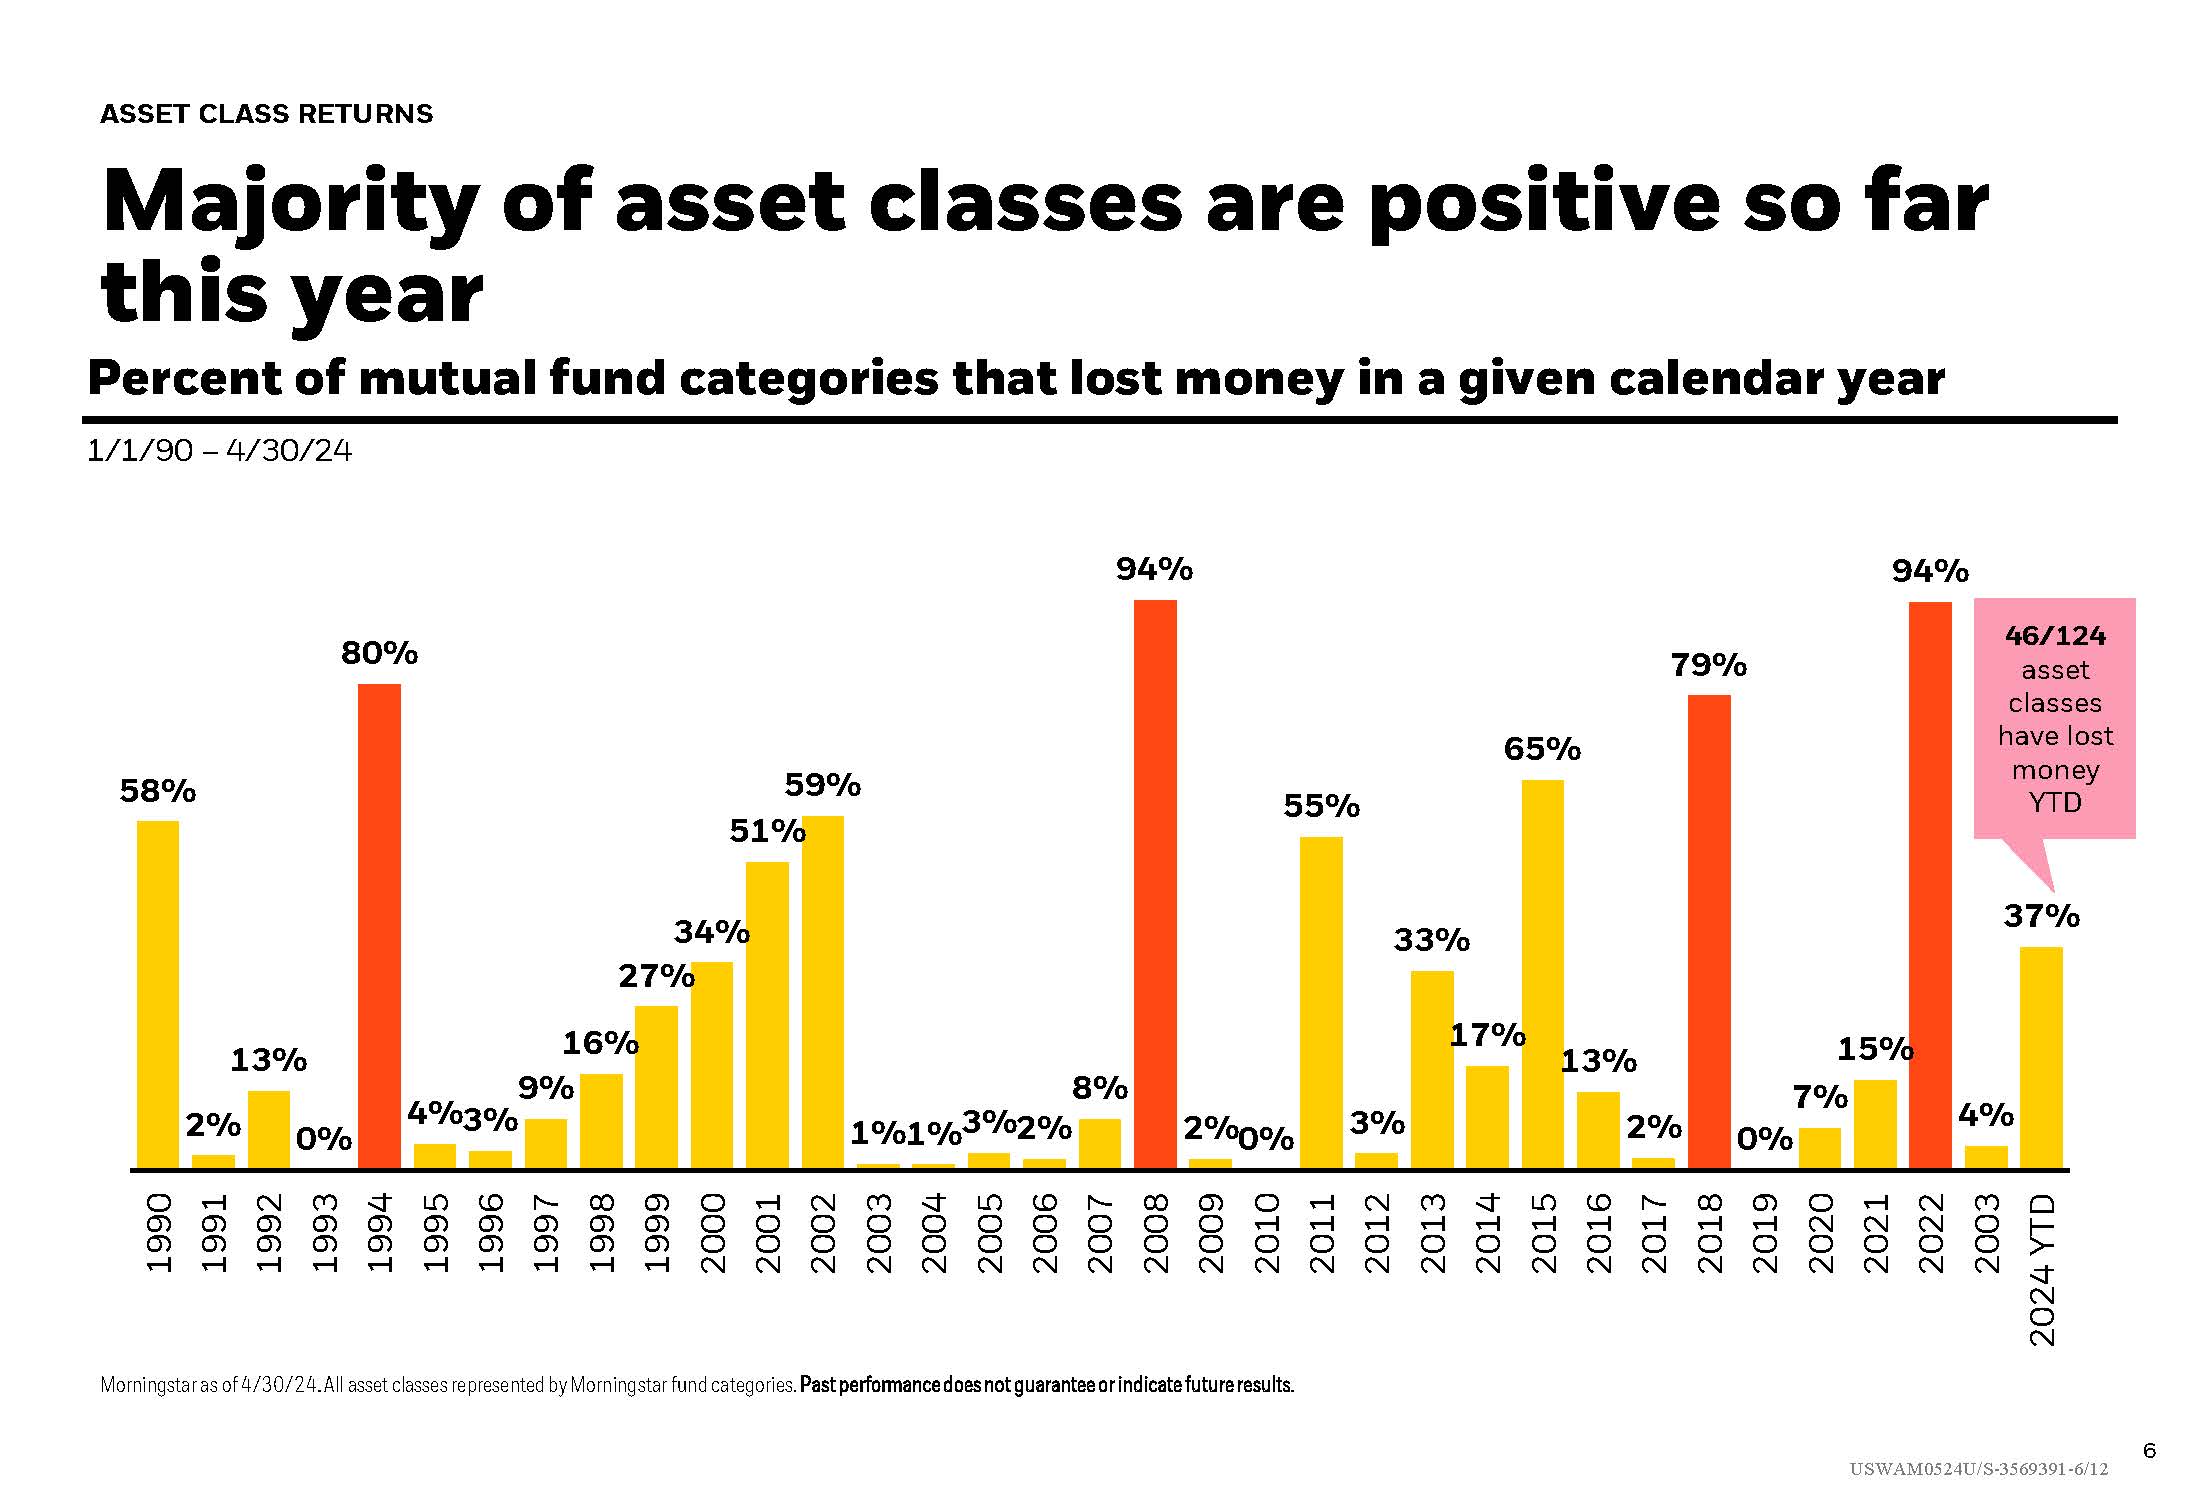
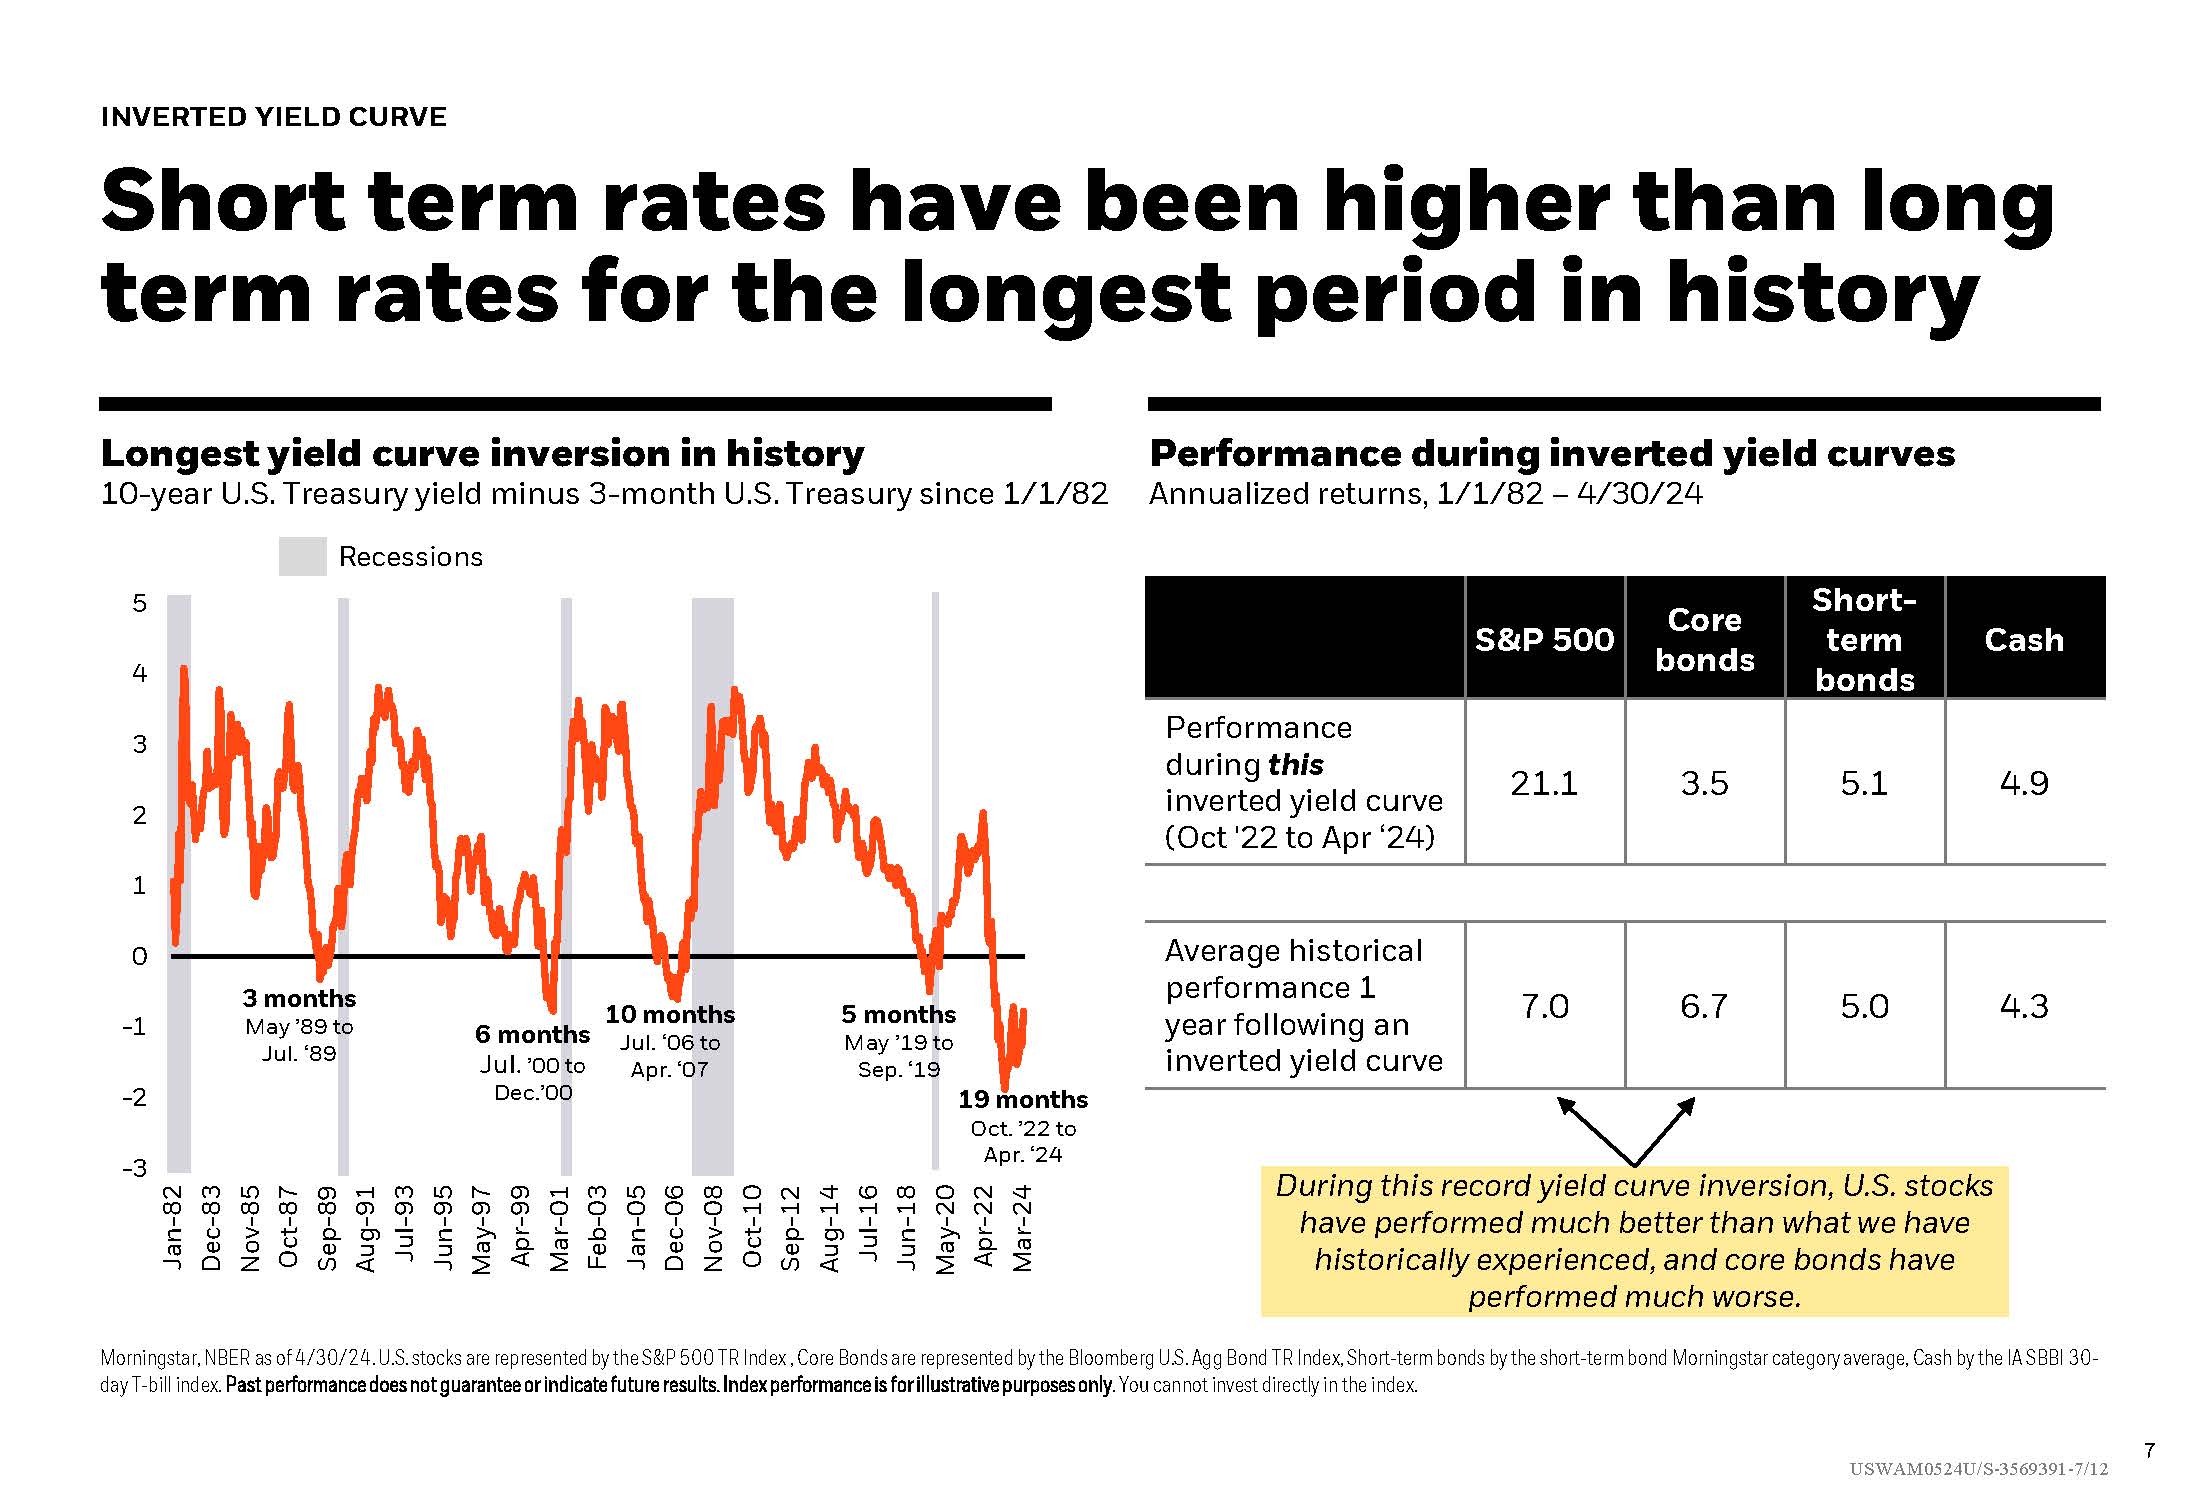
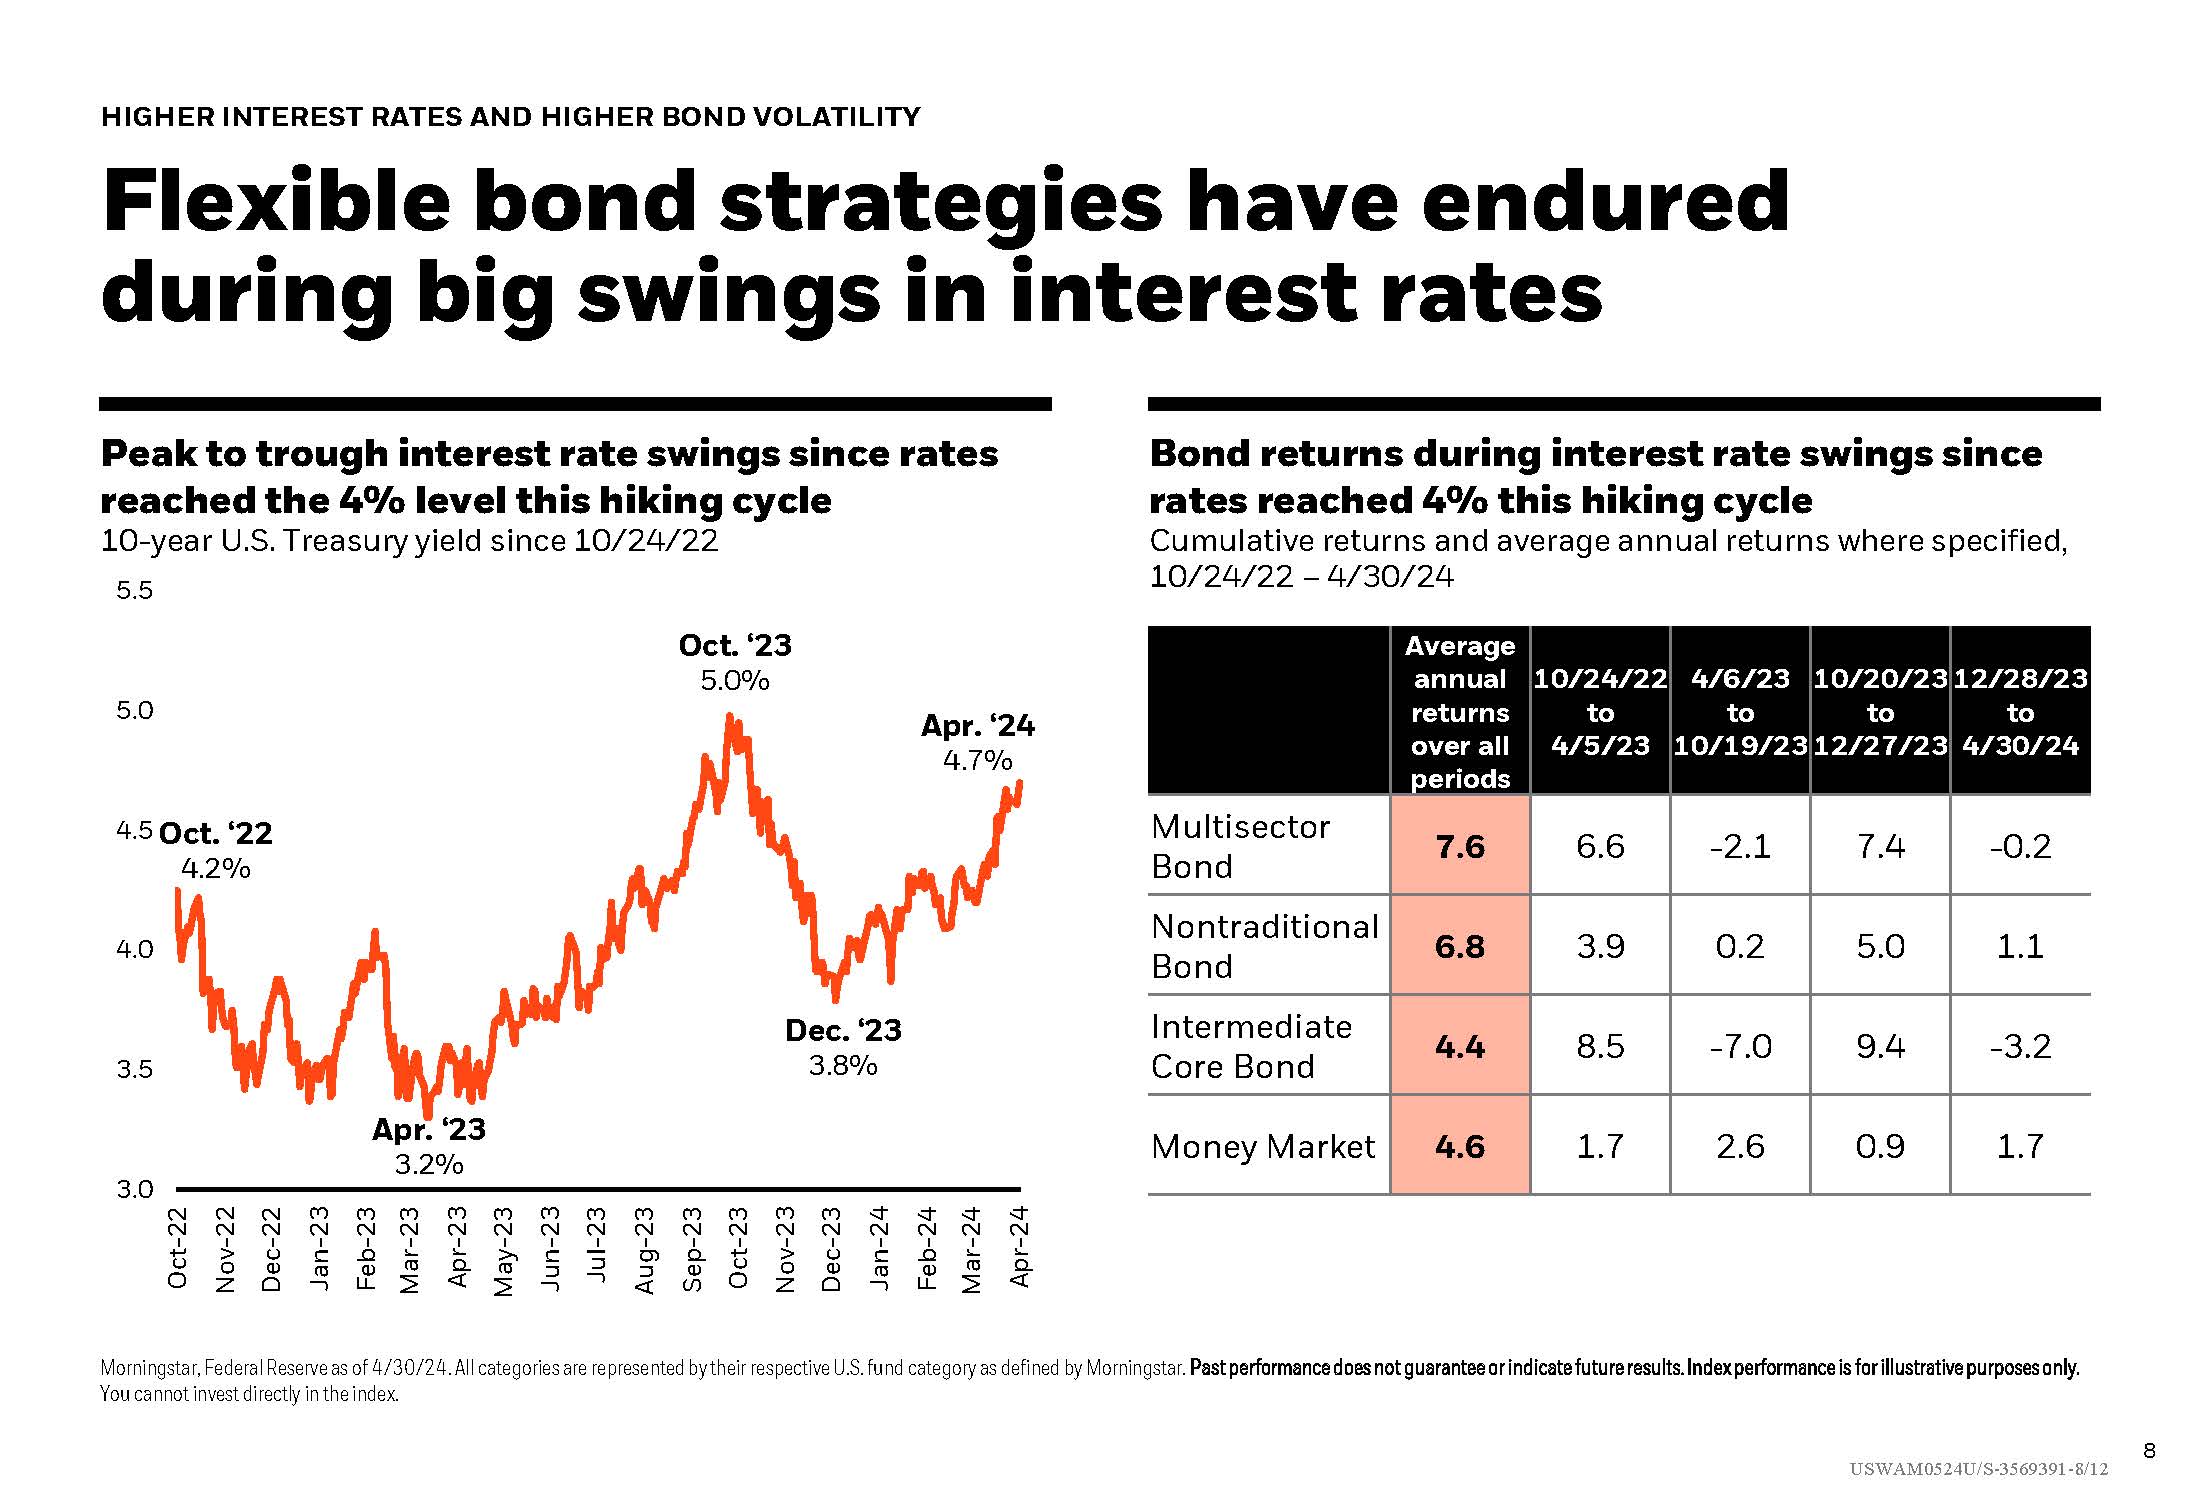
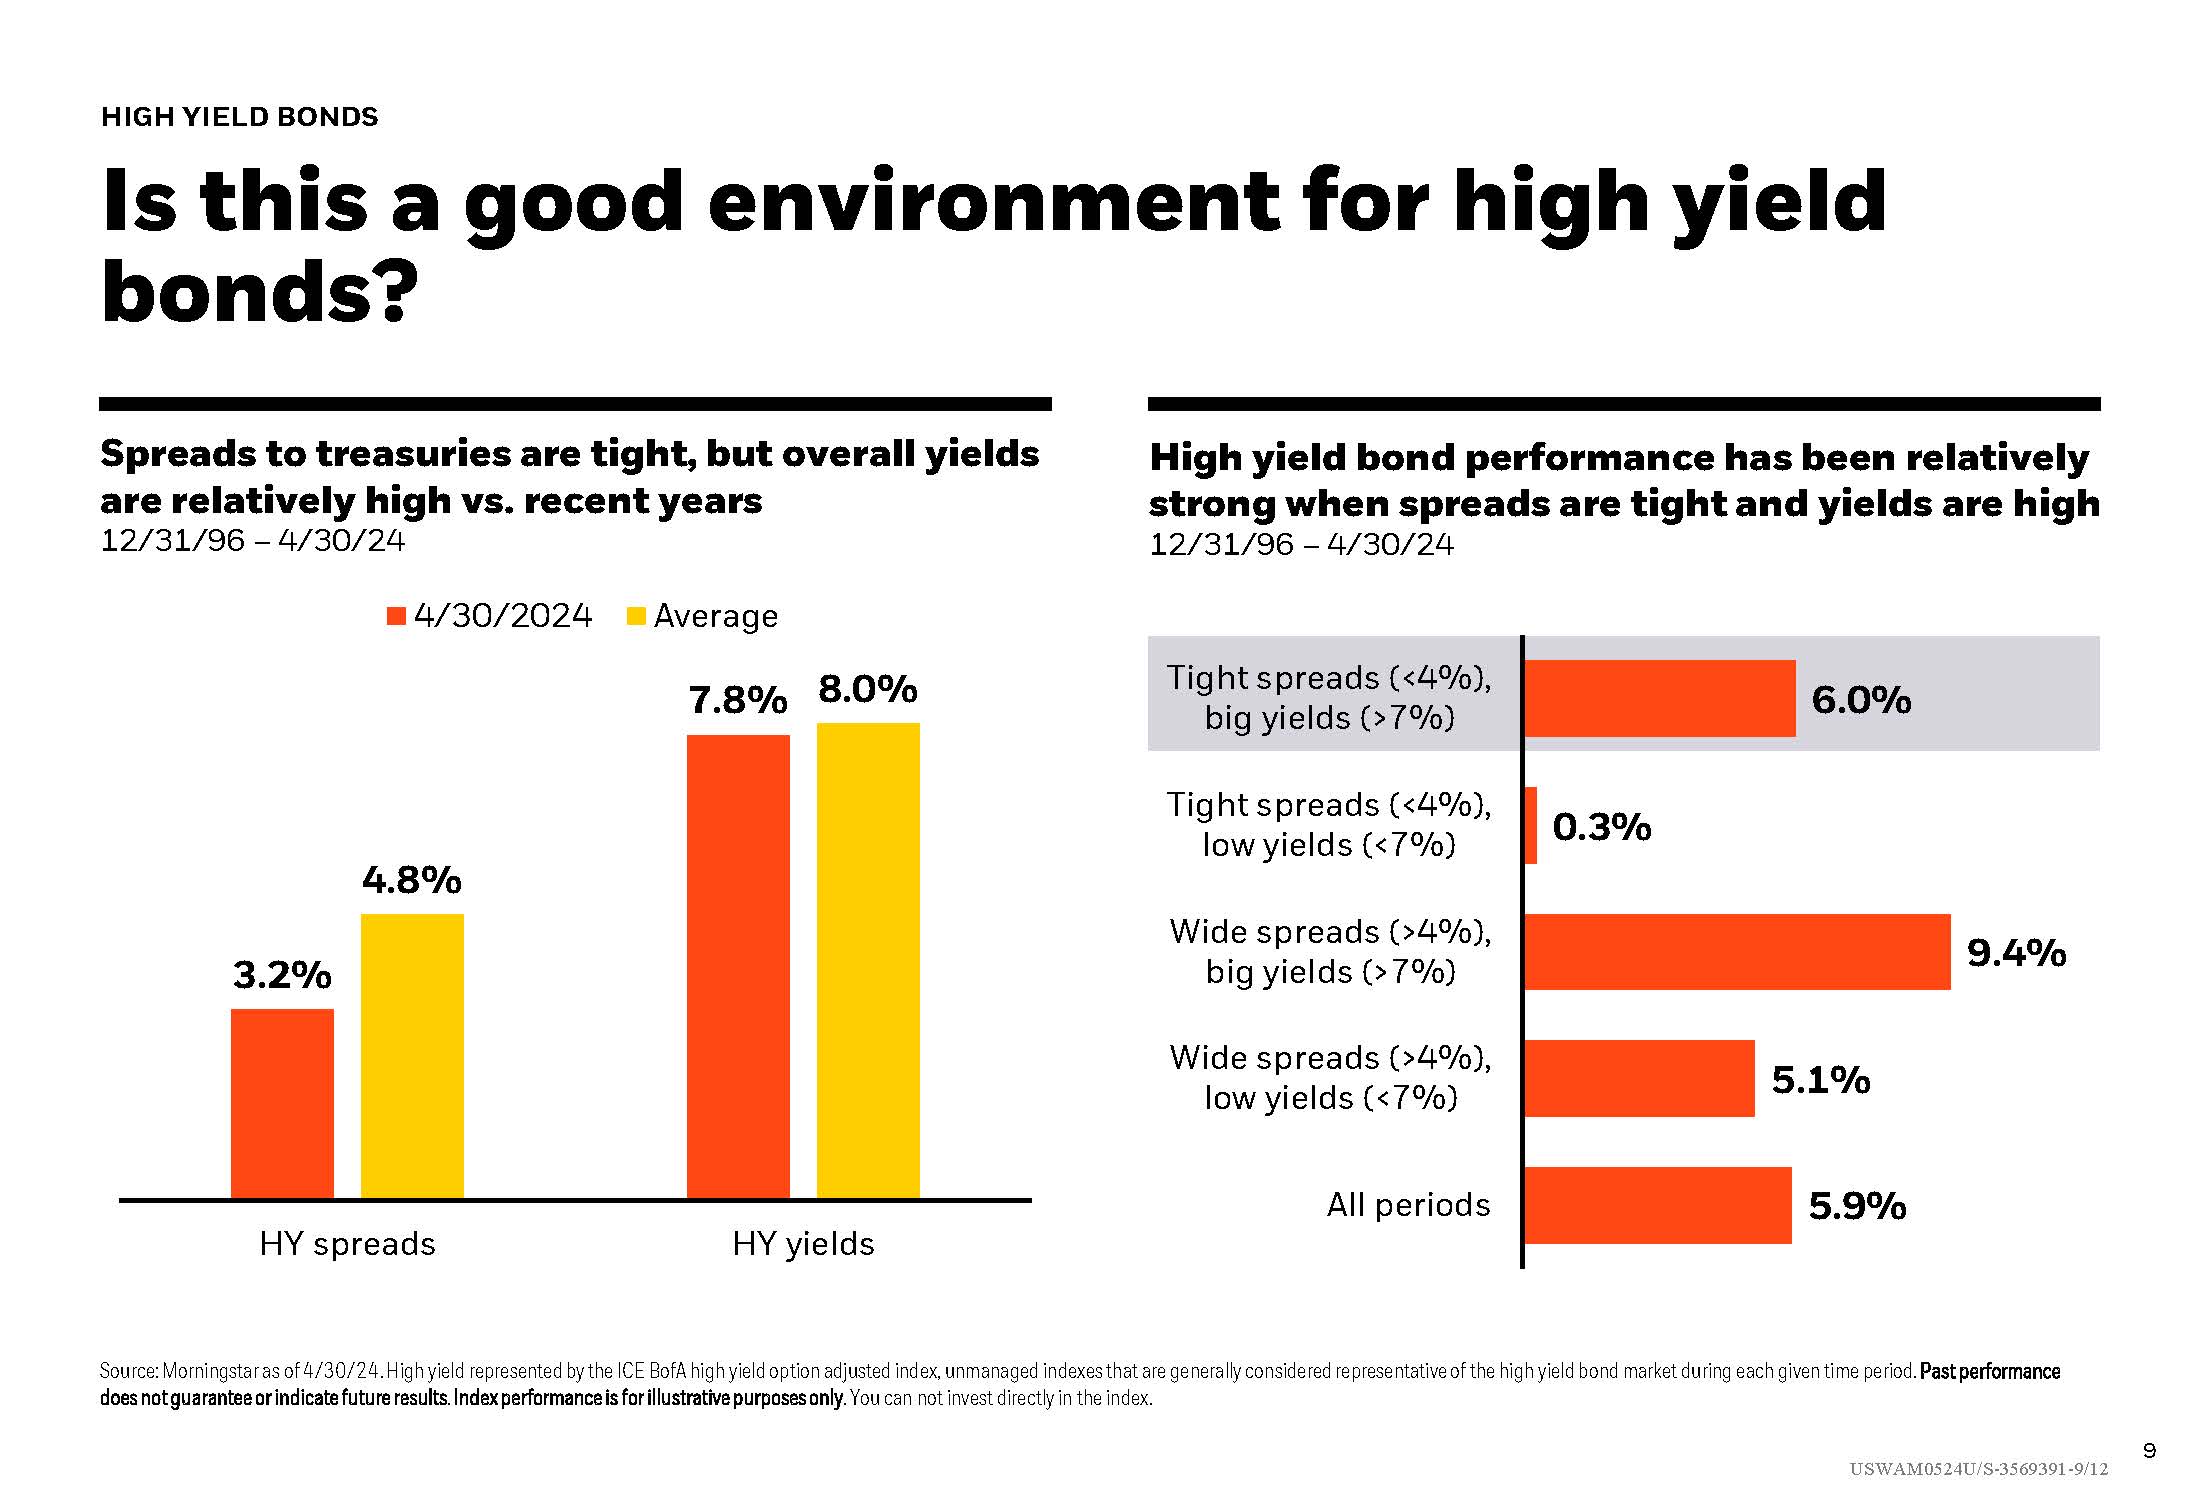
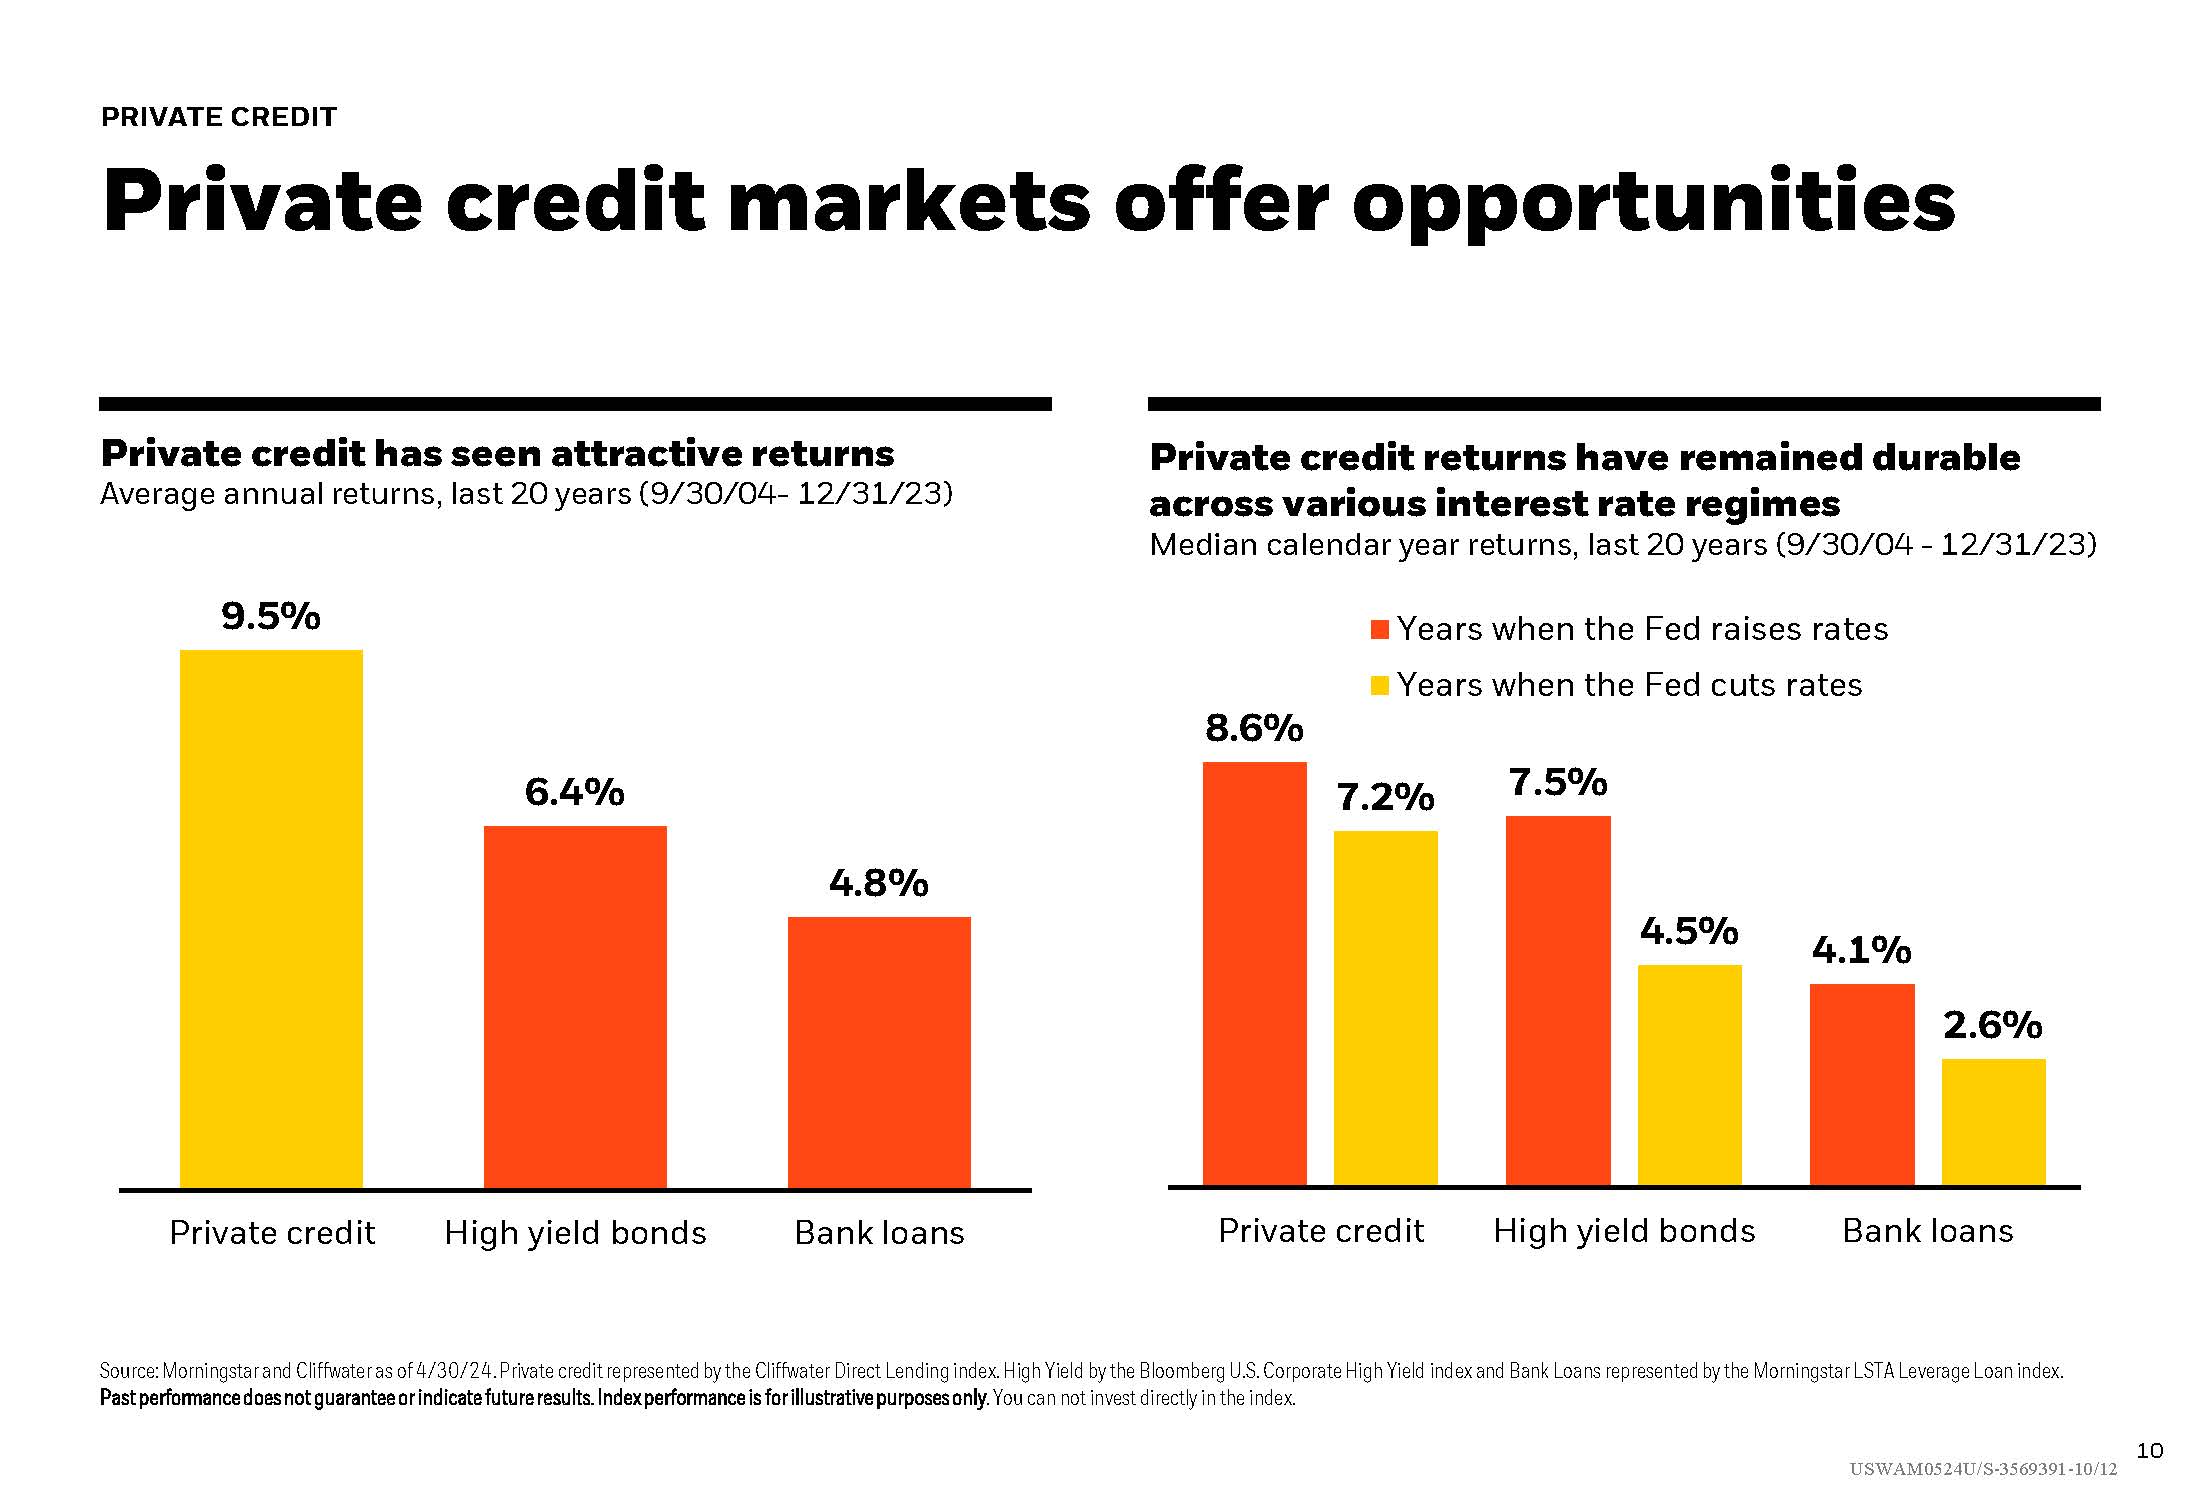
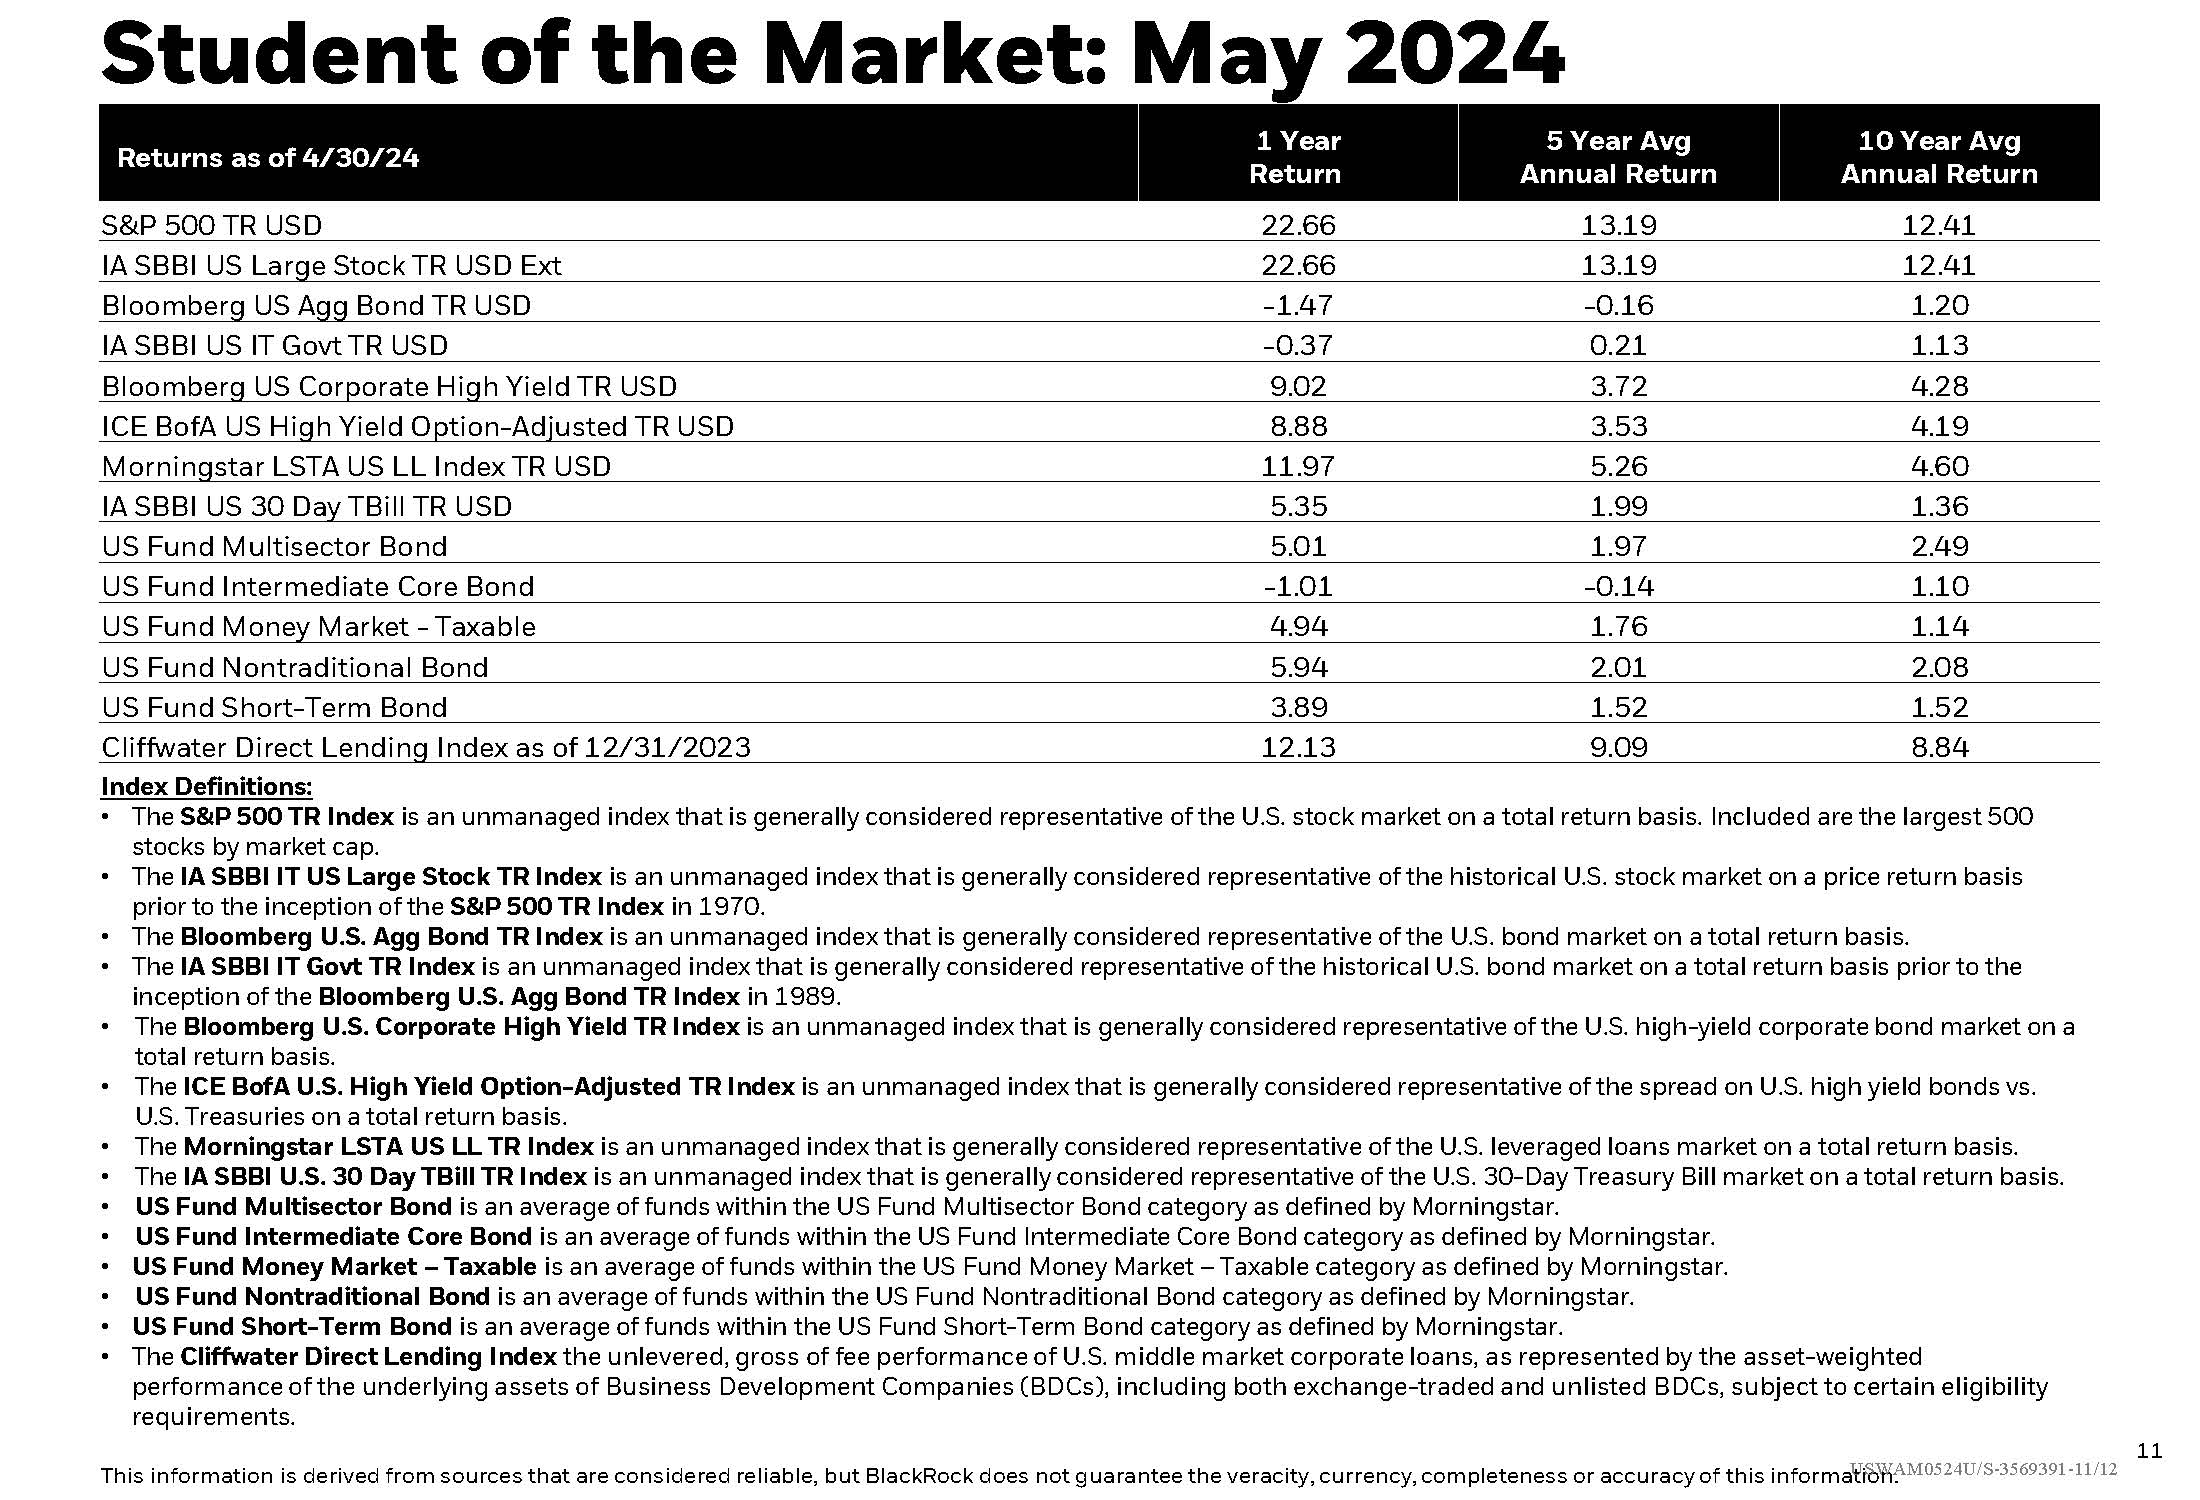
Historical data showing how U.S. stocks have tended to lose money less often in election years, showing the smaller percent of calendar years that lost money, which often tended to be driven by historic economic events, not elections. Included is a glimpse at seasonal stock and bond returns in election years. Also asset classes, inverted yield curve update, high yield bonds environment, and private credit returns.

May 23, 2024
Stock Performance in Election Years
Important Disclosure: Content on our website and in our newsletters is for informational purposes only. The information provided may (or may not) directly apply to your situation. We recommend that readers work directly with a professional advisor when making decisions in the context of their specific situation.

Other content you may like

  • Assessing the Health of Your Business

    June 3, 2021
    In today’s business climate, it may be more important than ever for companies to operate at maximum efficiency and with a keen awareness of the potential impact of changes in their industry and the economy.
    Read this Article
  • Strong Valley Wealth & Pension Mid-Quarter Round Table Highlights

    Podcast Highlight - What can we do to be prepared?

    June 23, 2023
    With the news focused on the impending recession, is there something that can be done to prepare without responding in panic and making poor decisions. The team gives examples of why a financial plan is so important.
    Read this Article
  • What's Driving the Market

    Podcast Highlight - Mid-Quarter Recap: Nov. thru Feb.

    March 6, 2023
    Beginning this recap, the team takes a look at a last year’s positive 4th Quarter, a pretty hot January and “good to see green” in Feb.
    Read this Article
  • Is Value Poised for a Big Bounce?

    Is Value Poised for a Big Bounce?

    October 19, 2021
    This Student of the Market looks at what happened in September with stock market returns and an overview of 2021 for bond market returns. Growth versus Value is charted along with Long-Term Bond returns, and alternative fund flows. A helpful chart illustrates a broad category and specific category breakdown of what goes into Headline inflation.
    Read this Article
  • The link you have selected is located on another server. The linked site contains information that has been created, published, maintained, or otherwise posted by institutions or organizations independent of this organization. We do not endorse, approve, certify, or control any linked websites, their sponsors, or any of their policies, activities, products, or services. We do not assume responsibility for the accuracy, completeness, or timeliness of the information contained therein. Visitors to any linked websites should not use or rely on the information contained therein until they have consulted with an independent financial professional. Please click “Continue to Link” to leave this website and proceed to the selected site.
    phone-handset