Article

Tariffs, Trade and Your Grocery Bill

A concerned man reviews his grocery bill in front of the produce section of a market. There is a cargo ship and containers, as well as a truck to transport goods, in the background. There are dollar signs signifying the cost of items in the supply chain is a concern.

How do tariffs affect what you pay at the grocery store? This article dives into the complex relationship between trade policies, groceries and durable goods, as well as impacts on your portfolio. It unravels the mystery of why prices rise or fall based on global trade changes and helps the reader understand the bigger picture.

July 7, 2025
A concerned man reviews his grocery bill in front of the produce section of a market. There is a cargo ship and containers, as well as a truck to transport goods, in the background. There are dollar signs signifying the cost of items in the supply chain is a concern.
Important Disclosure: Content on our website and in our newsletters is for informational purposes only. The information provided may (or may not) directly apply to your situation. We recommend that readers work directly with a professional advisor when making decisions in the context of their specific situation.

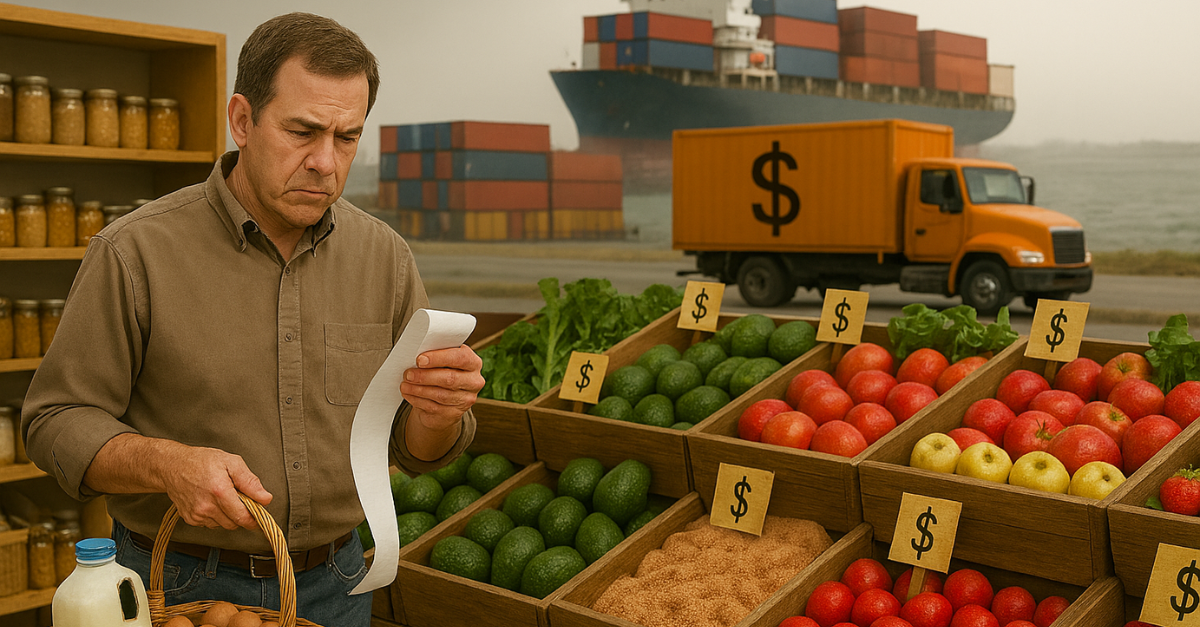
You may not follow every headline about trade policy, but you can’t miss the ripple effect when a week’s worth of groceries suddenly costs $20 more. Here’s why those checkout‑line surprises matter to both your pantry and your portfolio.

From Cargo Ship to Shopping Cart: How Tariffs Travel

When the U.S. or its trading partners slap a tariff on imported goods—whether it’s Mexican avocados, European cheese, or Chinese steel—the sticker shock doesn’t stop at the border. Importers typically pass part of the new tax on to wholesalers, likewise, truckers add a little more to cover higher insurance and fuel, and retailers protect their own thin margins. By the time the item reaches the local store, each link in the supply chain has added a few extra cents and that compounds into dollars.

Agricultural products feel the squeeze most acutely because perishables can’t wait. If retaliatory tariffs delay shipments at ports, spoilage risk rises and prices jump even faster. That’s why strawberries can soar in May yet drop back in June when diplomatic skirmishes cool. For households on fixed incomes, such volatility is more than an annoyance—it forces difficult trade‑offs in weekly budgeting.

Tariffs as an (Unreliable) Inflation Indicator

Tariffs aren’t the only force nudging prices north—wages, energy, and weather all play roles. Historically, a broad‑based tariff hike adds a modest bump to the Consumer Price Index over 12 months. The shock is usually front‑loaded, with grocery prices reacting within weeks, while durable goods follow more slowly.

For diversification‑minded investors, the key insight is that tariffs tend to:

  • Elevate short‑term inflation expectations. Bond markets may demand higher yields, pressuring existing fixed‑income prices.
  • Pinch margins in globally integrated sectors such as autos and semiconductors, leading to near‑term earnings volatility.
  • Benefit niche pockets—domestic producers of the newly protected goods. However, history shows these windfalls often fade once competitors adjust supply chains.

In other words, tariff headlines can be noisy, but their portfolio impact is uneven and often temporary. Maintaining a flexible asset‑allocation strategy offers investors room to navigate short bouts of price turbulence without abandoning long‑term growth goals.

Grocery‑Line Strategies That Double as Portfolio Habits

Just as shoppers learn to cushion their food budgets, investors can build habits that insulate their wealth from policy‑driven price swings.

In the Aisles

  • Buy in season & store wisely. Stock up on tariff‑free produce when supply peaks, then freeze or can extras.
  • Use substitutes. Swap out tariff‑heavy items (imported rice) for domestic grains (barley, oats).
  • Plan a staples budget. Set a firm monthly spend for essentials and adjust discretionary extras instead.

In the Markets

  • Rebalance opportunistically. Add to under‑loved asset classes (e.g., international small‑caps) when tariff angst drives them to discounts.
  • Diversify revenue streams. Favor companies with flexible supply chains or ample domestic sales to offset tariff‐related drag.
  • Segregate cash needs. Keep 12–18 months of living expenses in liquid reserves so to avoid having to sell growth assets into tariff‑spooked markets.

Key Takeaways

  • Tariffs cascade quickly through perishable goods. Tarriff increases often show up at the supermarket before the next credit‑card cycle.
  • Portfolio effects are real, but mixed. Some sectors win, others wobble, and the shock tends to fade over 12–18 months.
  • Inflation‑aware positioning. Strategies that utilize laddered bonds, dividend growers, and real assets, may provide a built‑in cushion.
  • Household budgeting tactics. Using suitable substitutions and purchasing products in bulk buffers cash.
  • Stay goal‑focused. A tariff is a policy squall, not a climate shift; diversify rather than overhaul.

Disciplined planning helps to ensure that both your pantry shelves and retirement accounts stay productive, even when macro conditions dry up profits elsewhere.

Other content you may like

  • Podcast Highlight - Money Market Yields & Fixed Income

    August 31, 2023
    The Team explains and illustrates the downfalls of abandoning long-term plans to jump into short-term solutions for fixed incomes.
    Read this Article
  • What Should You Do as Markets Flirt with Bears?

    What Should You Do as Markets Flirt with Bears?

    May 24, 2022
    Market declines should inform – not drive – your asset allocation decisions. Does it matter if the S&P 500 is down 19% versus 21%? Both scenarios probably leave you feeling anxious and you’re sure not alone. It’s times like this that perspective is important. This article examines the last time the S&P 500 was in a bear market and a little history of other past bear markets.
    Read this Article
  • Market Performance and a Recession Indicator

    Market Performance and a Recession Indicator

    December 1, 2022
    U.S. stocks historically average 10% per year but rarely do they finish a year at that level. See the difference between the average annual return and what happened to stocks YTD in 2022 by looking at the range of returns for stocks by the full calendar year. A quick glance at the most reliable recession indicator and how alternative asset classes do better when the return on “cash” is higher. Plus stats on market performance.
    Read this Article
  • A couple looking at a computer screen together.

    Planning Your Retirement Goals

    January 10, 2026
    Are you wondering how to meet your retirement goals? Or maybe you're wondering what to consider in coming up with a plan? This article provides answers to these questions and more, offering reasons why planning is so important today and how a financial professional can help.
    Read this Article
  • The link you have selected is located on another server. The linked site contains information that has been created, published, maintained, or otherwise posted by institutions or organizations independent of this organization. We do not endorse, approve, certify, or control any linked websites, their sponsors, or any of their policies, activities, products, or services. We do not assume responsibility for the accuracy, completeness, or timeliness of the information contained therein. Visitors to any linked websites should not use or rely on the information contained therein until they have consulted with an independent financial professional. Please click “Continue to Link” to leave this website and proceed to the selected site.
    phone-handset