Article

August Student of the Market

Title slide for a financial presentation

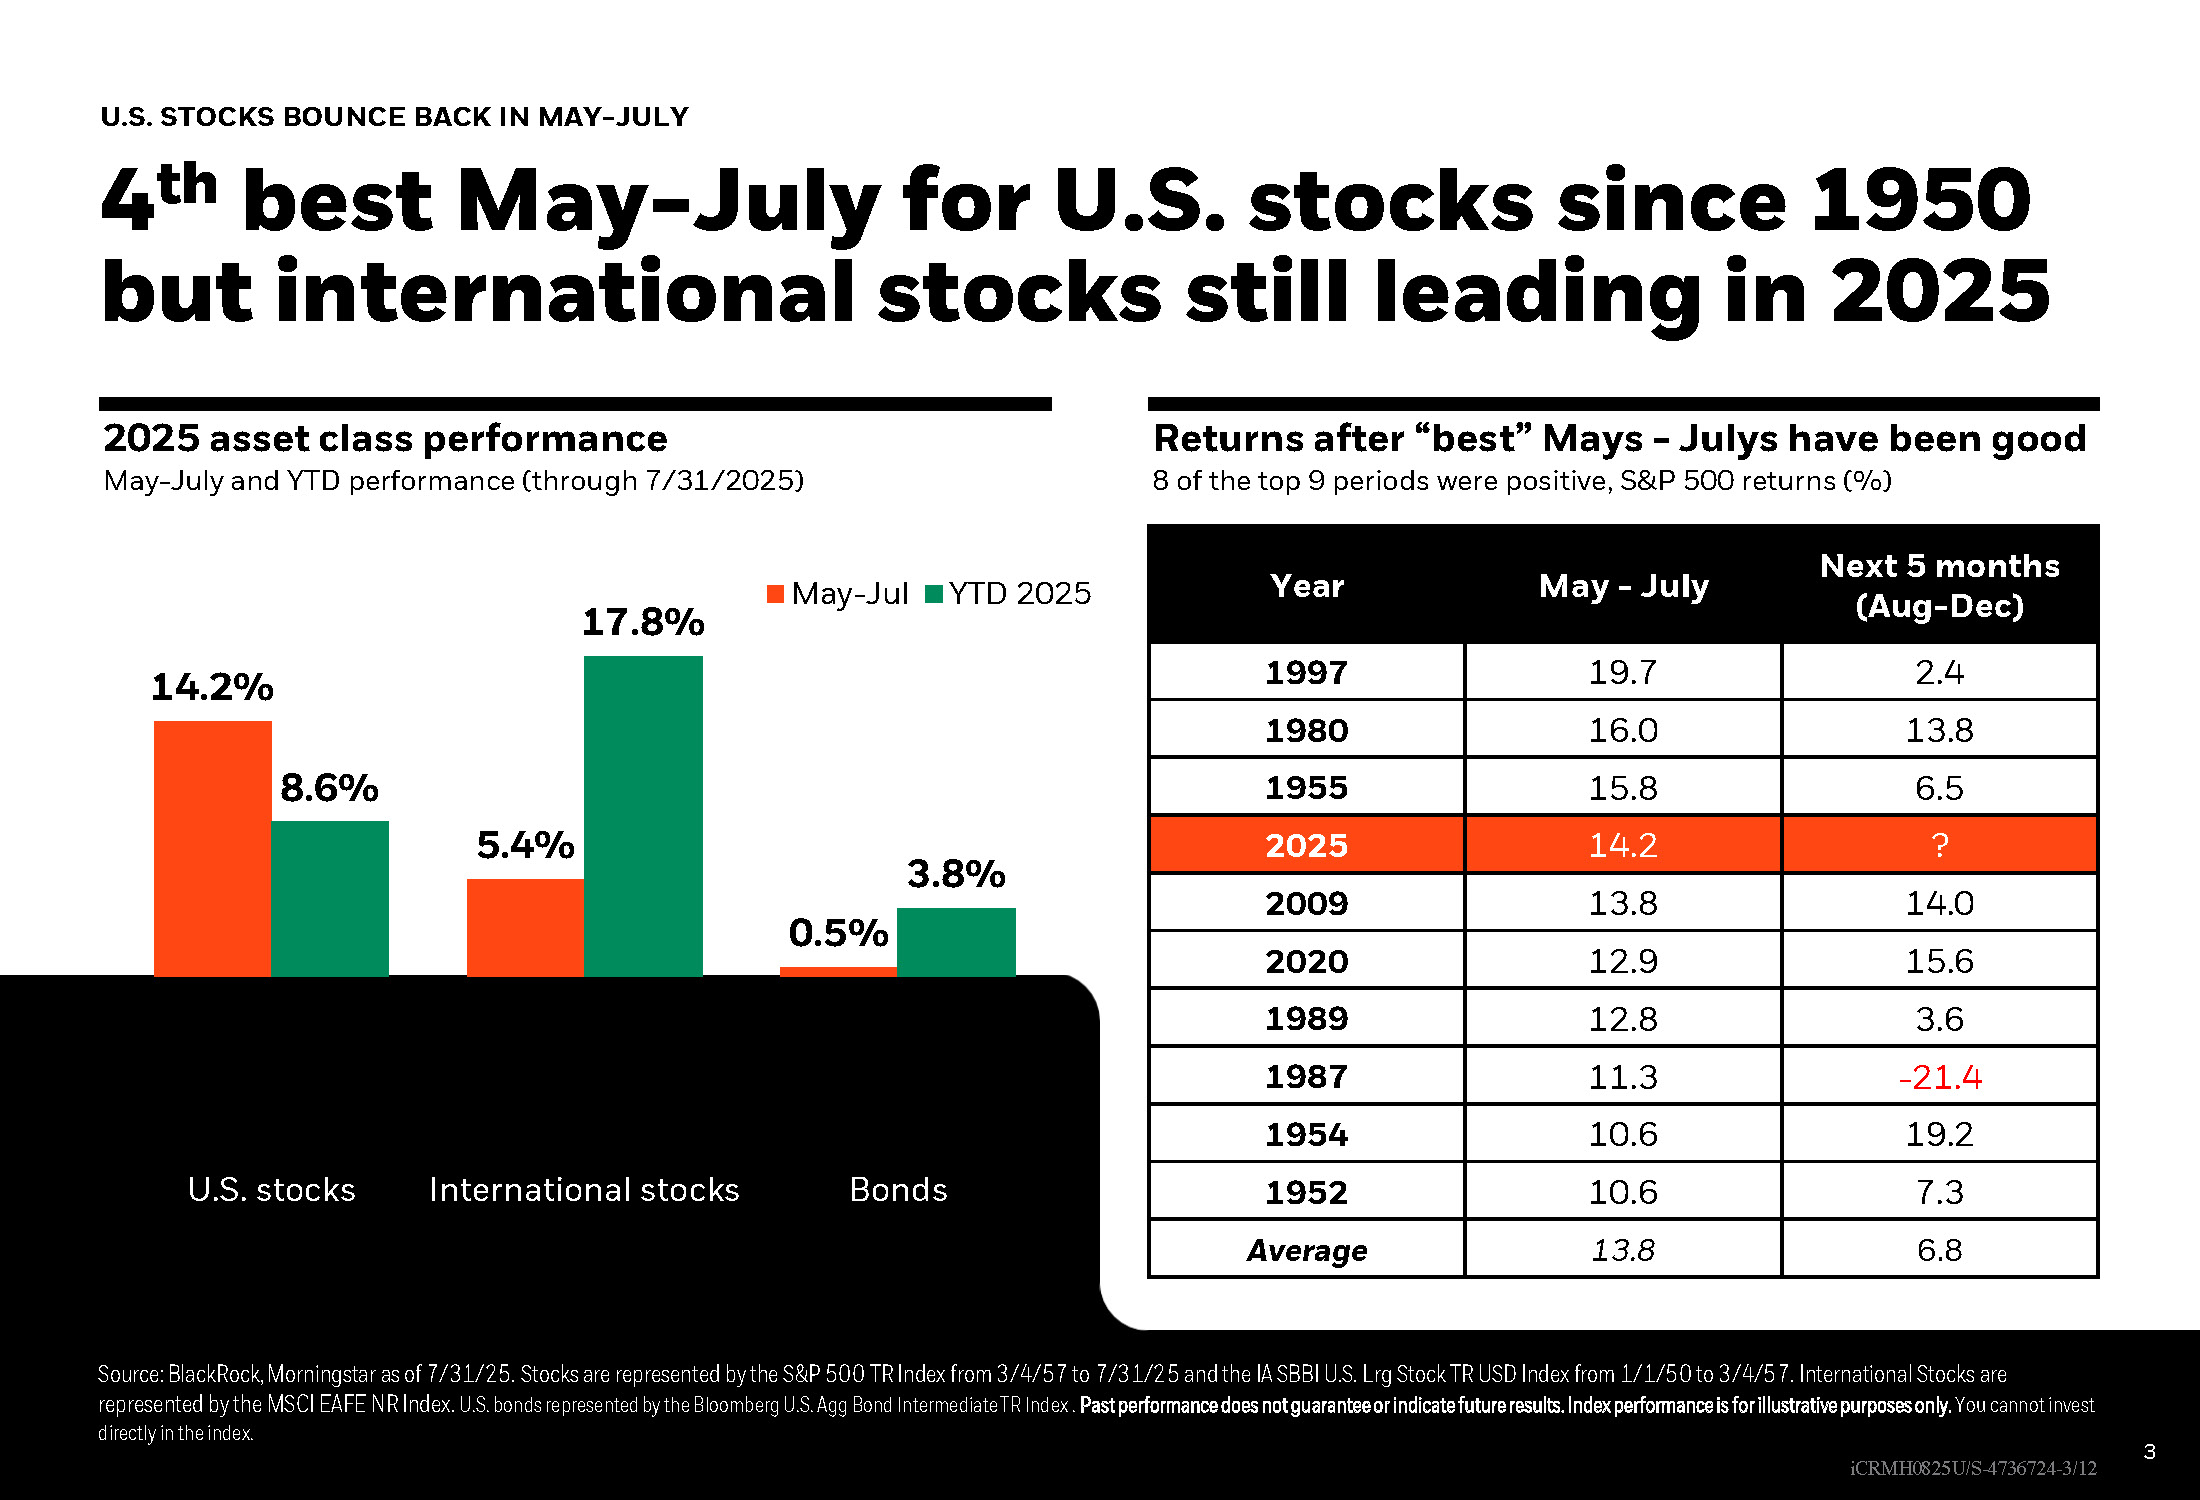
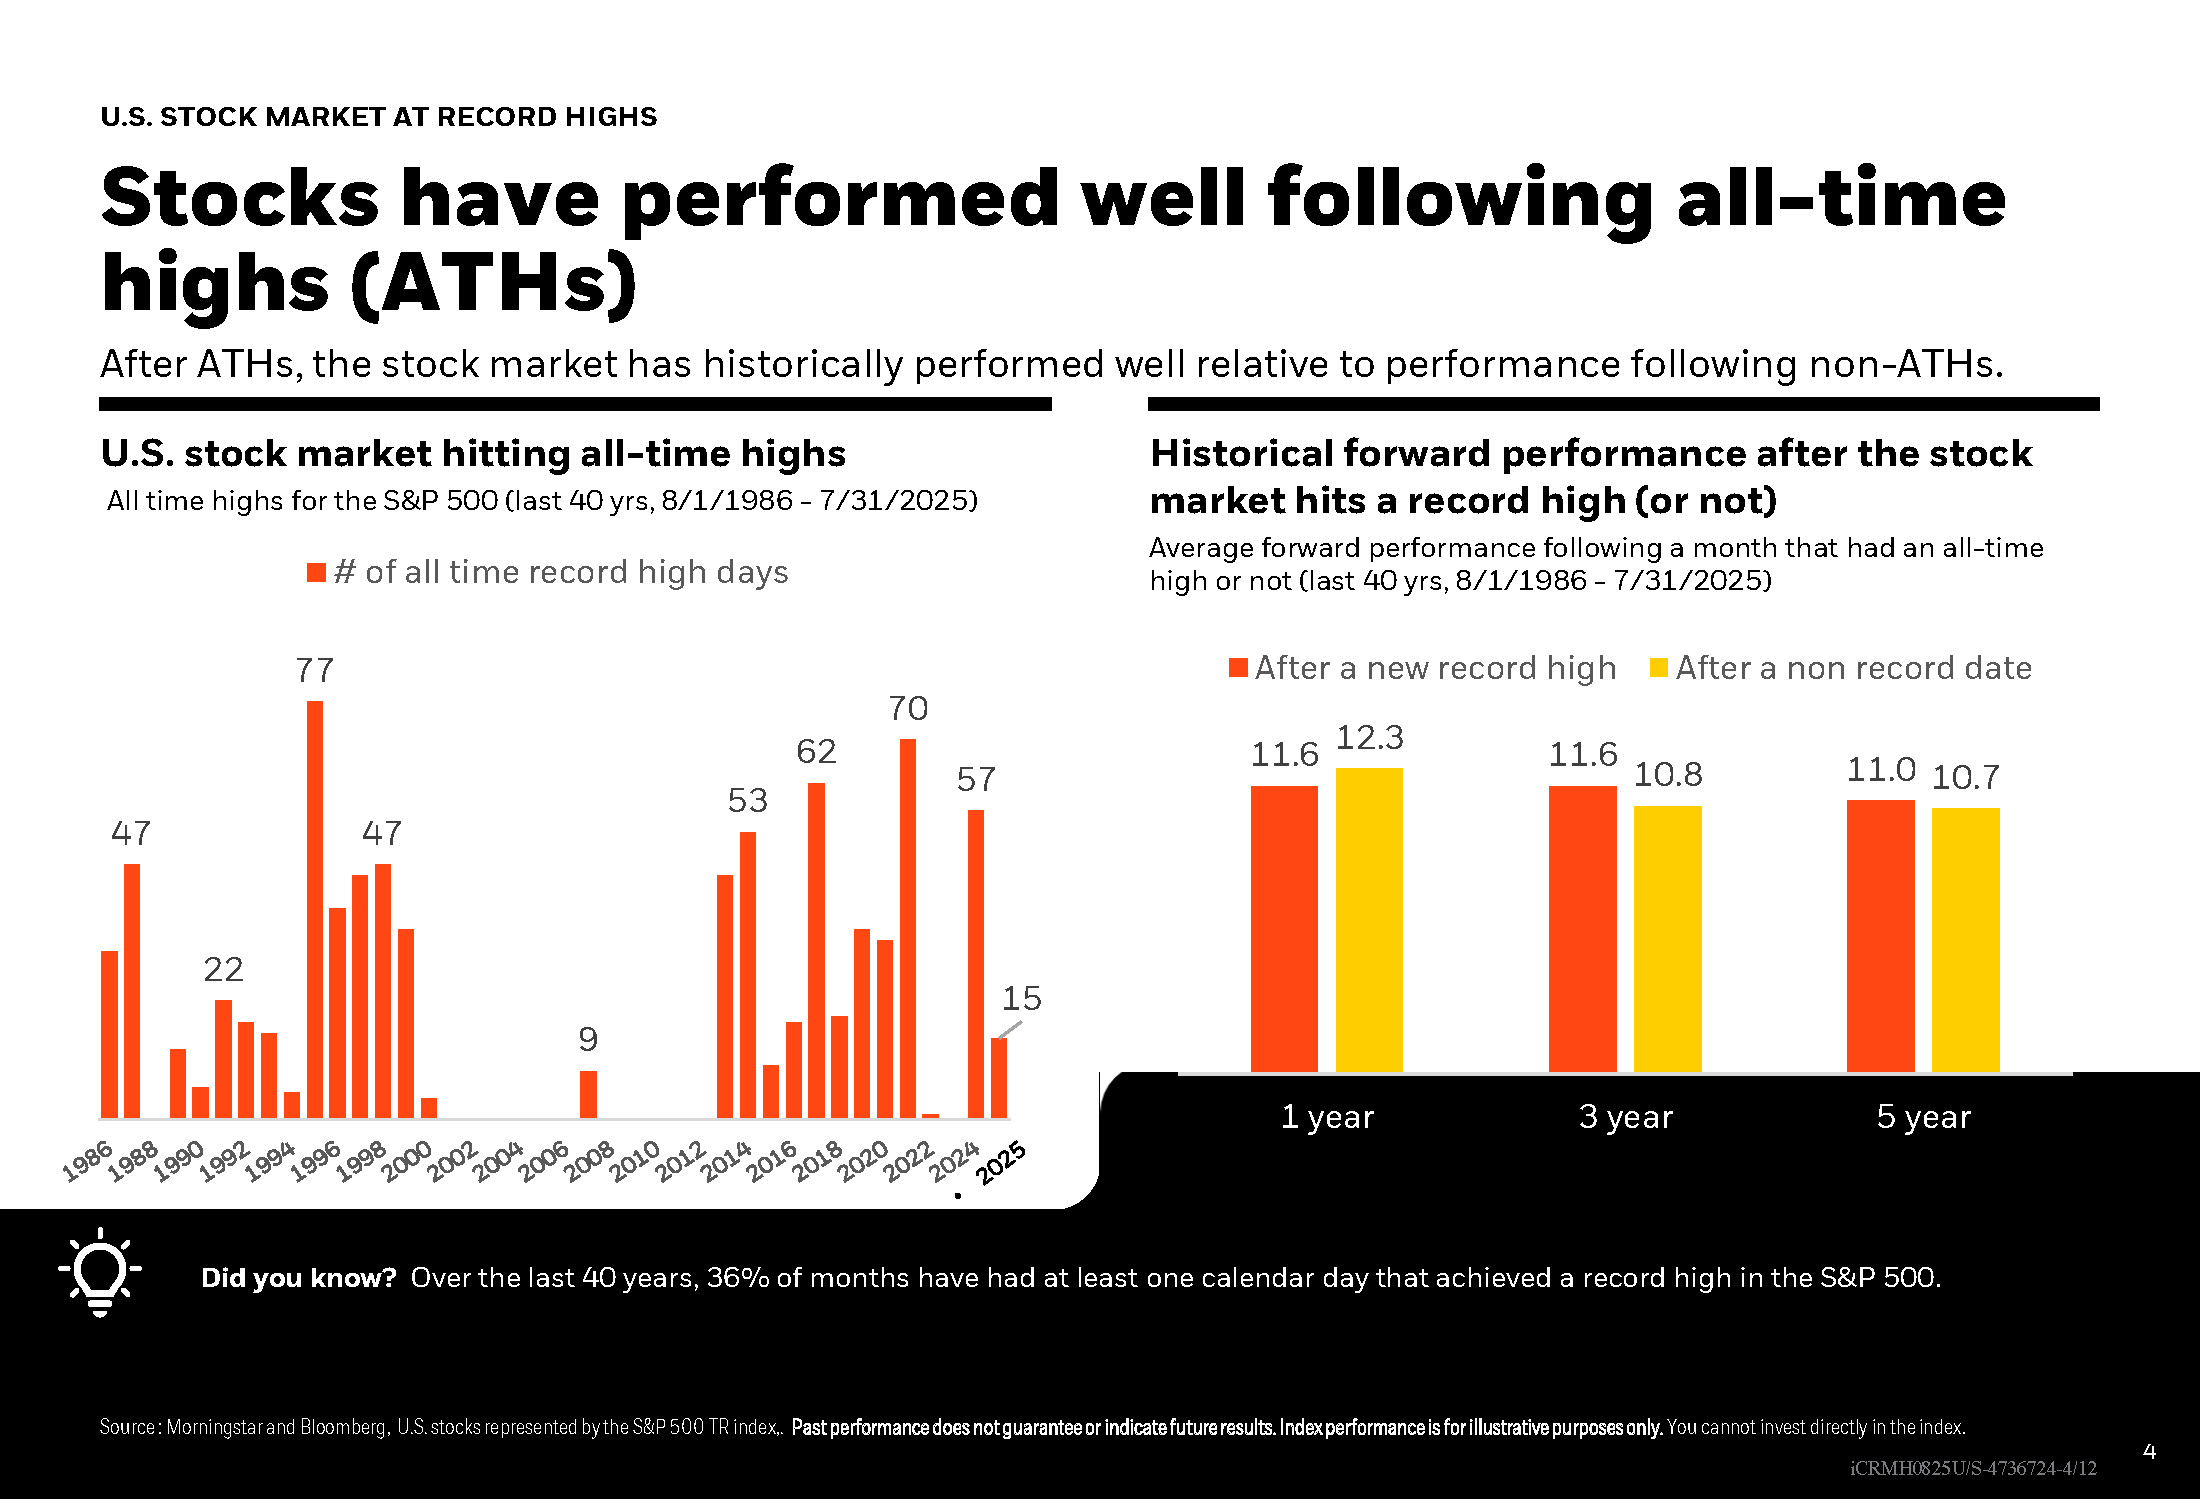
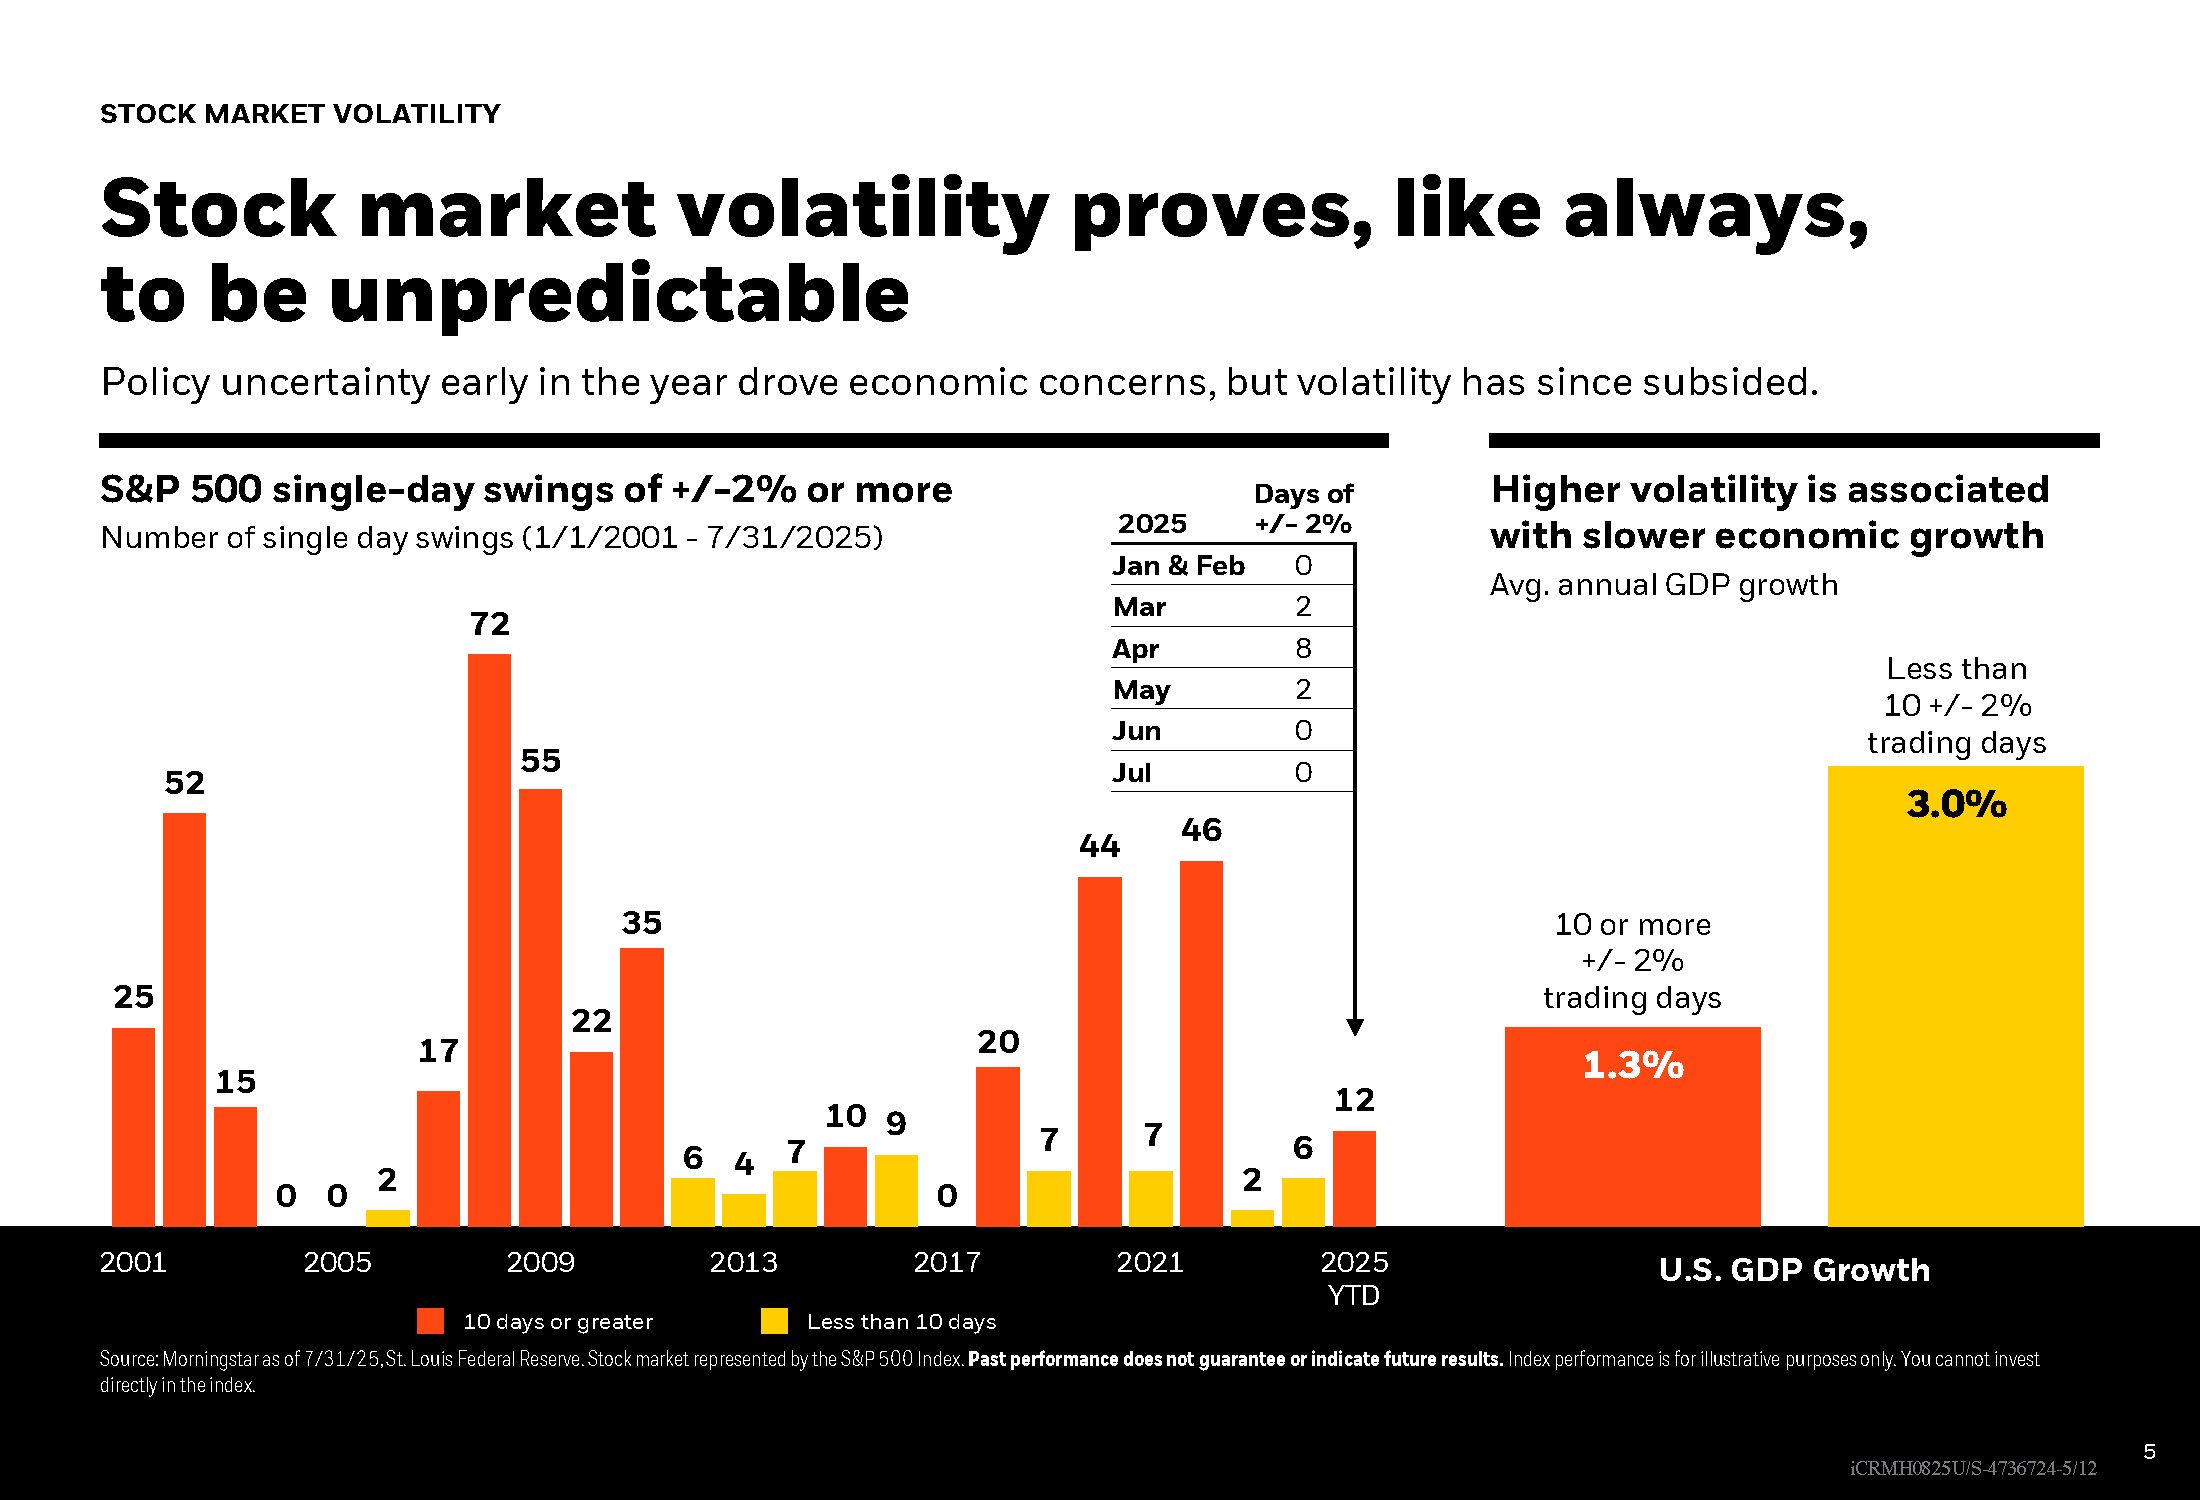
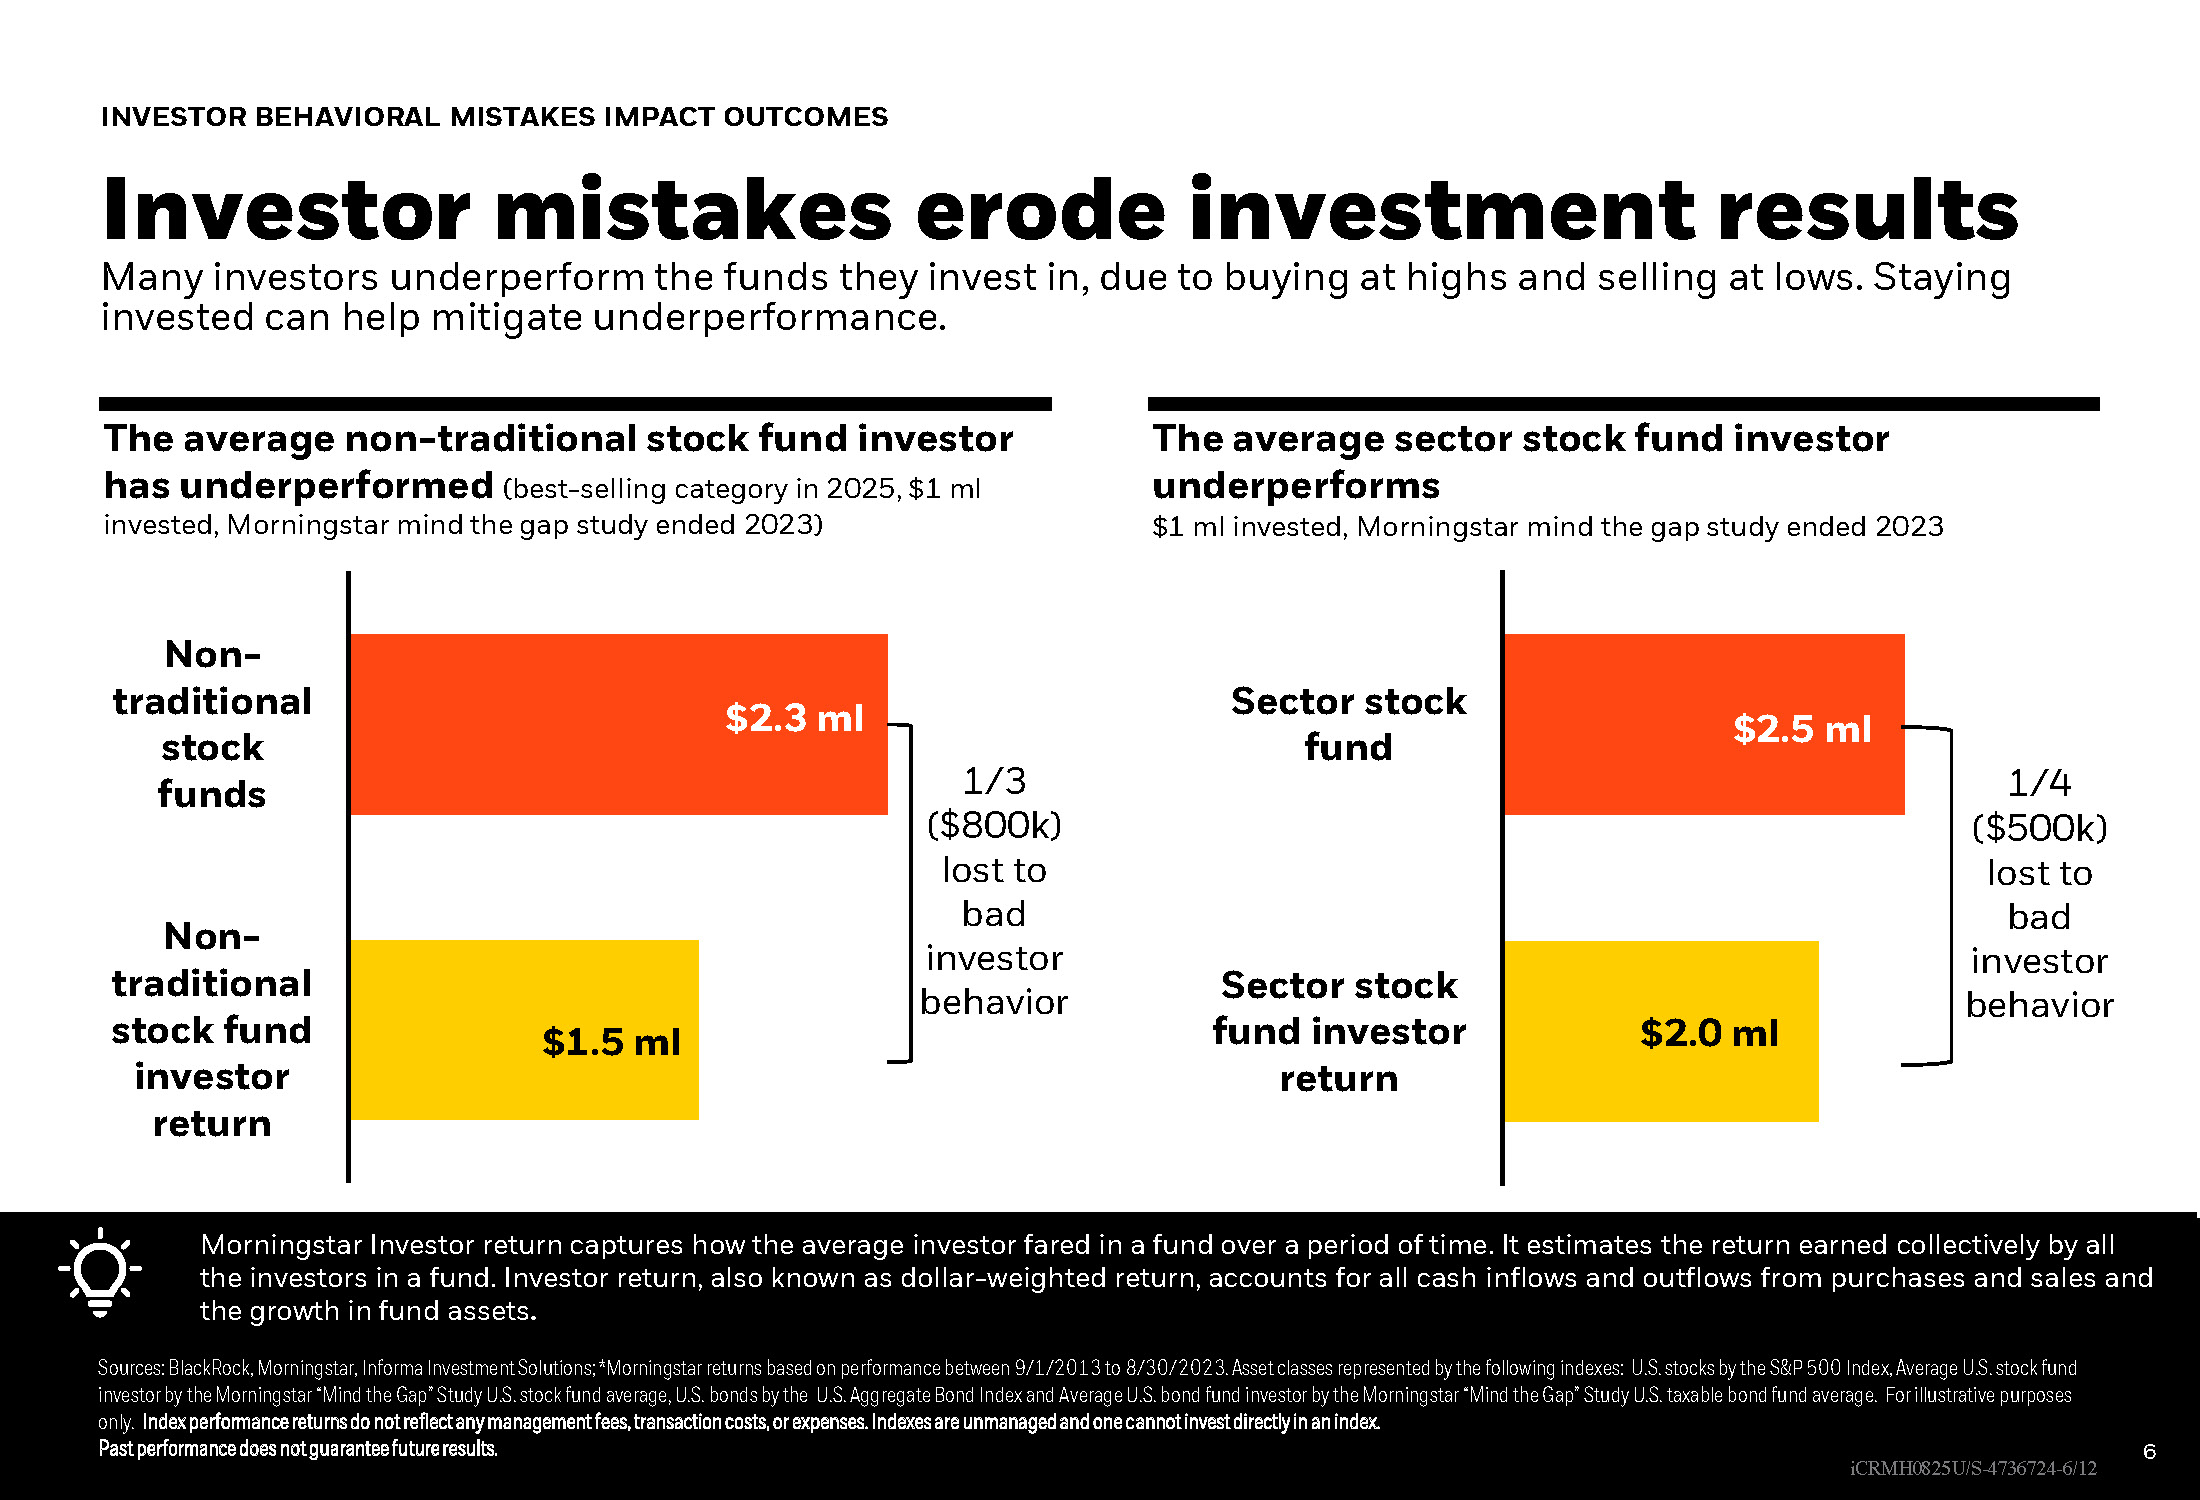
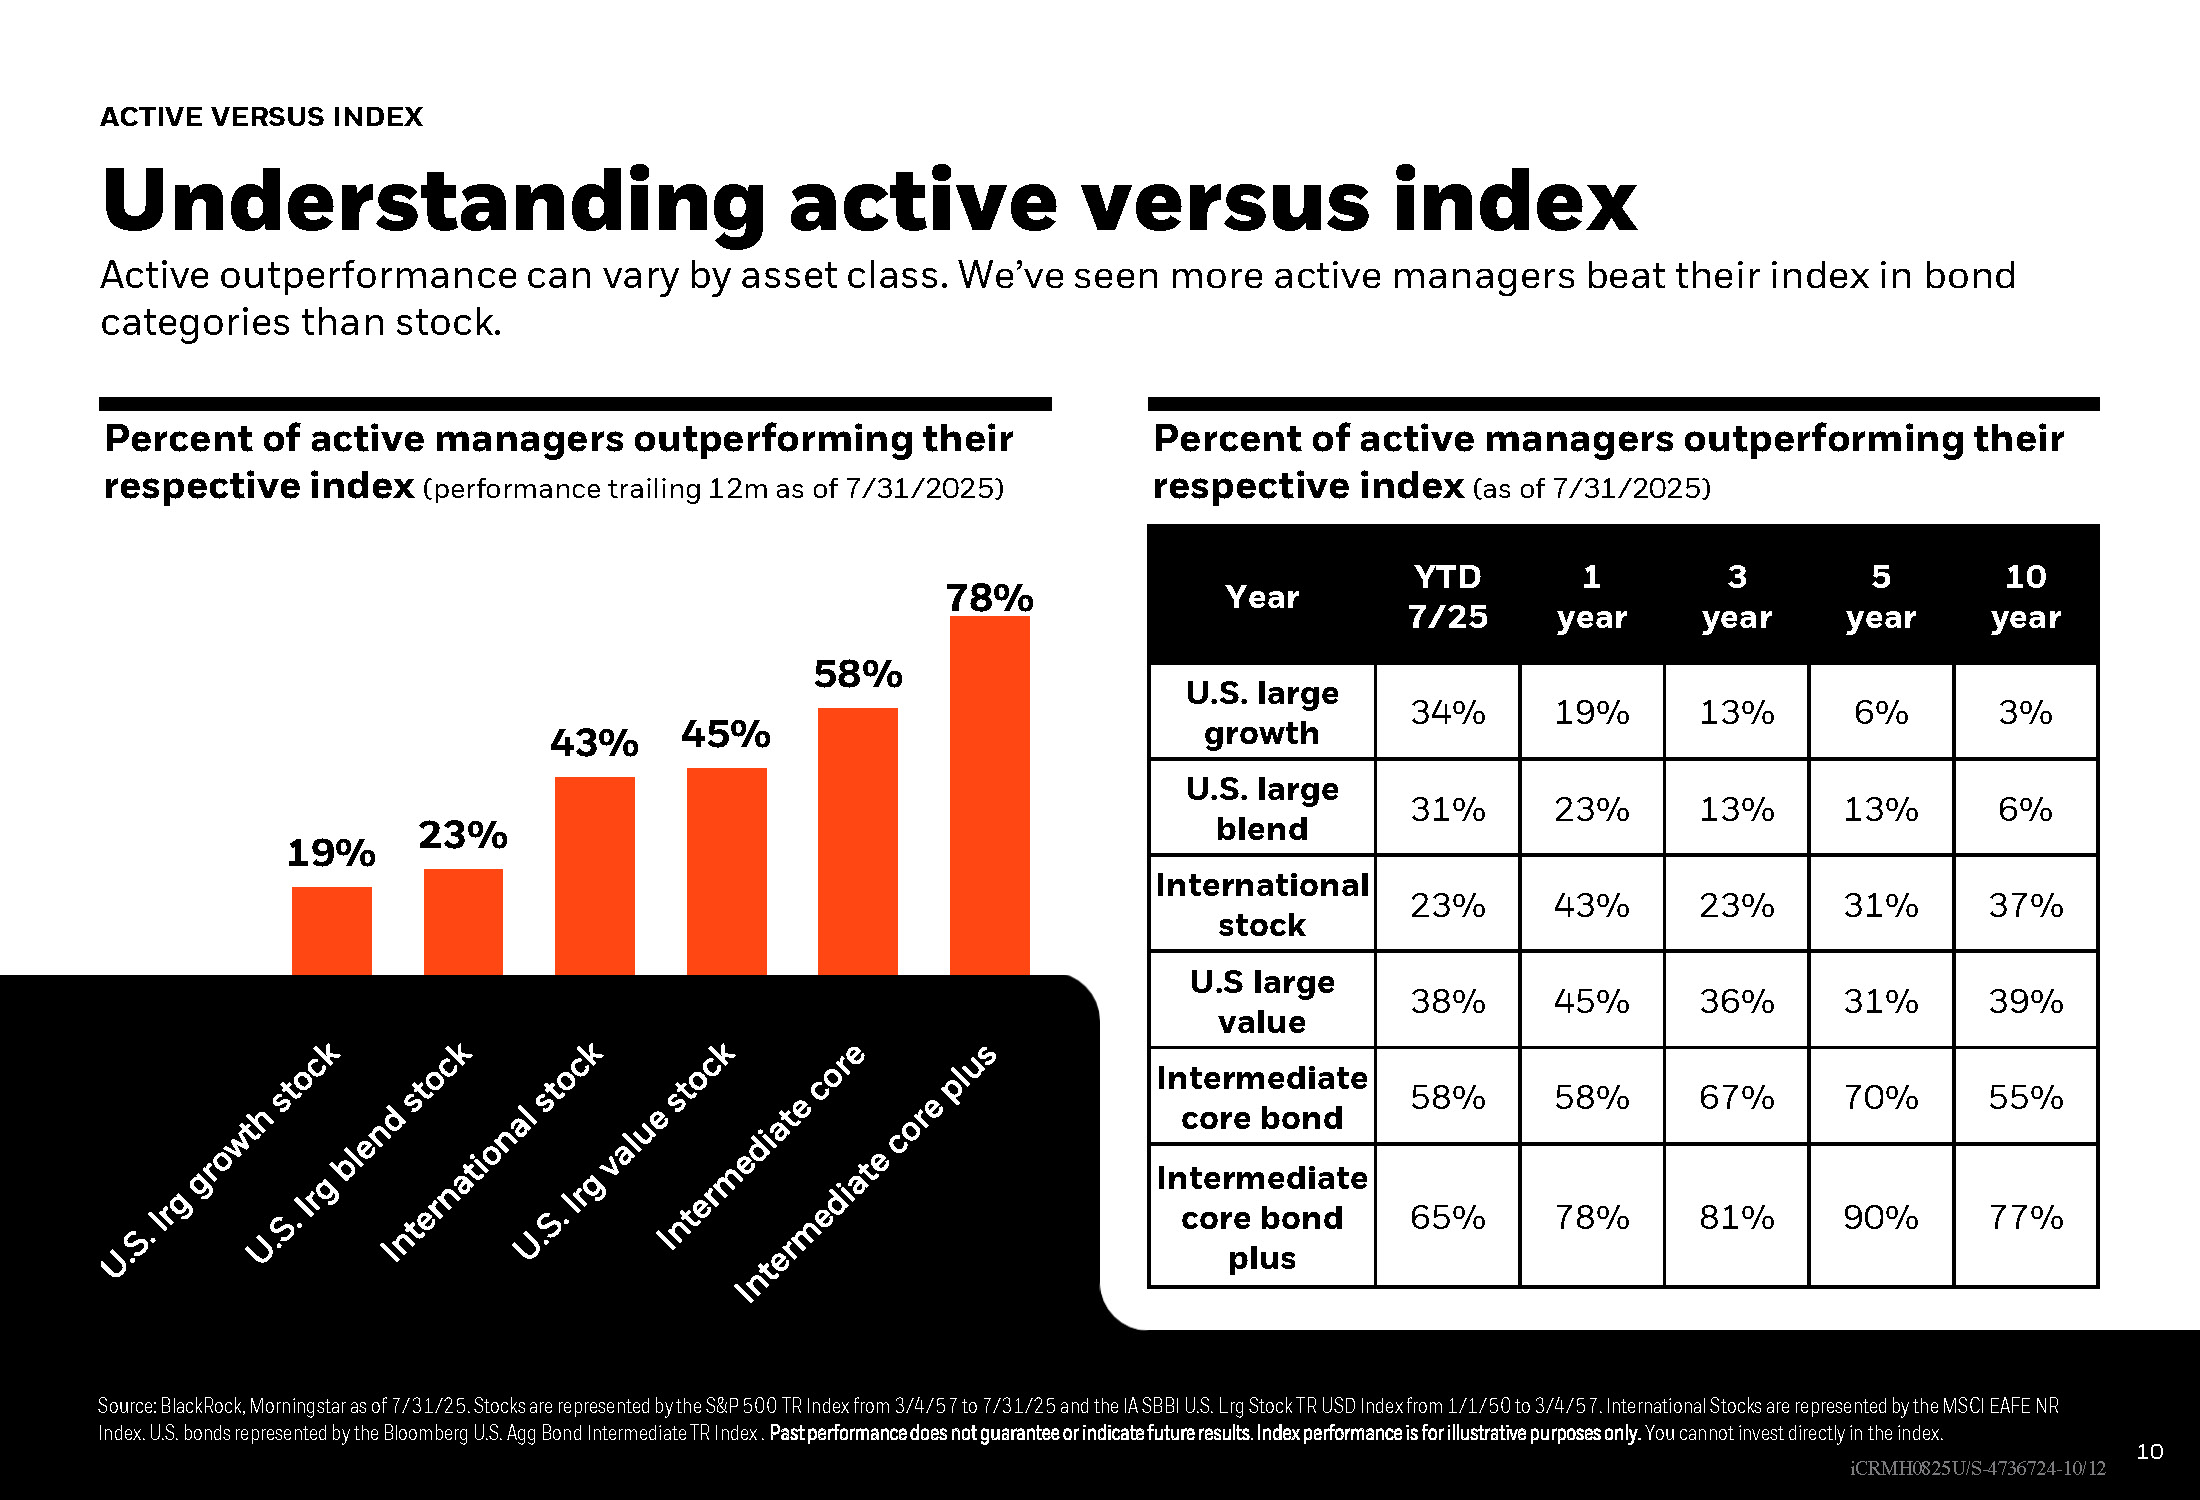
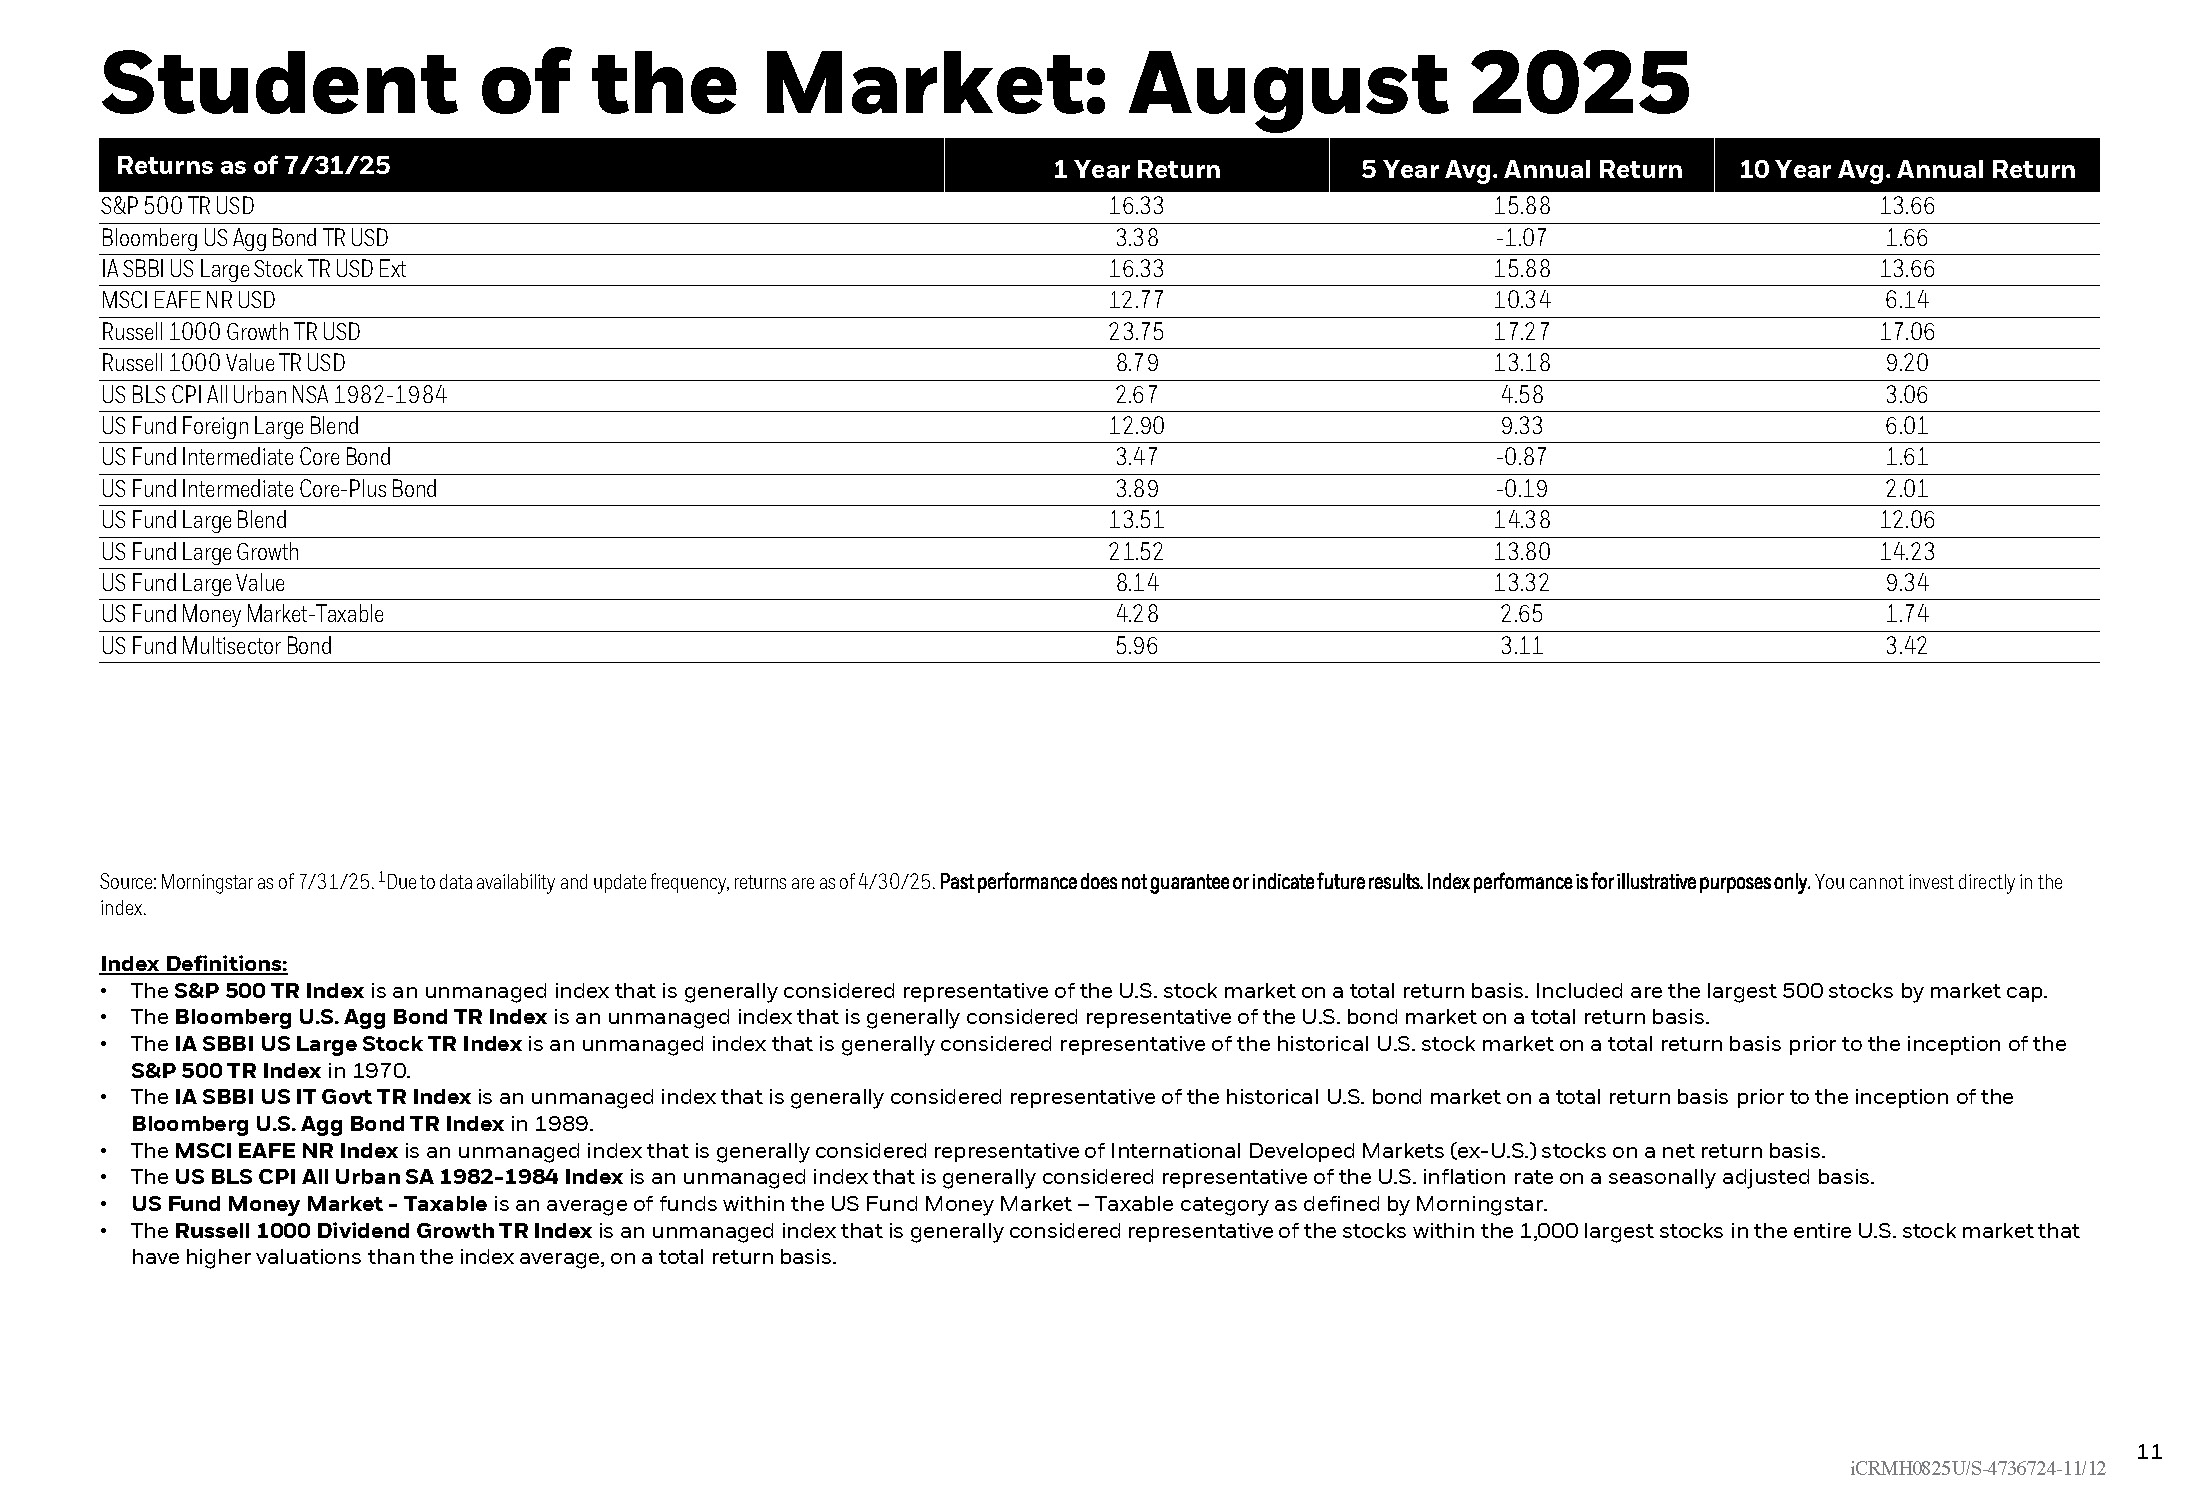
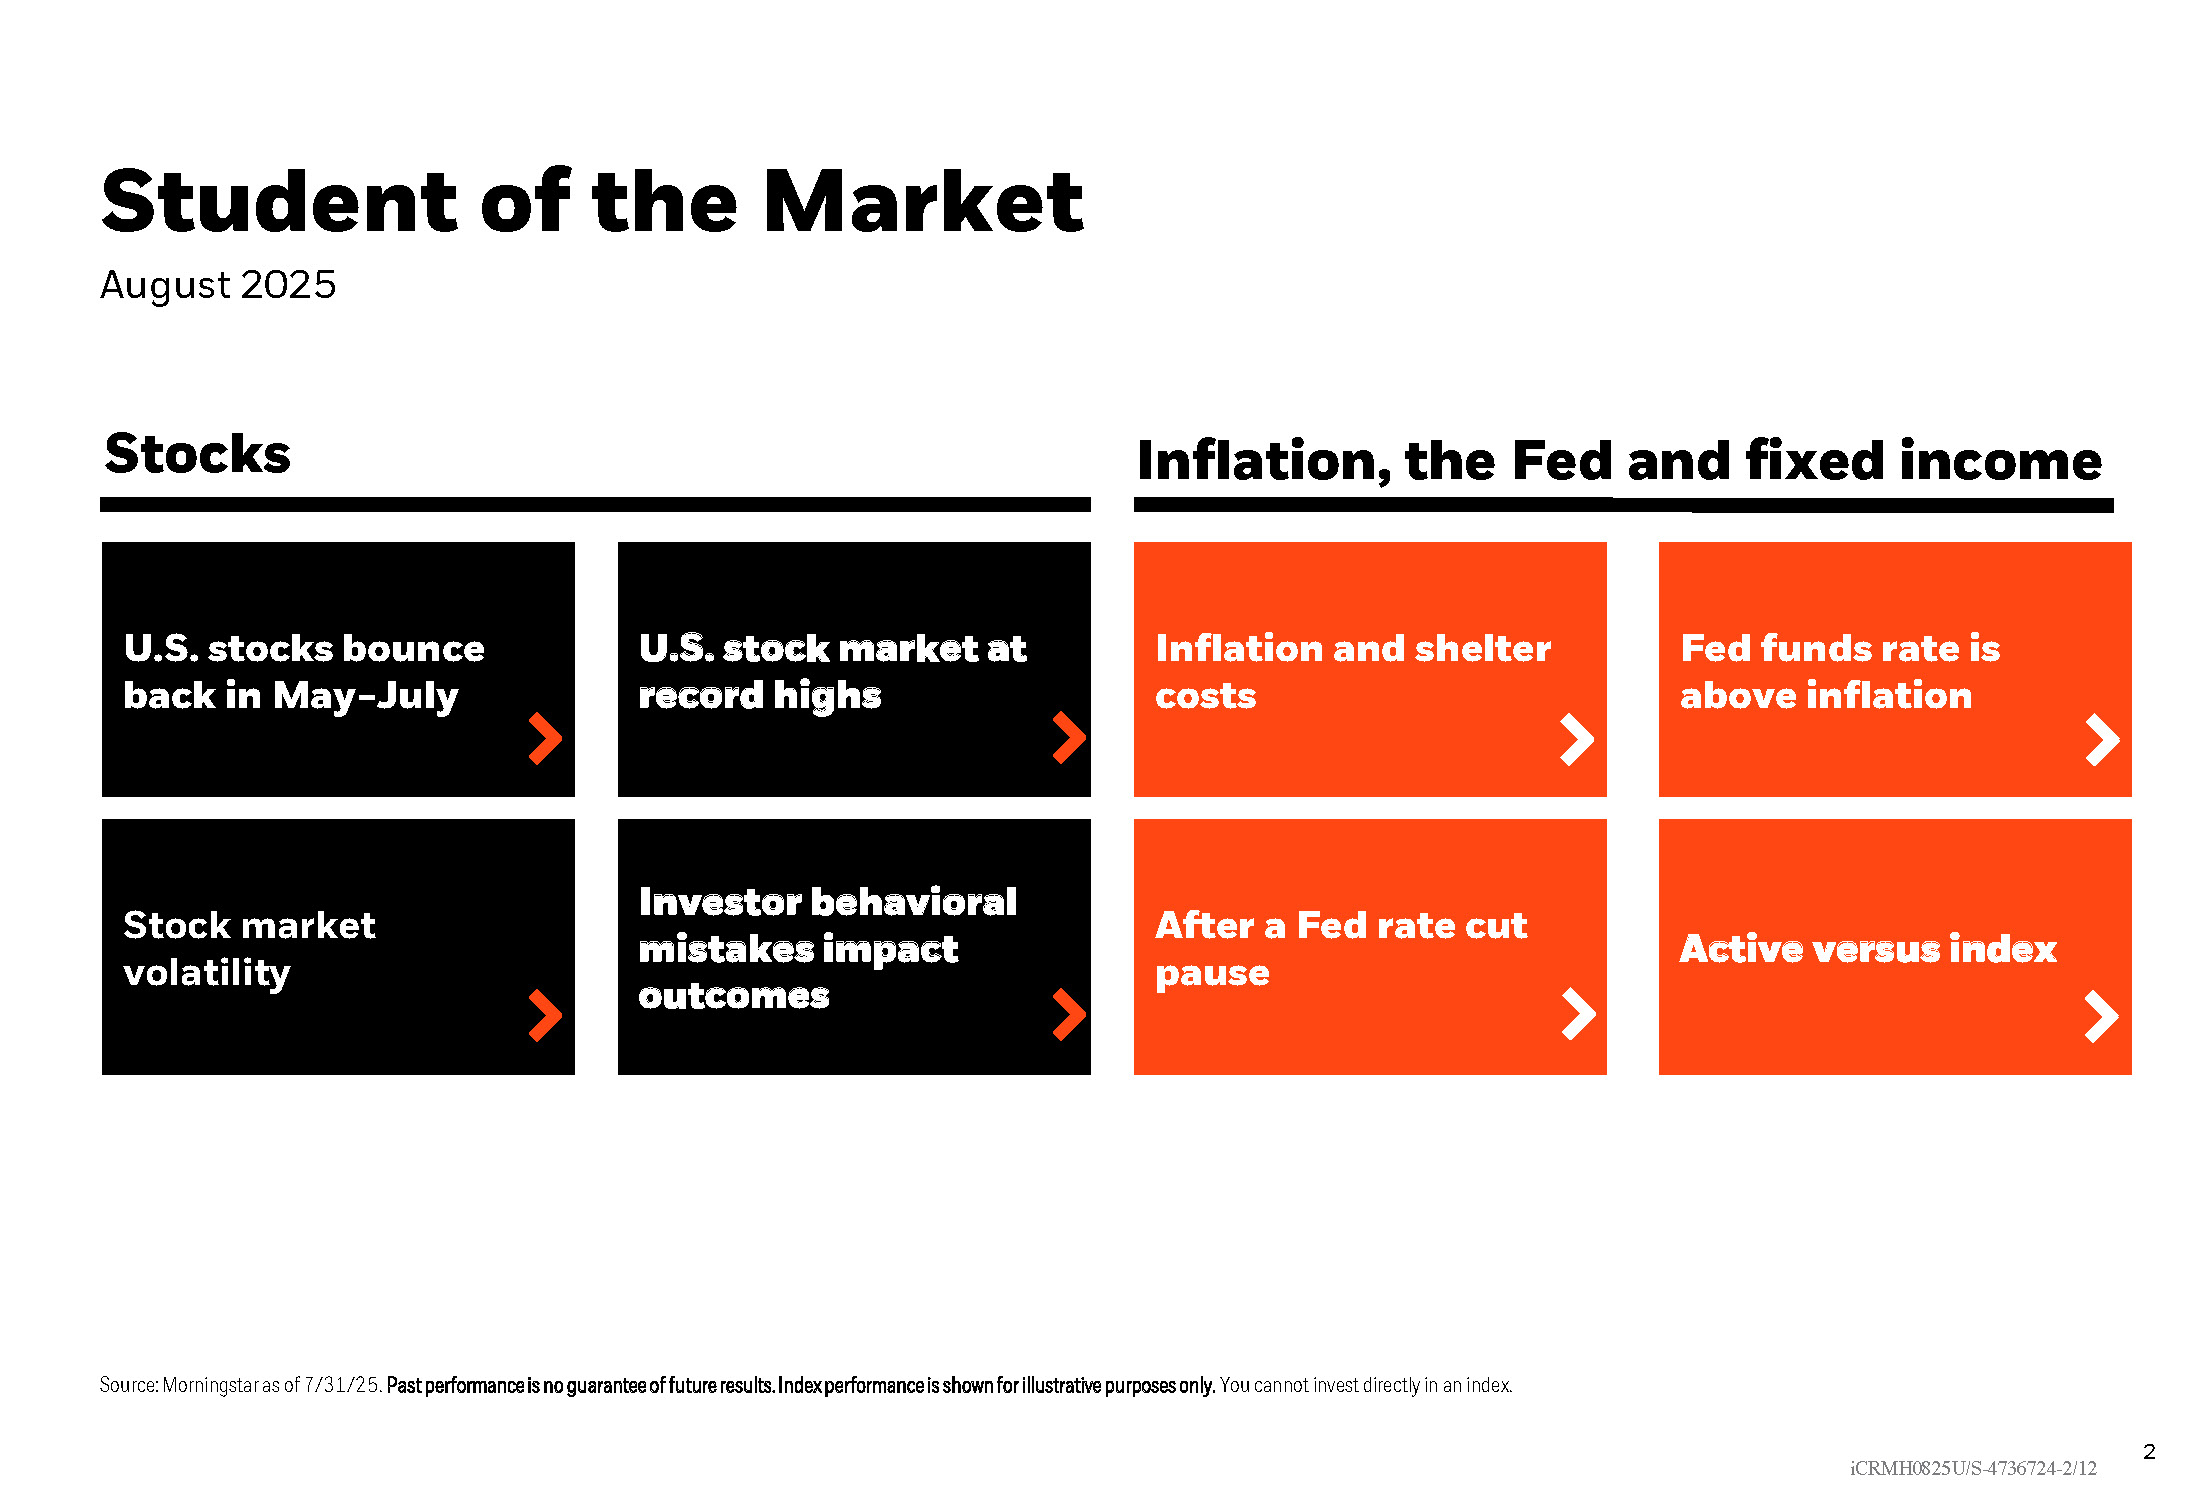
How well do U.S. stocks perform after hitting an all-time high? View recent and historical trends. We also look at the impact of higher volatility on economic growth. Finally, a review of active management and how stocks and bonds performed in their respective indices.

August 26, 2025
Title slide for a financial presentation
Important Disclosure: Content on our website and in our newsletters is for informational purposes only. The information provided may (or may not) directly apply to your situation. We recommend that readers work directly with a professional advisor when making decisions in the context of their specific situation.

International Stocks Still Lead in 2025

Other content you may like

  • NOV Student of the Market

    Historic Stock and Bond Streaks

    November 29, 2023
    Is there potentially peak pessimism for bonds? Check out past stats for losing streaks for stocks and bonds, as well as long-term bond returns and starting interest rates. Take a look to see how not all stocks within the S&P500 are the same and find the historic sweet spots for stock and bond returns during a Fed pause.
    Read this Article
  • 5 Practical Steps to Build an Emergency Fund

    July 26, 2024
    An emergency fund is a foundational piece of sound financial planning. Today’s world is unpredictable. The reality of important unexpected expenses can create significant financial stress. Here are 5 practical steps to help you build a financial safety net.
    Read this Article
  • How to Help Aging Parents

    How to Help Aging Parents

    November 30, 2021
    Preparing for the potential decline of financial capacity to manage your finances in your own best interest, is as important as planning for long-term-care expenses or keeping your estate plan up to date. This article gives practical steps to prepare and plan ahead.
    Read this Article
  • Market Performance and a Recession Indicator

    Market Performance and a Recession Indicator

    December 1, 2022
    U.S. stocks historically average 10% per year but rarely do they finish a year at that level. See the difference between the average annual return and what happened to stocks YTD in 2022 by looking at the range of returns for stocks by the full calendar year. A quick glance at the most reliable recession indicator and how alternative asset classes do better when the return on “cash” is higher. Plus stats on market performance.
    Read this Article
  • The link you have selected is located on another server. The linked site contains information that has been created, published, maintained, or otherwise posted by institutions or organizations independent of this organization. We do not endorse, approve, certify, or control any linked websites, their sponsors, or any of their policies, activities, products, or services. We do not assume responsibility for the accuracy, completeness, or timeliness of the information contained therein. Visitors to any linked websites should not use or rely on the information contained therein until they have consulted with an independent financial professional. Please click “Continue to Link” to leave this website and proceed to the selected site.
    phone-handset