Call Our Office
(559) 384-2900 | Fresno
Your Money
Your Life
Your Way
You are now leaving the Strong Valley Wealth & Pension, LLC ("Strong Valley") website. By clicking on the "Schwab Alliance Access" link below you will be entering the Charles Schwab & Co., Inc. (“Schwab”) Website. Schwab is a registered broker-dealer, and is not affiliated with Strong Valley or any advisor(s) whose name(s) appears on this Website. Strong Valley is/are independently owned and operated. Schwab neither endorses nor recommends Strong Valley. Regardless of any referral or recommendation, Schwab does not endorse or recommend the investment strategy of any advisor. Schwab has agreements with Strong Valley under which Schwab provides Strong Valley with services related to your account. Schwab does not review the Strong Valley website(s), and makes no representation regarding the content of the Website(s). The information contained in the Strong Valley website should not be considered to be either a recommendation by Schwab or a solicitation of any offer to purchase or sell any securities.
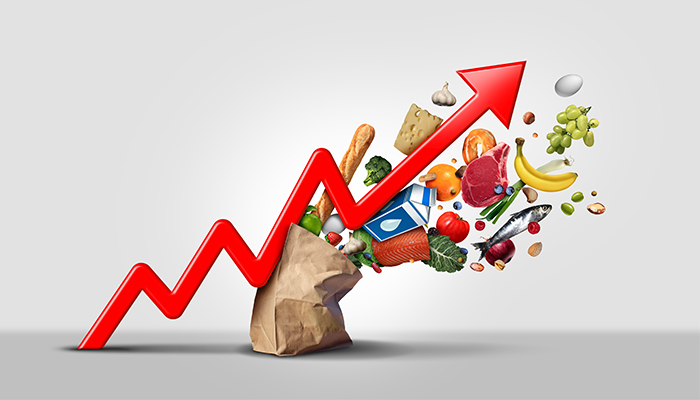
Your long-term retirement strategies must account for inflation, which decreases the purchasing power of your money in the future. With inflation appearing to go up every single month in 2021 and 2022, it’s important to consider the historical averages and record highs to create a good plan. There are ways that you can prepare for a decrease in the purchasing power of your dollar over time.
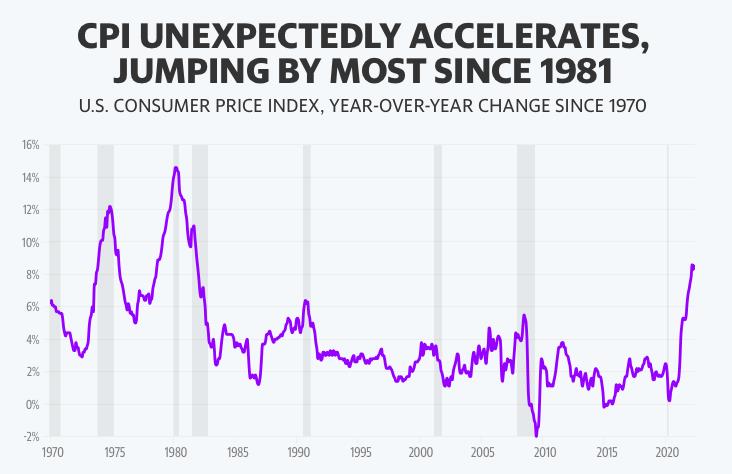
On Friday, June 10th, the U.S. Bureau of Labor Statistics reported that the Consumer Price Index for All Urban Consumers increased 1.0% in May after rising 0.3% in April. Worse, over the past 12 months, the Consumer Price Index increased 8.6%.
According to BLS, “the increase was broad-based, with the indexes for shelter, gasoline, and food being the largest contributors. After declining in April, the energy index rose 3.9% over the month with the gasoline index rising 4.1% and the other major component indexes also increasing. The food index rose 1.2% in May as the food at home index increased 1.4%.” Further:
On a 12-month basis:
Inflation in the United States has averaged around 3.3% from 1914 until 2022, but it reached an all-time high of 23.70% in June 1920 and a record low of -15.80% in June 1921.
Most will remember the high inflation rates of the 70s and early 80s when inflation hovered around 6% and occasionally reached double-digits. But so far in 2021 and 2022, inflation seems to have gone up every single month – which you no doubt already know – because you’re feeling it.
Inflation decreases the purchasing power of your money in the future and unfortunately, many don’t factor inflation into their retirement plans.
Consider this: at 3% inflation, $100 today will be worth $67.30 in 20 years – a loss of 1/3 its value.
Said another way, that same $100 will only buy you $67.30 worth of goods and services in 20 years. And in 35 years? Well your $100 will be reduced to just $34.44.
Therefore, it is imperative that your long-term retirement strategies account for inflation and
that you prepare for a decrease in the purchasing power of your dollar over time. You should strongly consider assuming that inflation will be more than 3% – its historical average.
It’s true that inflation today hovers over 8% – quadruple the Federal Reserve’s target inflation rate – but a better assumption might be one based on the last 100-years of data.
If you’re wrong and you find that the inflation rate for the next 25 years turns out to be 2%, then the purchasing power of your retirement savings will be more, not less.
Your financial advisor can create models with various inflation scenarios so you can better understand – and account for – inflation’s true impact to your retirement.