Call Our Office
(559) 384-2900 | Fresno
(619) 480-1413 | San Diego
(619) 480-1413 | San Diego
Your Money
Your Life
Your Way
You are now leaving the Strong Valley Wealth & Pension, LLC ("Strong Valley") website. By clicking on the "Schwab Alliance Access" link below you will be entering the Charles Schwab & Co., Inc. (“Schwab”) Website. Schwab is a registered broker-dealer, and is not affiliated with Strong Valley or any advisor(s) whose name(s) appears on this Website. Strong Valley is/are independently owned and operated. Schwab neither endorses nor recommends Strong Valley. Regardless of any referral or recommendation, Schwab does not endorse or recommend the investment strategy of any advisor. Schwab has agreements with Strong Valley under which Schwab provides Strong Valley with services related to your account. Schwab does not review the Strong Valley website(s), and makes no representation regarding the content of the Website(s). The information contained in the Strong Valley website should not be considered to be either a recommendation by Schwab or a solicitation of any offer to purchase or sell any securities.
Every four years, Washington D.C. and Wall Street converge as Americans elect a president and Wall Street tries to figure out what the outcome means for the stock and bond markets. And since so many hypotheses on this topic abound, it’s hard to keep track of them all.
But what if we ranked the best and worst presidents simply by the performance of the stock market? Surely that would settle the debate as to which president was best for investors, right? Well, while it sounds easy – and the editors at Kiplinger did rank presidents from worst to best according to the stock market – there are a few big caveats to consider.
Every four years, Washington D.C. and Wall Street converge as Americans elect a president and Wall Street tries to figure out what the outcome means for the stock and bond markets. And since so many hypotheses on this topic abound, it’s hard to keep track of them all.
For example, there are those who swear that Wall Street performs better when:
But what if we ranked the best and worst presidents simply by the performance of the stock market? Surely that would settle the debate as to which president was best for investors, right? Well, while it sounds easy – and the editors at Kiplinger did rank presidents from worst to best according to the stock market – there are a few big caveats to consider.
Caveat #1: Since the Office of the President was established in 1789, America has had 44 different presidents. And just three years later, Wall Street was officially founded on May 17, 1792 with the signing of the Buttonwood Agreement. But for the most part,
there really was no “stock market” until the late 1800s, meaning it doesn’t make sense to include the first 22 presidents. So this analysis starts with the election of 1888.
Caveat #2. The Dow Jones Industrial Average was first published on May 26, 1896 and it followed the 12 largest companies in each sector. Today, it tracks 30 companies. The other very commonly-used index – the S&P 500 – although introduced in 1957 it does track data back to the late 1920s. The editors of Kiplinger decided to use the S&P 500 from President Hoover to the present and the DJIA for earlier.
Caveat #3. Returns do not include dividends. Over the last few decades, dividends have become a smaller component of total returns, so not including dividends will tend to favor more recent presidents.
Caveat #4. Data is not adjusted for inflation. This will tend to help presidents of inflationary times (Carter and Ford) and hurt presidents of deflationary times (Hoover and Bush).
Final Caveat. This one is sure to spark heated debate, but it seems fair to not include President Trump on this list simply because his presidency is still going.
#1 of 22
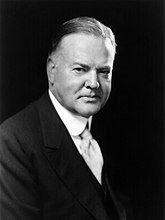
President Herbert Hoover, Republican
Is it any surprise that President Hoover, who took office just a few months before the Stock Market Crash of 1929 that led to the worst bear market in history, would be the worst in terms of stock market performance? It’s not bad enough that Hoover presided over an annualized compound loss of 30.8%, but the cumulative loss of 77.1% is astoundingly awful.
After his landslide win in 1928, Hoover said in his inaugural address that: “I have no fears for the future of our country. It is bright with hope.”
Then just seven months later, on October 24, 1929, the world witnessed the beginning of the Stock Market Crash of 1929, which brought Black Monday, when the DJIA dropped 13% in a single day.
#2 of 22
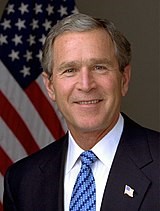
President George W. Bush, Republican
George W. Bush did not come into office after the Stock Market Crash of 1929 and the Great Depression, but he did come into office after the Dot.com boom of the 1990s and presided during the September 11th terrorist attacks, the Iraq War and the 2008 mortgage crisis.
While there were some good years from 2003 through 2007, many might remember when Bush visited the New York Stock Exchange on January 31, 2007 and gave a speech deriding excessive executive compensation.
Little did anyone know at the time that in less than a year, investors would experience one of the worst bear markets in history stretching from October 2007 through March 2009 when the S&P 500, DJIA and NASDAQ all lost more than 50%.
#3 of 22
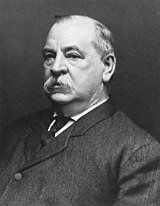
President Grover Cleveland, Democrat
Stephen Grover Cleveland was the 22nd and 24th president of the United States, the only president in history to serve two non-consecutive terms in office (1885 – 1889 and 1893 – 1897). But his second presidency will be remembered for the third worst in history, measured by stock market performance.
Cleveland’s second presidential term coincided with the Panic of 1893 that ran through 1897 – the end of Cleveland’s presidency. The Panic of 1893 began with a railroad bankruptcy in February 1893 and resulted in over 500 banks closing, more than 15,000 business failing and unemployment hitting 19%.
The deep recession that followed hammered the banking system and by many accounts led to the realignment of the Democratic Party and the beginning of the Progressive Era.
#4 of 22
President Richard Nixon, Republican
President Nixon is remembered for Watergate, his resignation and the Vietnam War, but stock markets performed poorly during Nixon’s presidency too. And while losses of 3.9% a year are bad, if you factor in high inflation, then the performance looks even worse.
In addition to poor stock market performance, Nixon is also remembered for abandoning the gold standard – which meant that the U.S. would no longer convert dollars to gold at a fixed value.
Essentially killing the Bretton Woods system established in 1958, Nixon implemented a series of economic measures – now called the Nixon Shock – to help combat rising inflation. The result was even higher inflation in the 1970s and one of the worst bear markets in history from 1973 – 1974. In fact, the period from January 1973 through December 1974 saw the DJIA lose about 45% of its value.
Next week will bring Part II – and the list might surprise you.