Call Our Office
(559) 384-2900 | Fresno
Your Money
Your Life
Your Way
You are now leaving the Strong Valley Wealth & Pension, LLC ("Strong Valley") website. By clicking on the "Schwab Alliance Access" link below you will be entering the Charles Schwab & Co., Inc. (“Schwab”) Website. Schwab is a registered broker-dealer, and is not affiliated with Strong Valley or any advisor(s) whose name(s) appears on this Website. Strong Valley is/are independently owned and operated. Schwab neither endorses nor recommends Strong Valley. Regardless of any referral or recommendation, Schwab does not endorse or recommend the investment strategy of any advisor. Schwab has agreements with Strong Valley under which Schwab provides Strong Valley with services related to your account. Schwab does not review the Strong Valley website(s), and makes no representation regarding the content of the Website(s). The information contained in the Strong Valley website should not be considered to be either a recommendation by Schwab or a solicitation of any offer to purchase or sell any securities.
The Gross Domestic Product (GDP) is a number followed closely by Wall Street and economists, to determine the overall economic health of our country. This macroeconomic data is most useful when viewed through your own filters. Have you considered calculating your household’s GDP to determine your economic health?
As stock markets continue to reach new highs, we’re bombarded with economic data that seemingly points to why the markets will continue their march forward – or why they will retreat this fall. Consider some recent data-headlines:
While much of this economic data can prove useful as guideposts to your investing plans, wouldn’t it be more useful if the data was specific to you?
For example, do you care (as much) that average housing prices have jumped double-digits over the past year if you have no intention of moving for another 10 years? Probably not.
Maybe it would be more helpful to receive macroeconomic data through your personal filters, so you could use that data to inform your investing decisions and retirement planning?
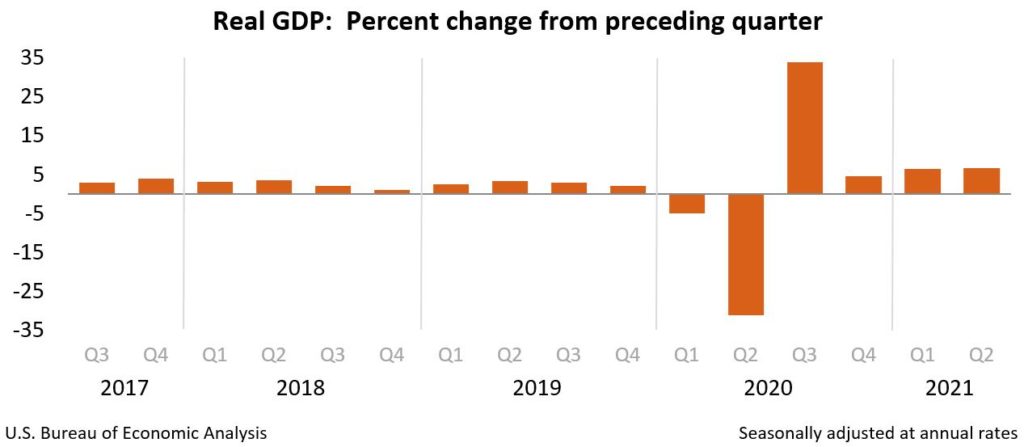
On August 26th, the Bureau of Economic Analysis reported that real gross domestic product (GDP) increased at an annual rate of 6.6% in the second quarter of 2021. But do you truly know what that “real GDP” means?
In very simple terms, the GDP of a country is an estimate of the total value of all the goods and services it produced during a specific period, usually a quarter or a year. It can be calculated by adding up all of the money spent by consumers, businesses, and government in a certain period (it may also be calculated by adding up all of the money received by all the participants in the economy). That number is called "nominal GDP" and once adjusted to remove any effects due to inflation, then we have the "real GDP.”
The real GDP is a number followed closely by Wall Street and economists as it represents a very broad measure of our country’s overall production and serves as a very comprehensive metric of the overall economic health of our country.
But seeing that GDP for the second quarter stood at $22.7 trillion might not be as useful to most of us, so it is often best used as a point of comparison from previous periods.
In other words, did our nation’s economy grow or contract compared to the previous quarter or year? (Relative to the first quarter of the year, our economy grew more – 6.6% versus 6.3%).
While GDP is a useful measure of our nation’s economic health, have you considered calculating your household’s GDP?
Here is an explanation of the recent increase in GDP from the Bureau of Economic Analysis:
“The increase in real GDP in the second quarter reflected increases in personal consumption expenditures (PCE), nonresidential fixed investment, exports, and state and local government spending that were partly offset by decreases in private inventory investment, residential fixed investment, and federal government spending. Imports, which are a subtraction in the calculation of GDP, increased.
The increase in PCE reflected increases in services (led by food services and accommodations) and goods (led by "other" nondurable goods, notably pharmaceutical products, as well as clothing and footwear). The increase in nonresidential fixed investment reflected increases in intellectual property products (led by research and development as well as software) and equipment (led by transportation equipment). The increase in exports reflected an increase in goods (led by nonautomotive capital goods) and services (led by travel). The decrease in private inventory investment was led by a decrease in retail trade inventories. The decrease in federal government spending primarily reflected a decrease in nondefense spending on intermediate goods and services. In the second quarter, nondefense services decreased as the processing and administration of Paycheck Protection Program loan applications by banks on behalf of the federal government declined.”
Calculating your household’s GDP on a quarterly or yearly basis – and comparing it to the previous quarter or year – might be a useful exercise for you to determine the economic health of your household.
It would surely be useful as you think through your retirement goals and plans.