Article

Don't Judge Diversification on Feelings

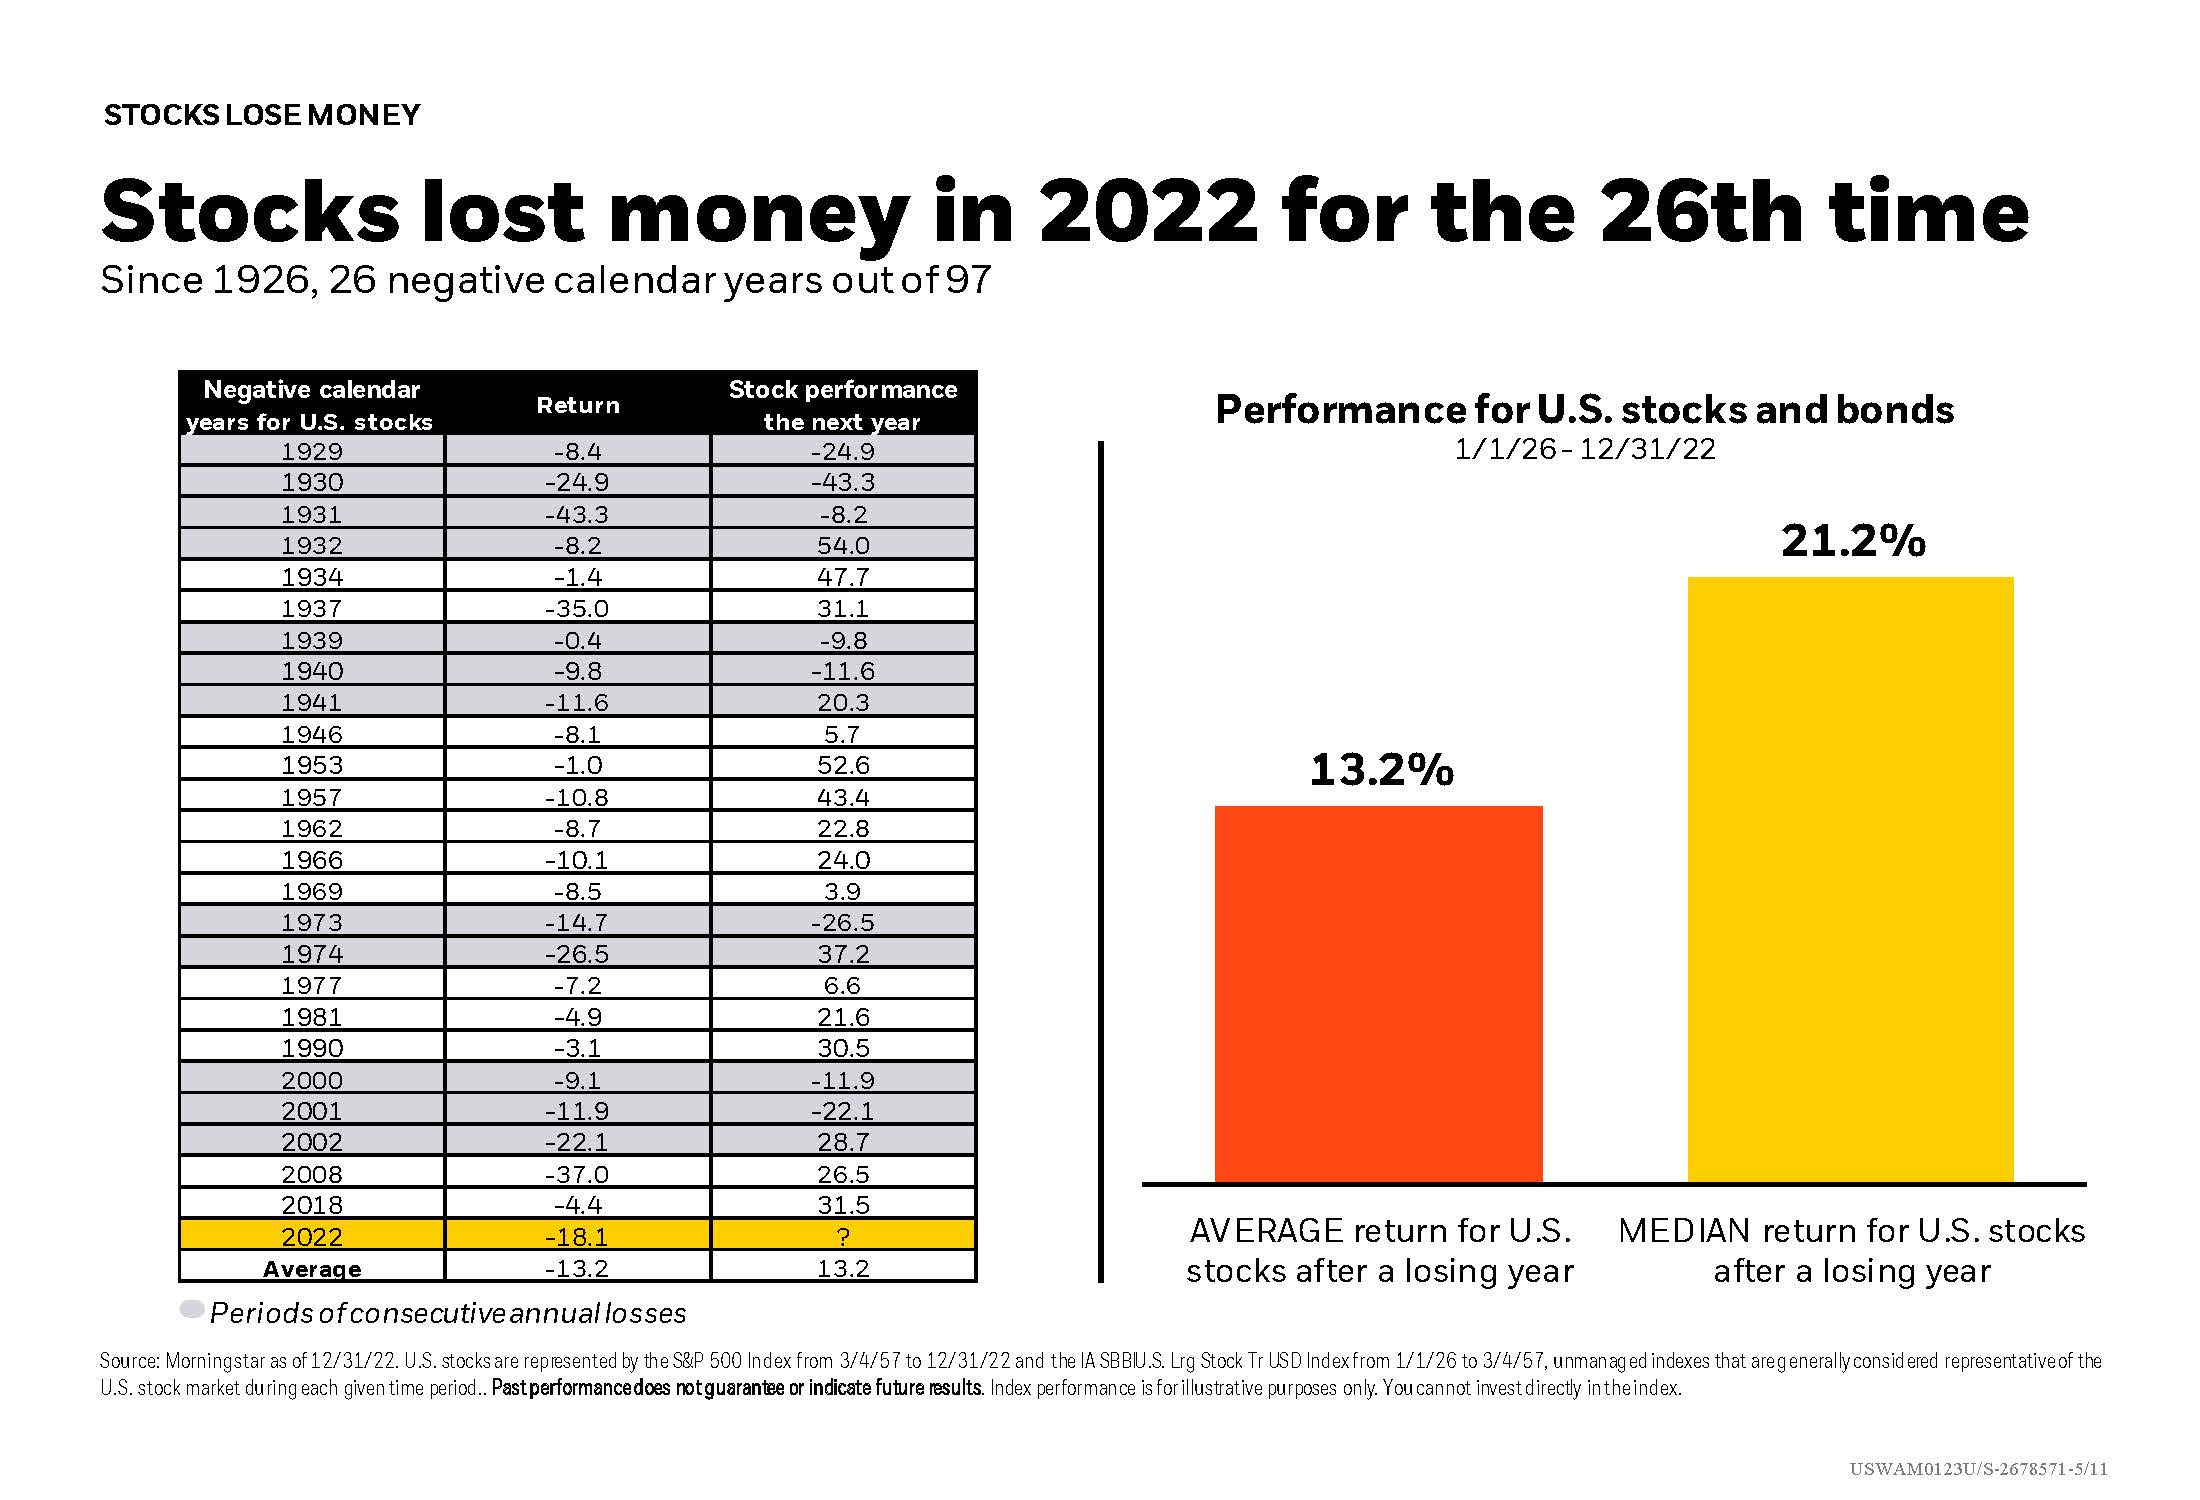
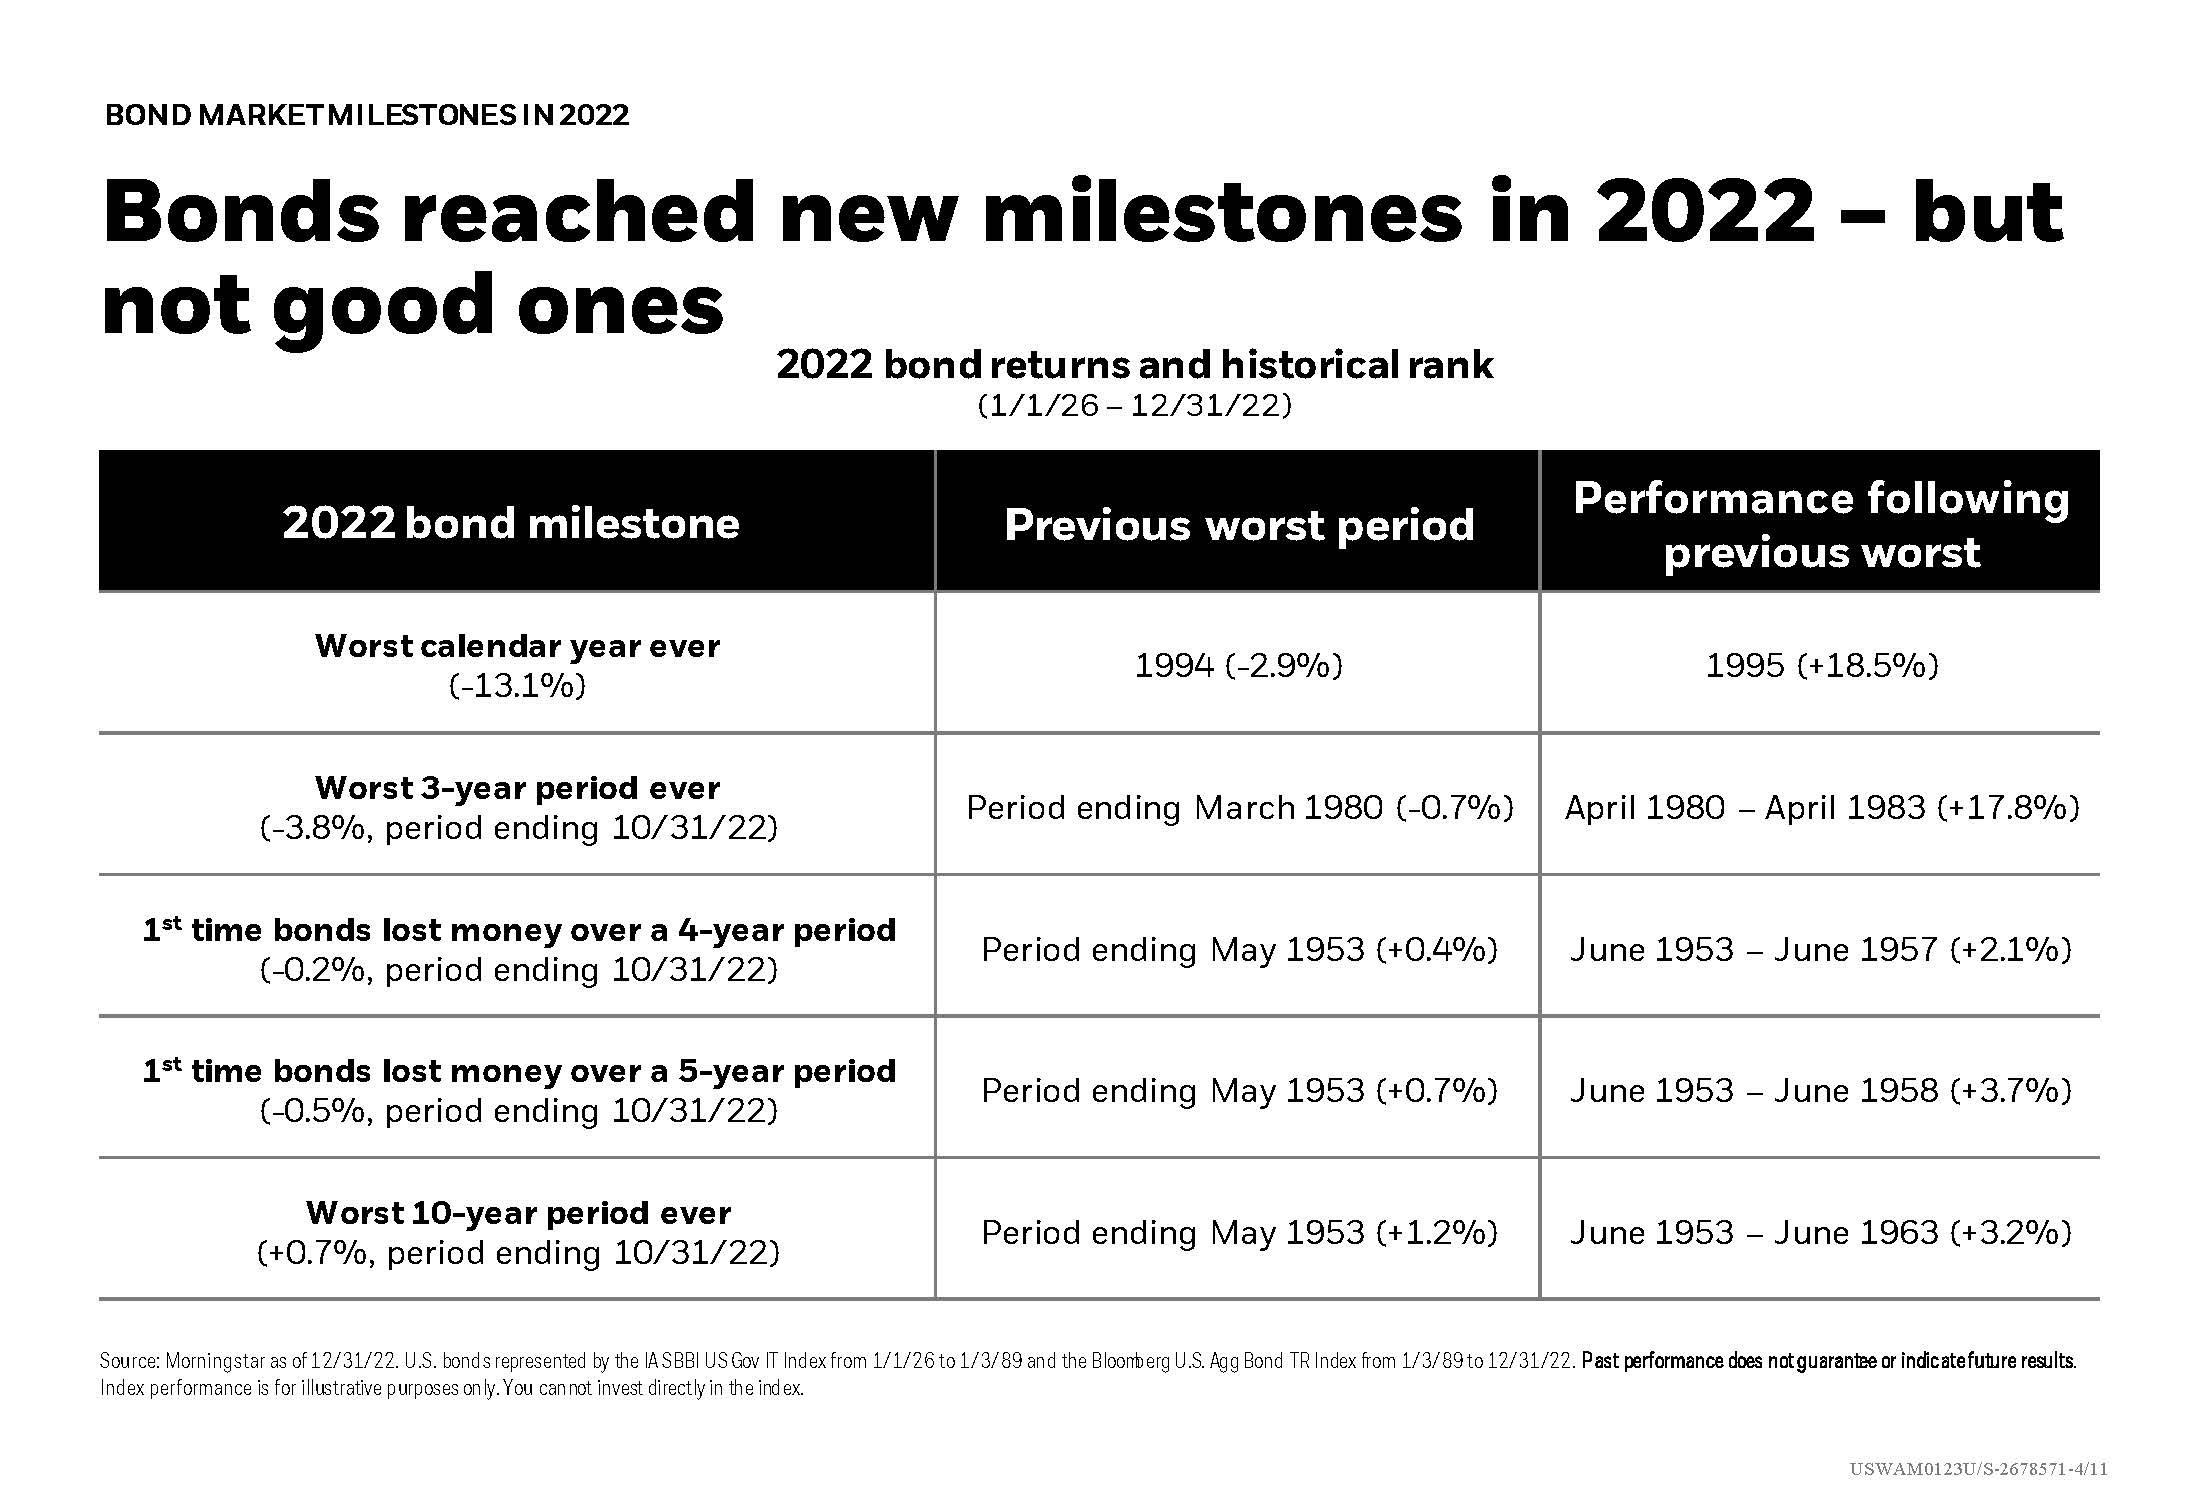
Stocks Lose Money for the 26th Time

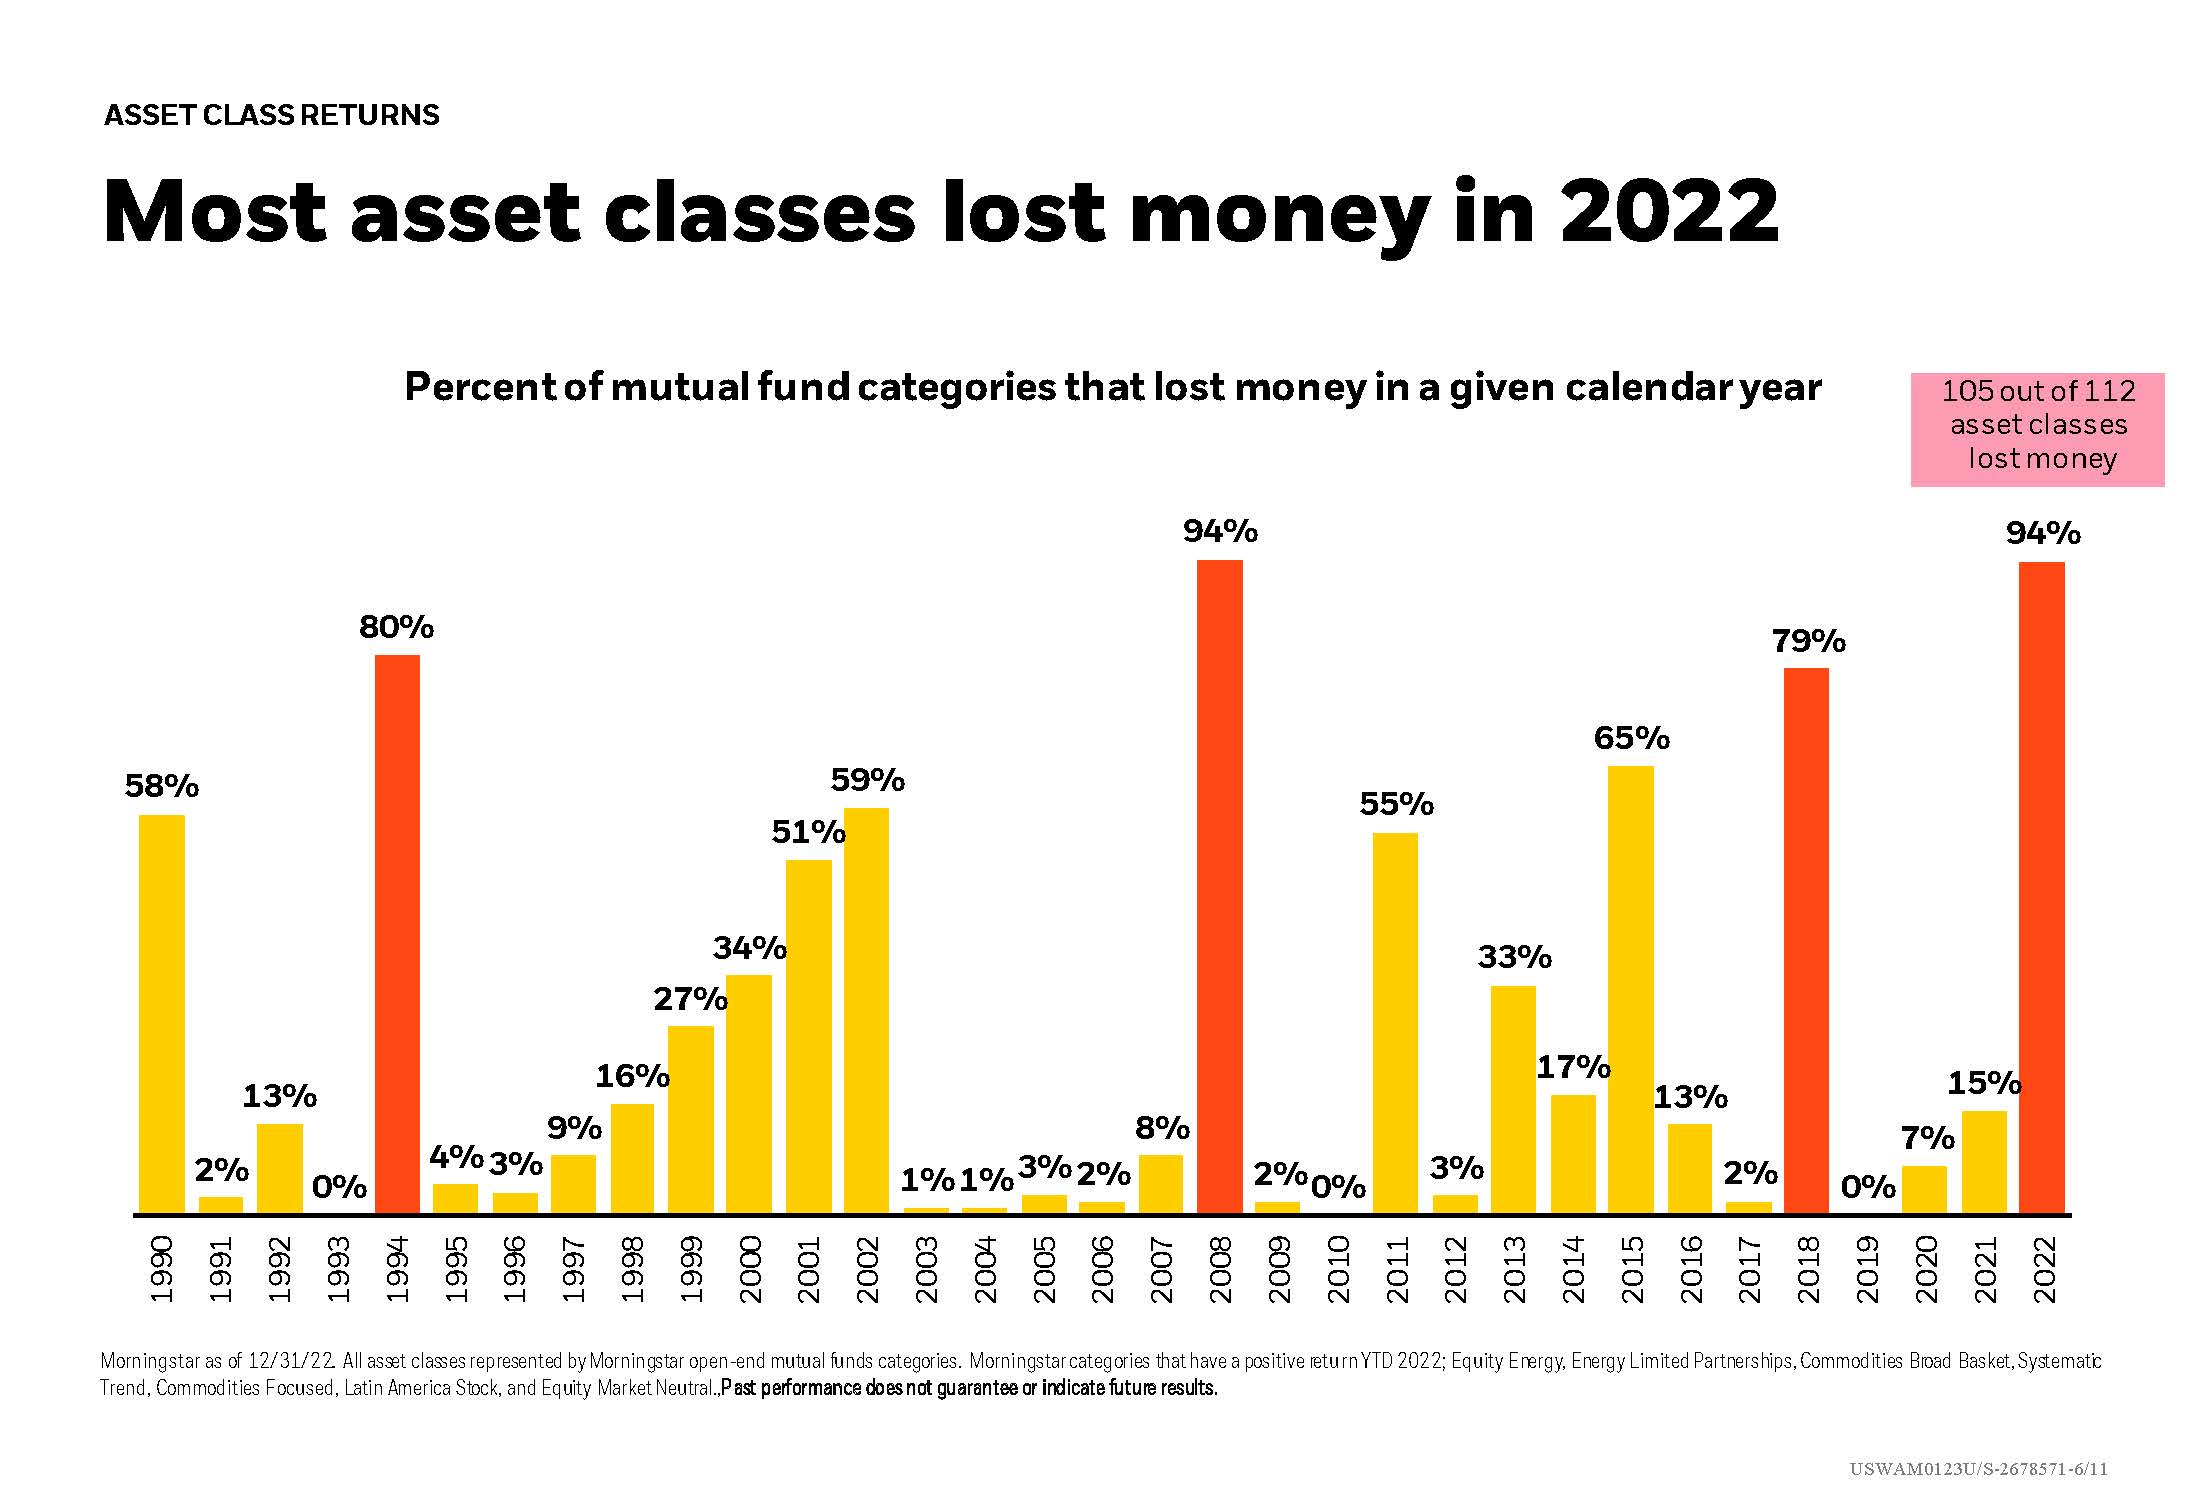
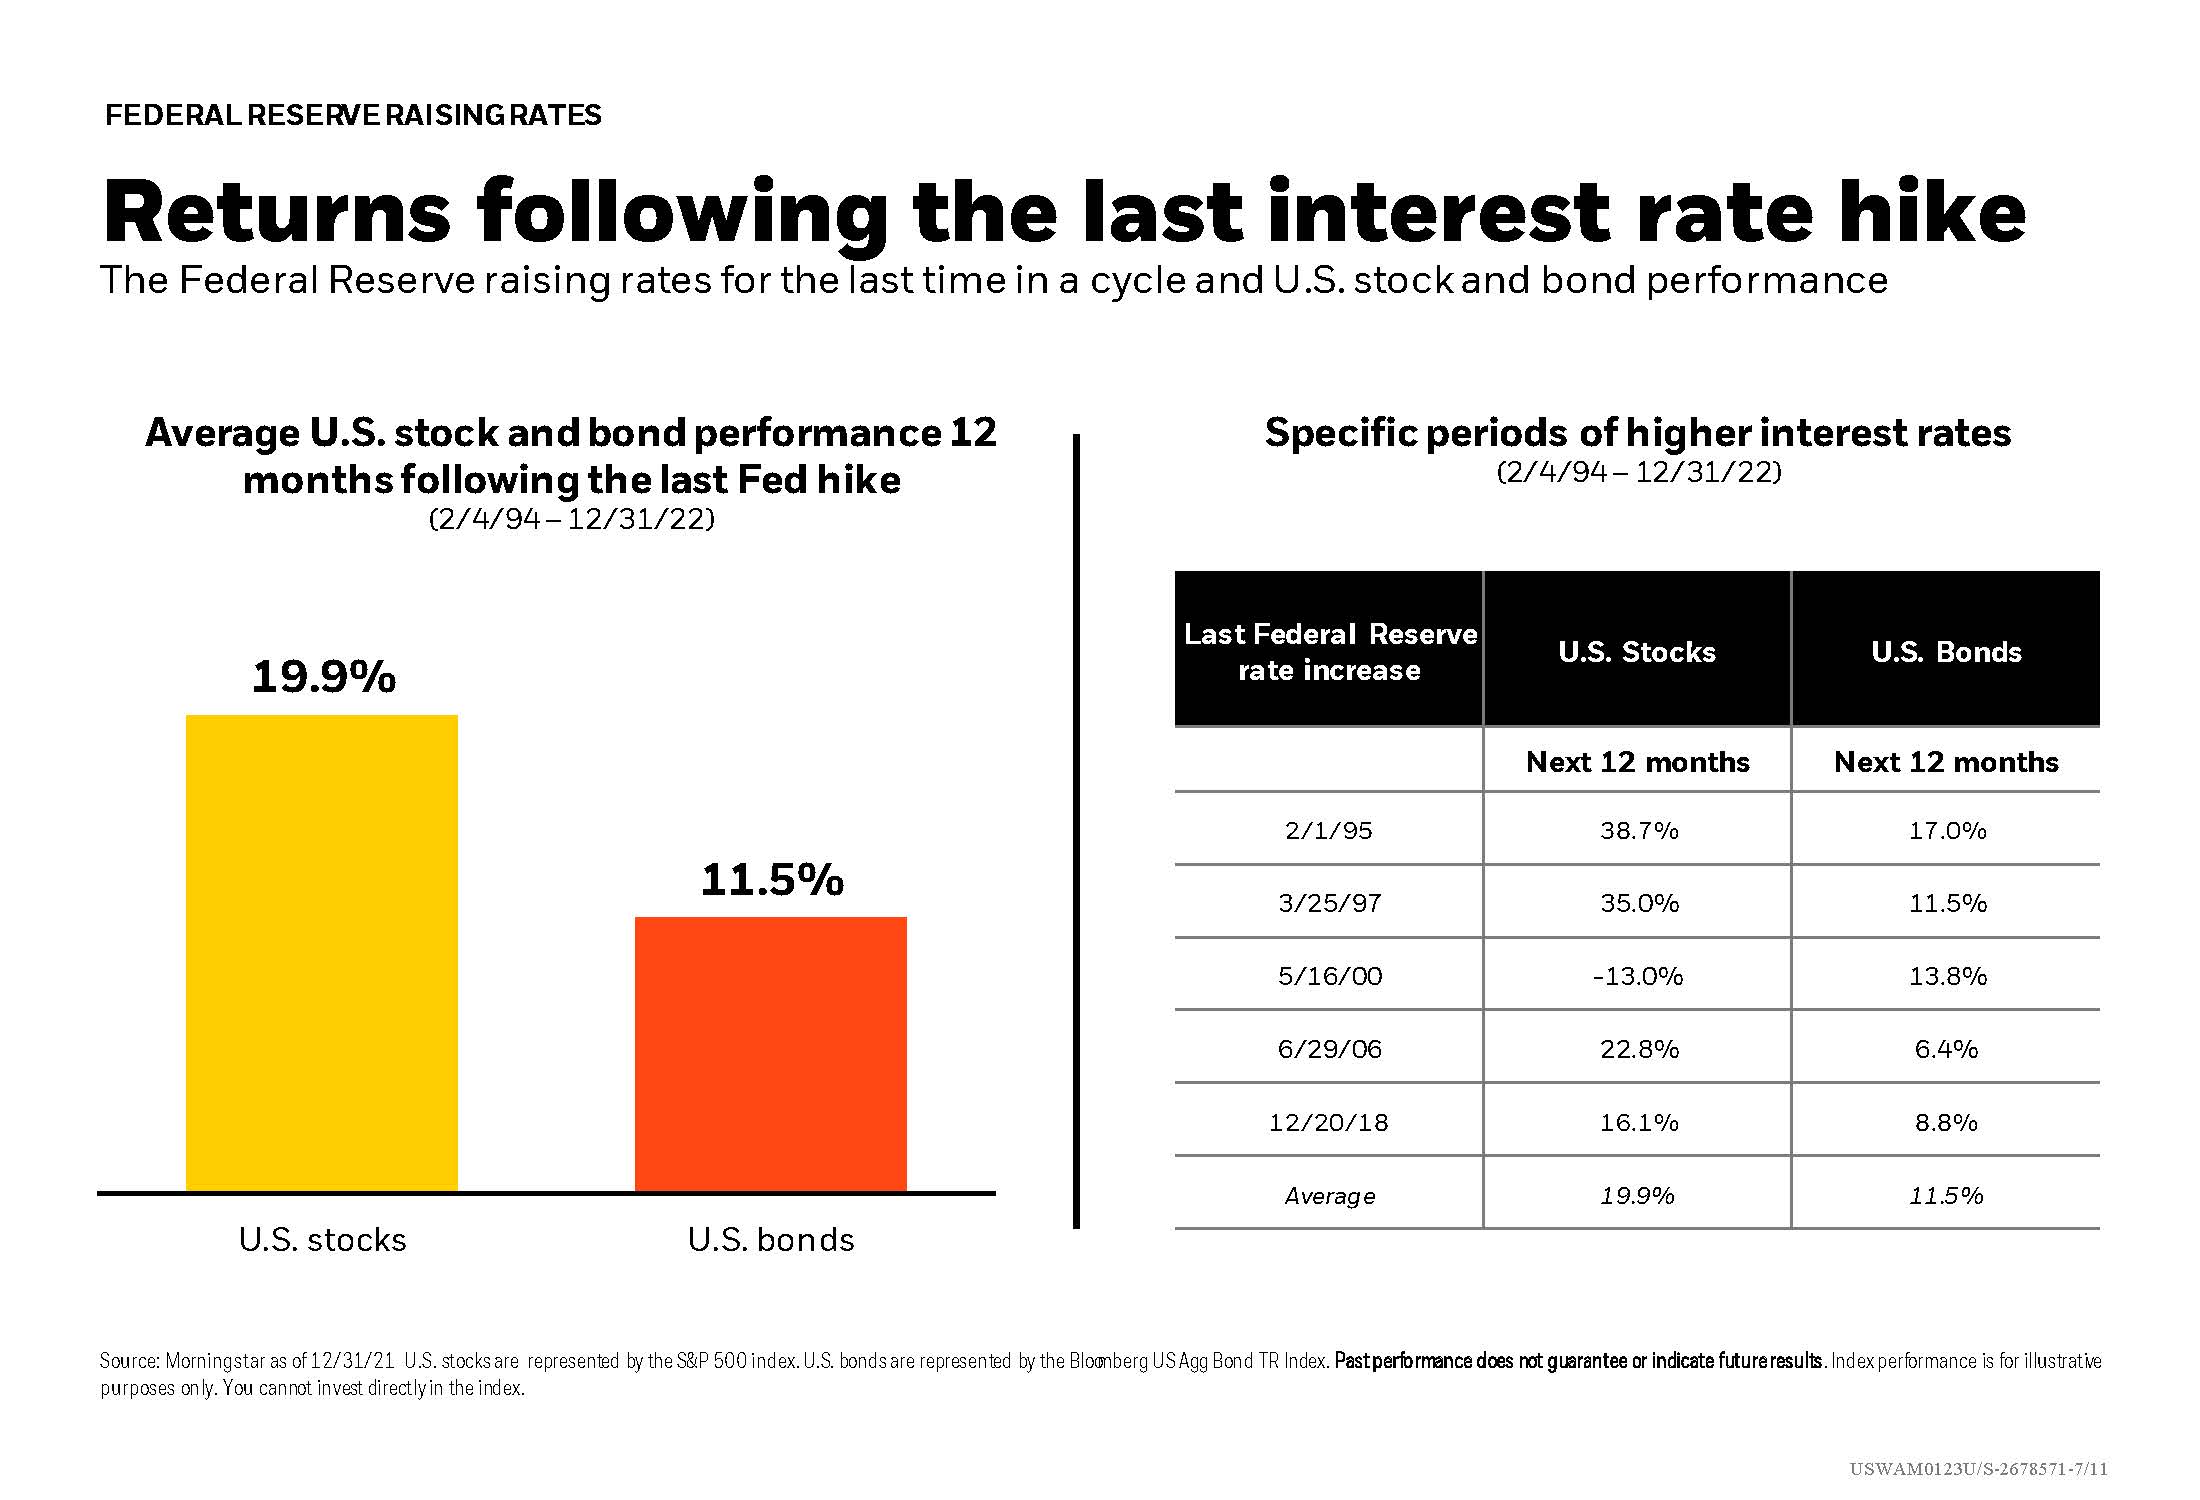
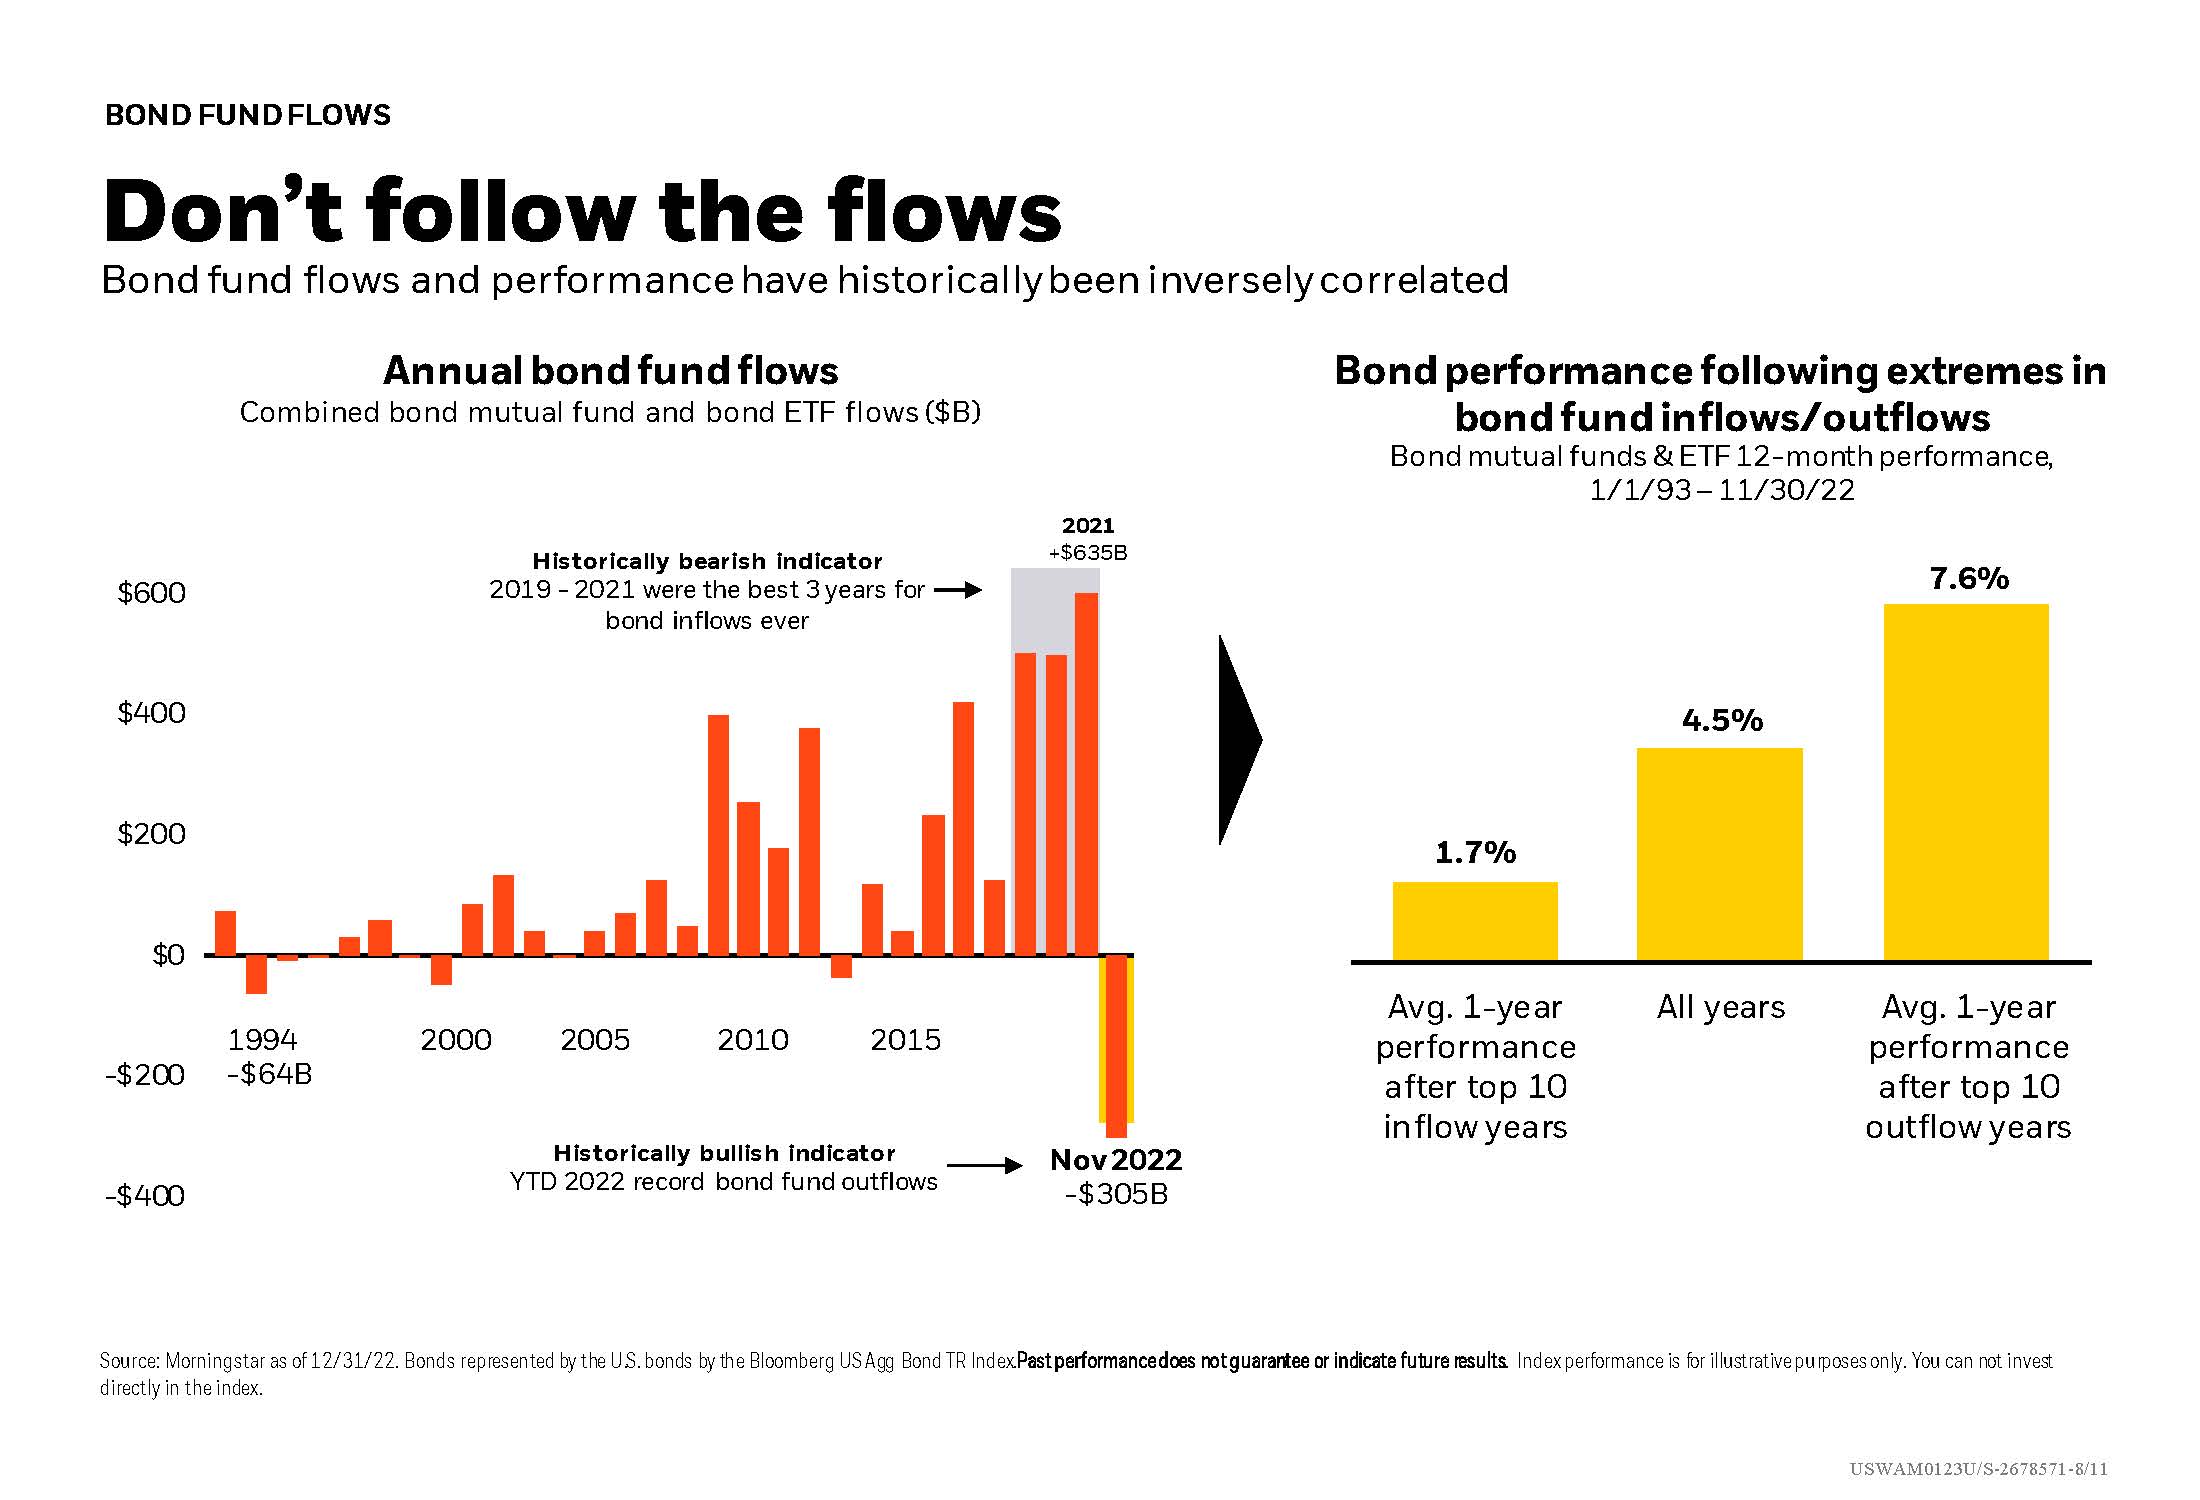
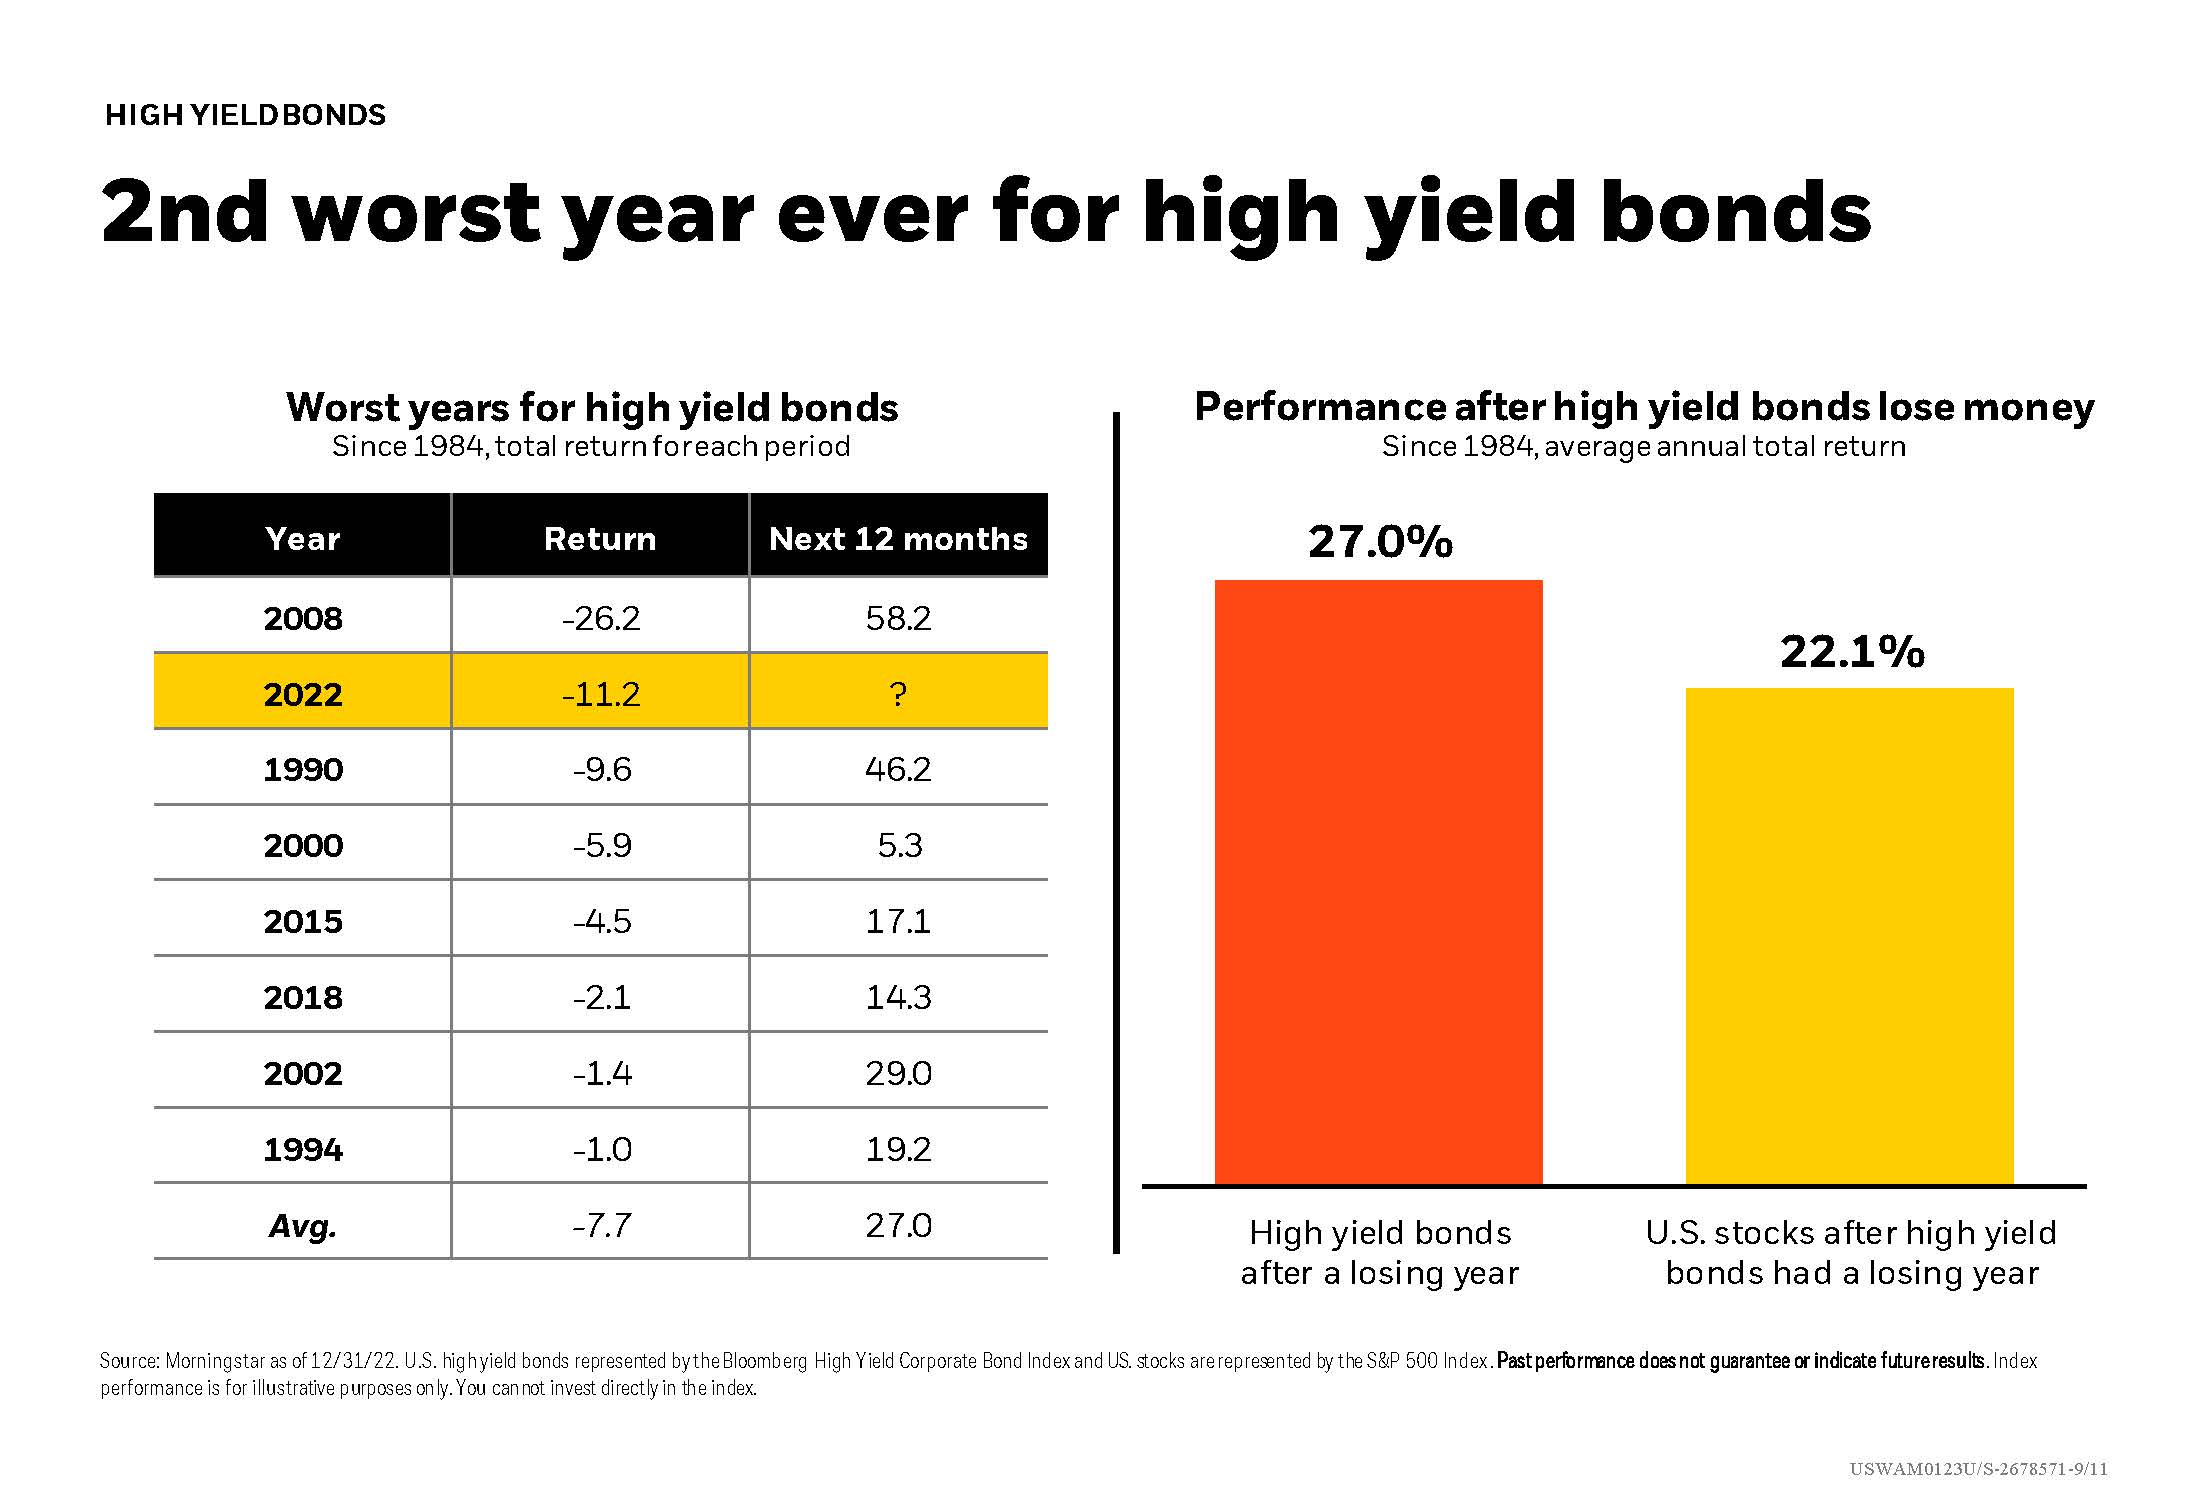
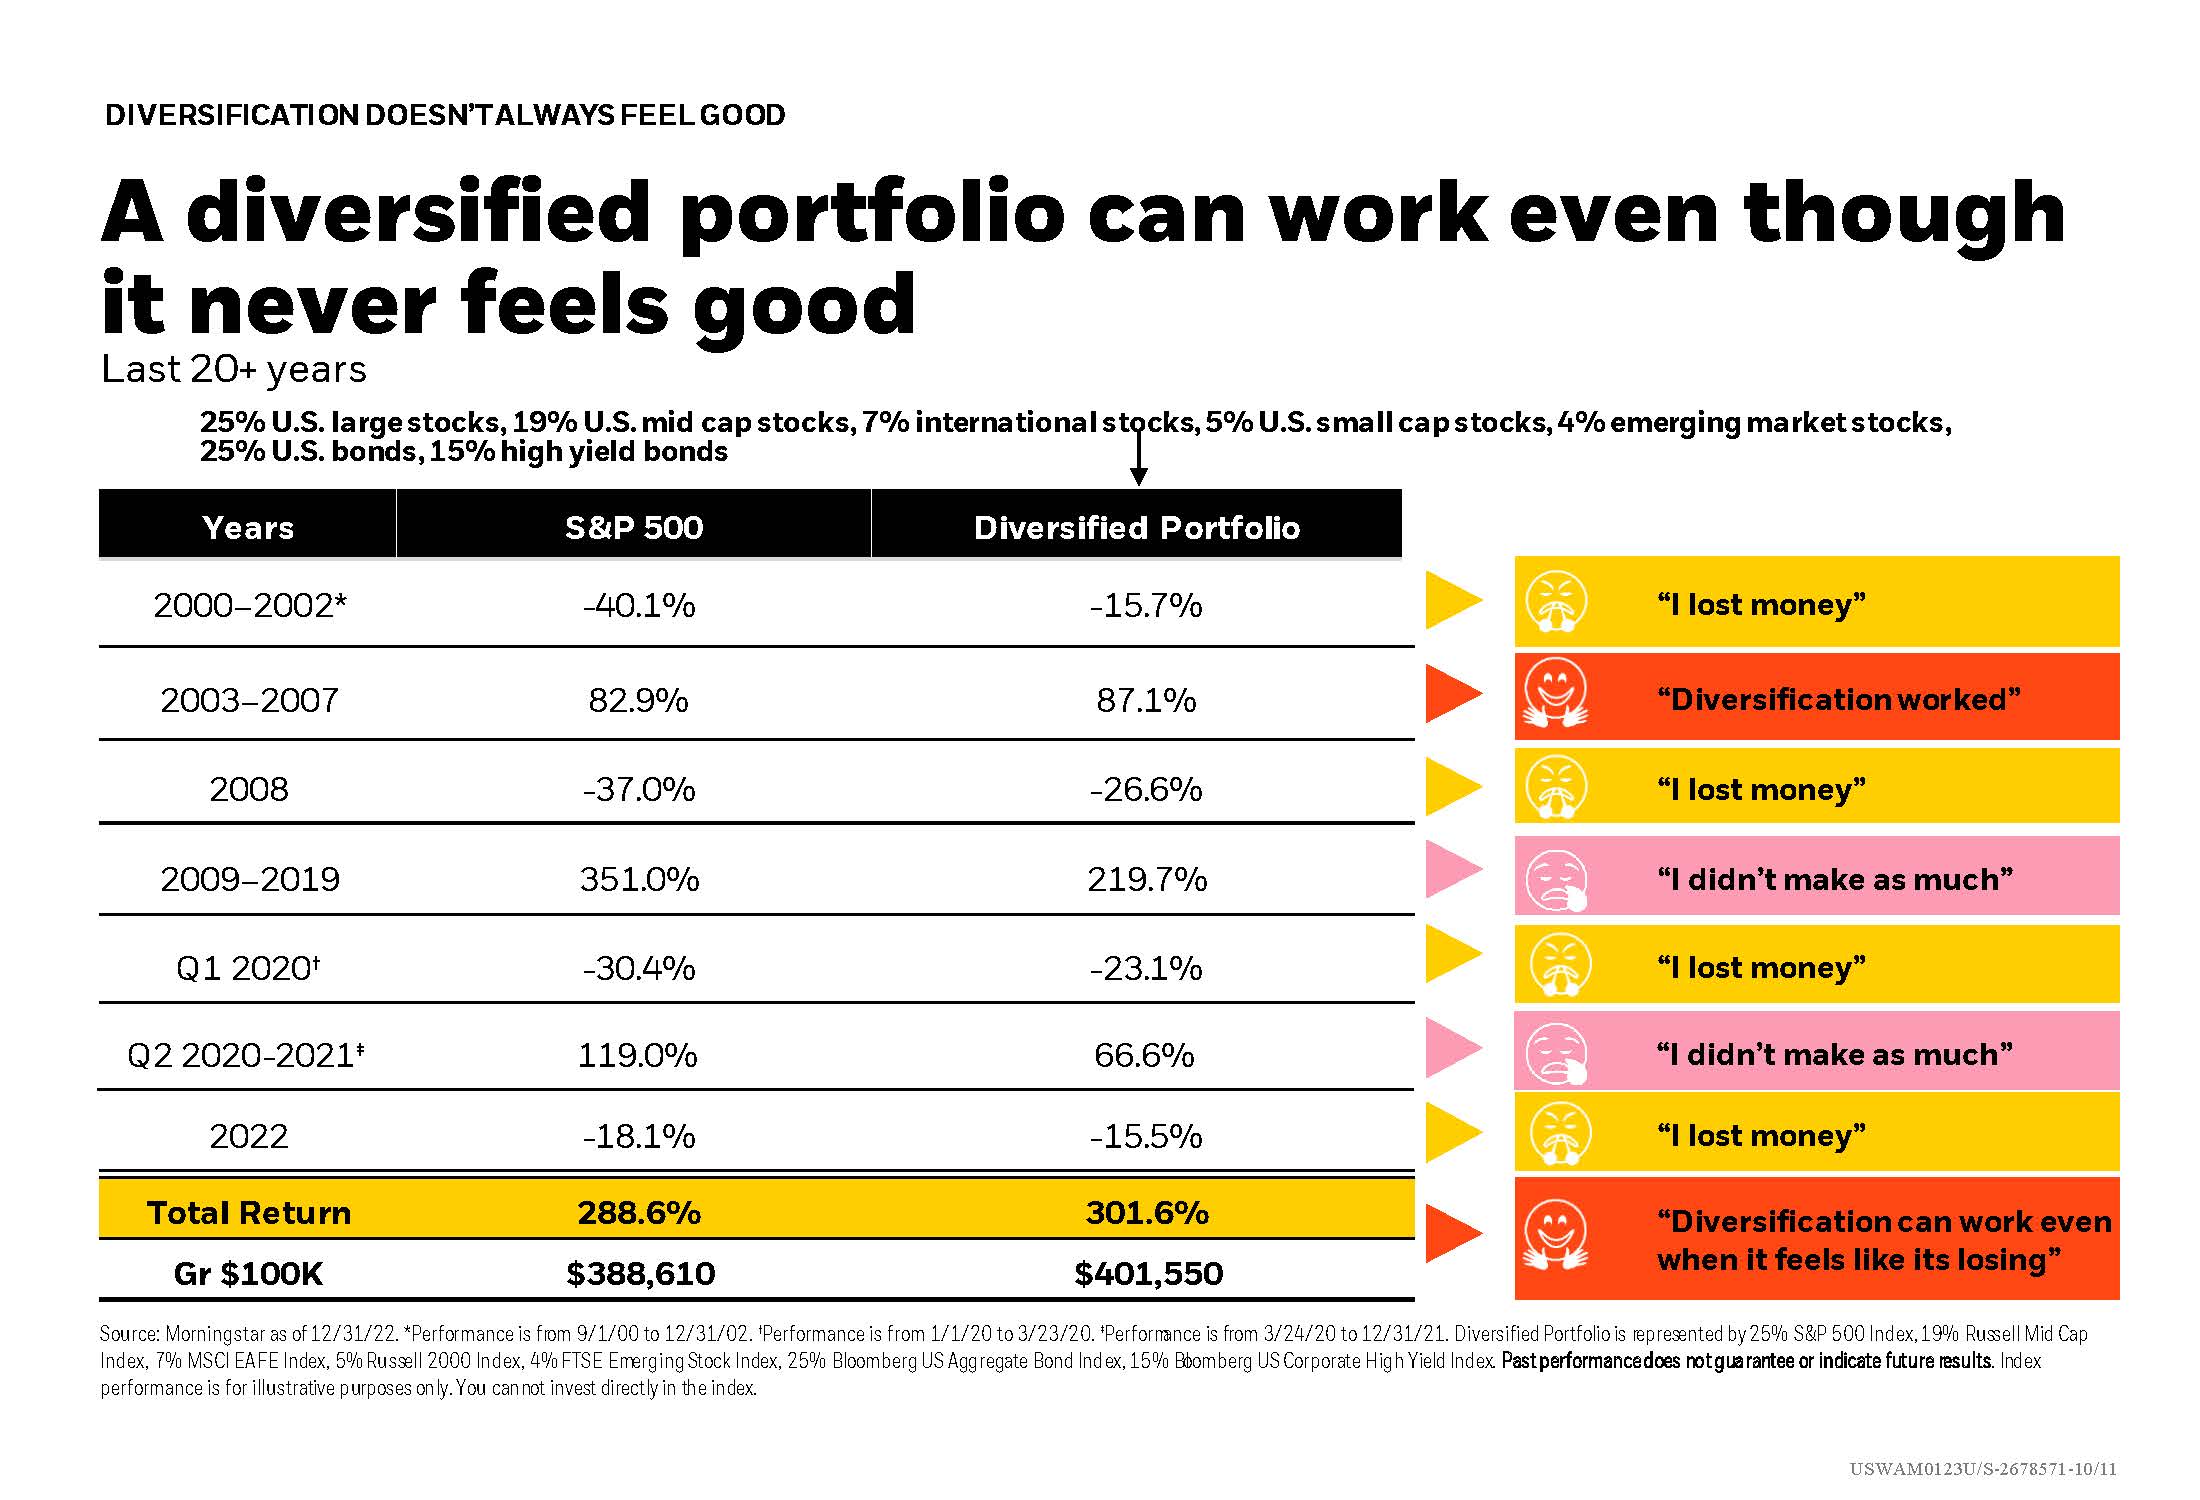
Focusing on what happened in 2022, this Student of the Market shows an overview of last year’s performance compared to similar years in the market’s history.  This may be a window into the possibilities for 2023 and the future of Federal Reserve rate hikes. Also a look at the numbers showing that even though portfolio diversification works, it doesn’t always feel good.

January 29, 2023
Stocks Lose Money for the 26th Time
Important Disclosure: Content on our website and in our newsletters is for informational purposes only. The information provided may (or may not) directly apply to your situation. We recommend that readers work directly with a professional advisor when making decisions in the context of their specific situation.

Other content you may like

  • Large Cap Stock Outperformance

    Large Cap Stock Outperformance

    August 1, 2024
    Large cap stock performance is catching up with the last big technology advancement in the 1990’s, making the 3-year outperformance of large cap stocks over small cap stocks the largest since Dec 1999. A look at stock market performance concentration showing up internationally, and a comparison of Inflation to the Fed funds rate, and more.
    Read this Article
  • Podcast Highlight 1 - Market Recap

    Podcast Highlight 4 - Market Saturation and AI

    June 3, 2024
    Discussing the inevitability of market saturation, the Strong Valley advisor team talks about how that looks, how it affects growth and how the market responds.
    Read this Article
  • A woman at a desk reviewing documents and taking notes.

    A Mid-Year Financial Review Makes Sense

    June 12, 2026
    When was the last time you completed a financial review? As we approach summer, it’s a good time to check progress on financial goals. It’s important to check tax opportunities, retirement savings and protection planning. Making small changes mid-year can help keep the plan on track!
    Read this Article
  • Market Performance and a Recession Indicator

    Market Performance and a Recession Indicator

    December 1, 2022
    U.S. stocks historically average 10% per year but rarely do they finish a year at that level. See the difference between the average annual return and what happened to stocks YTD in 2022 by looking at the range of returns for stocks by the full calendar year. A quick glance at the most reliable recession indicator and how alternative asset classes do better when the return on “cash” is higher. Plus stats on market performance.
    Read this Article
  • The link you have selected is located on another server. The linked site contains information that has been created, published, maintained, or otherwise posted by institutions or organizations independent of this organization. We do not endorse, approve, certify, or control any linked websites, their sponsors, or any of their policies, activities, products, or services. We do not assume responsibility for the accuracy, completeness, or timeliness of the information contained therein. Visitors to any linked websites should not use or rely on the information contained therein until they have consulted with an independent financial professional. Please click “Continue to Link” to leave this website and proceed to the selected site.
    phone-handset