Article

Historic Stock and Bond Streaks

NOV Student of the Market

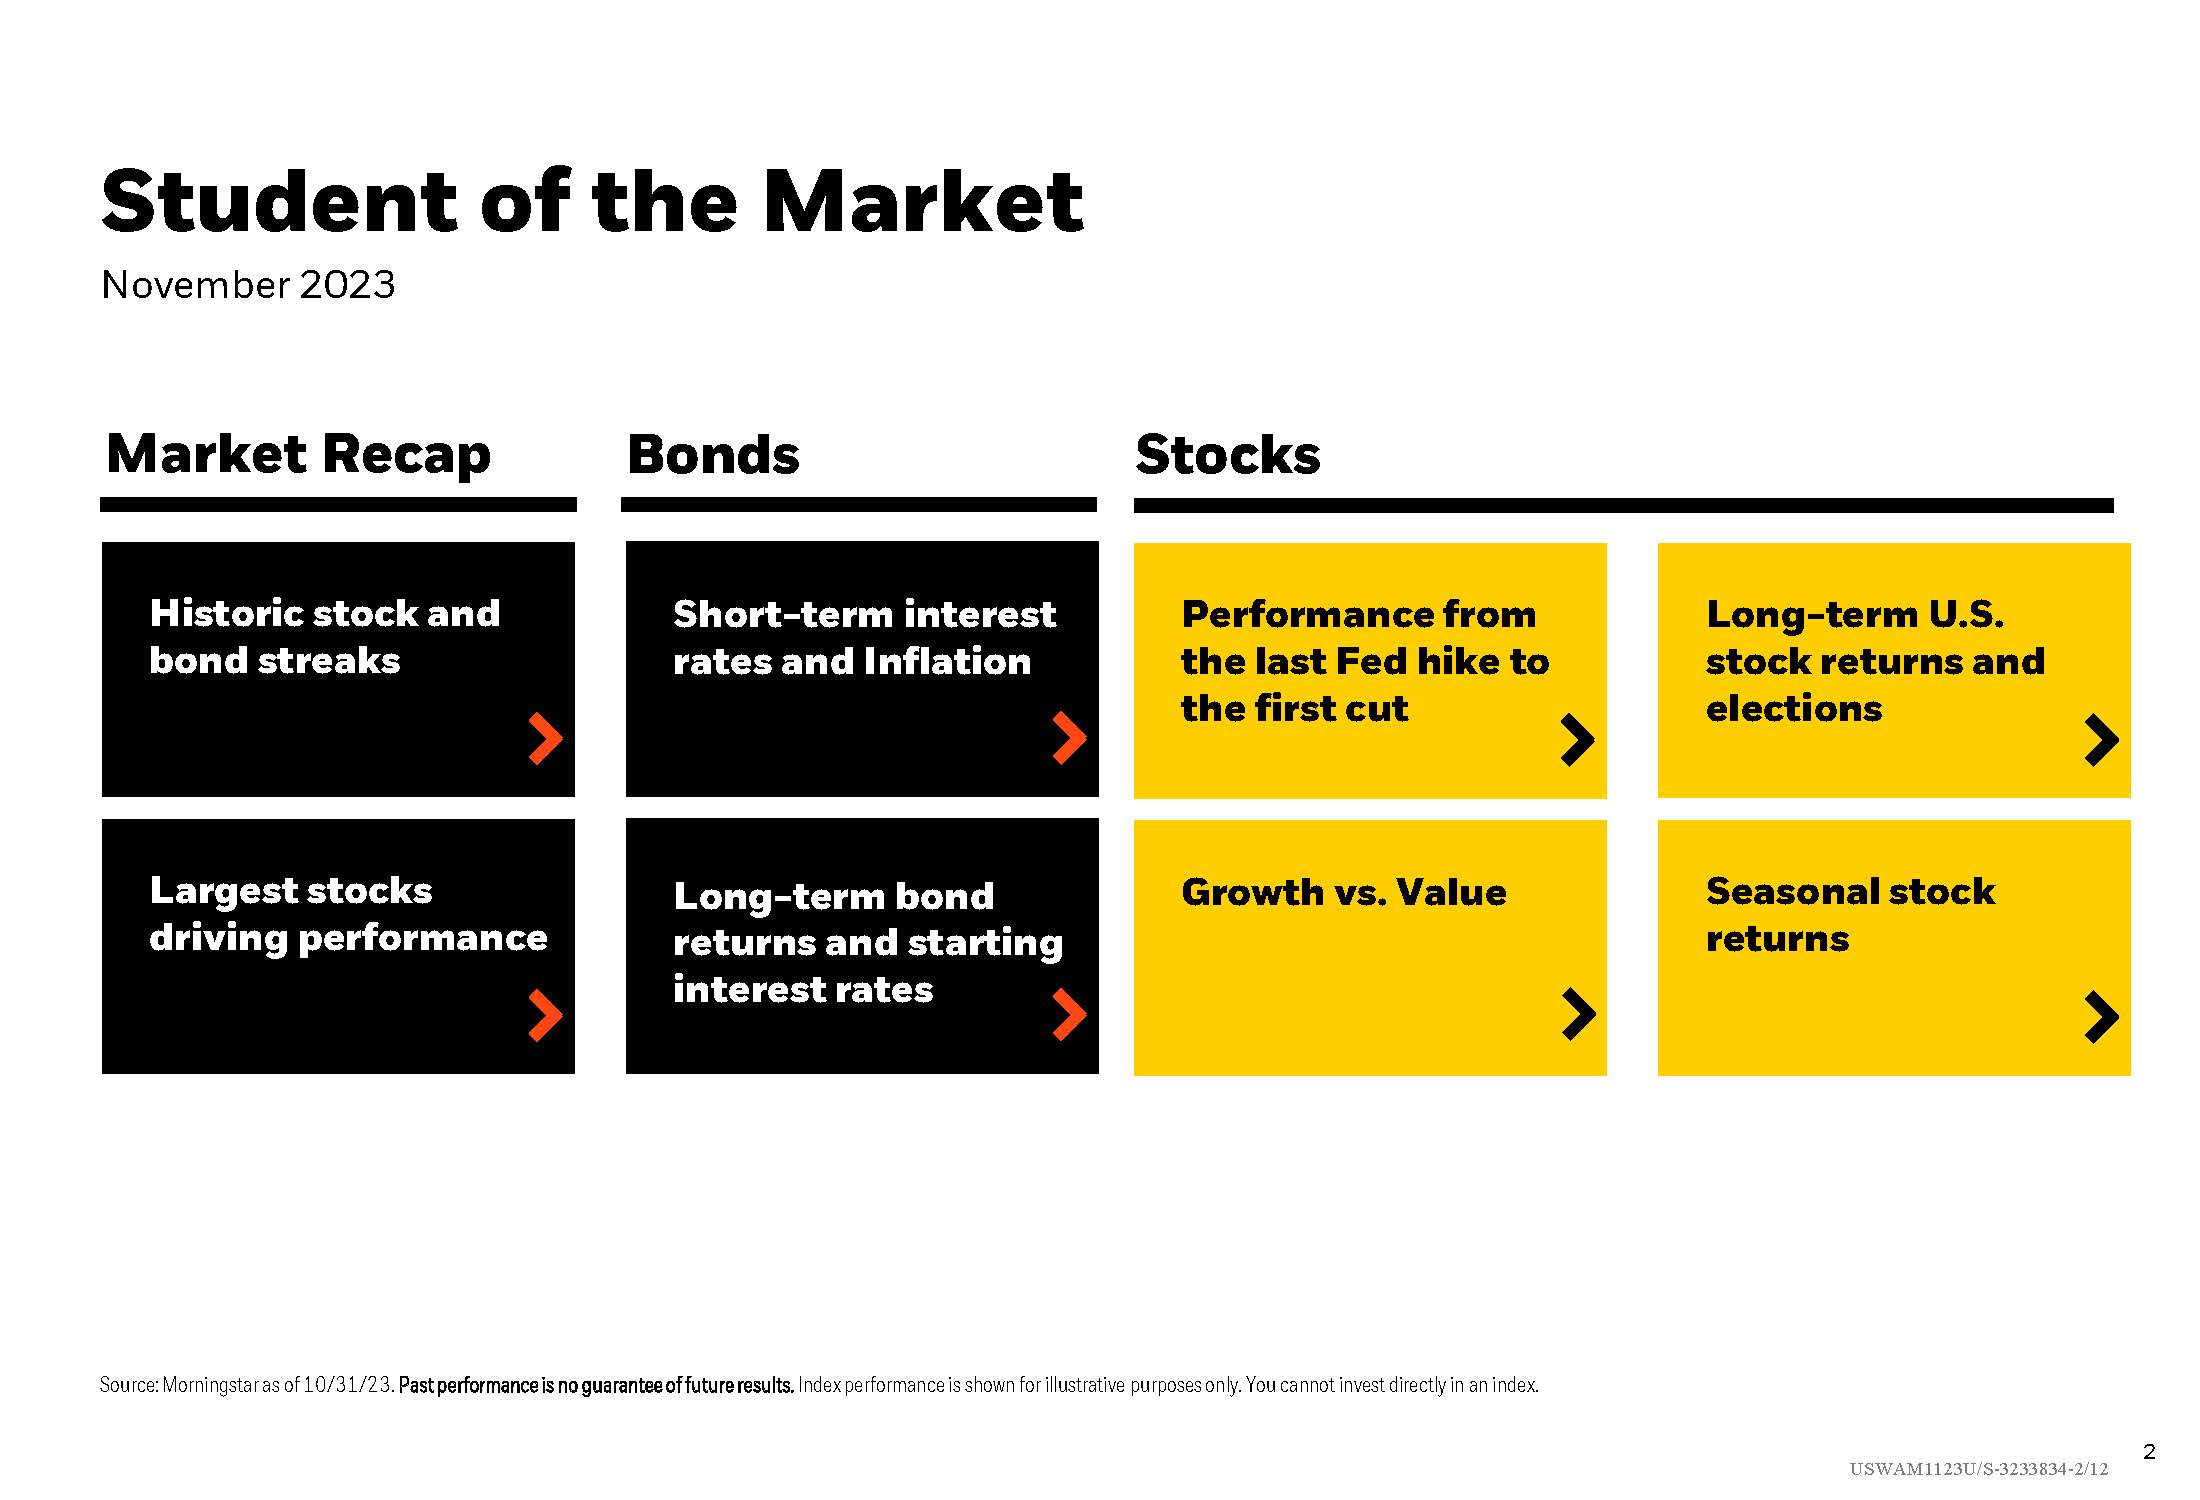
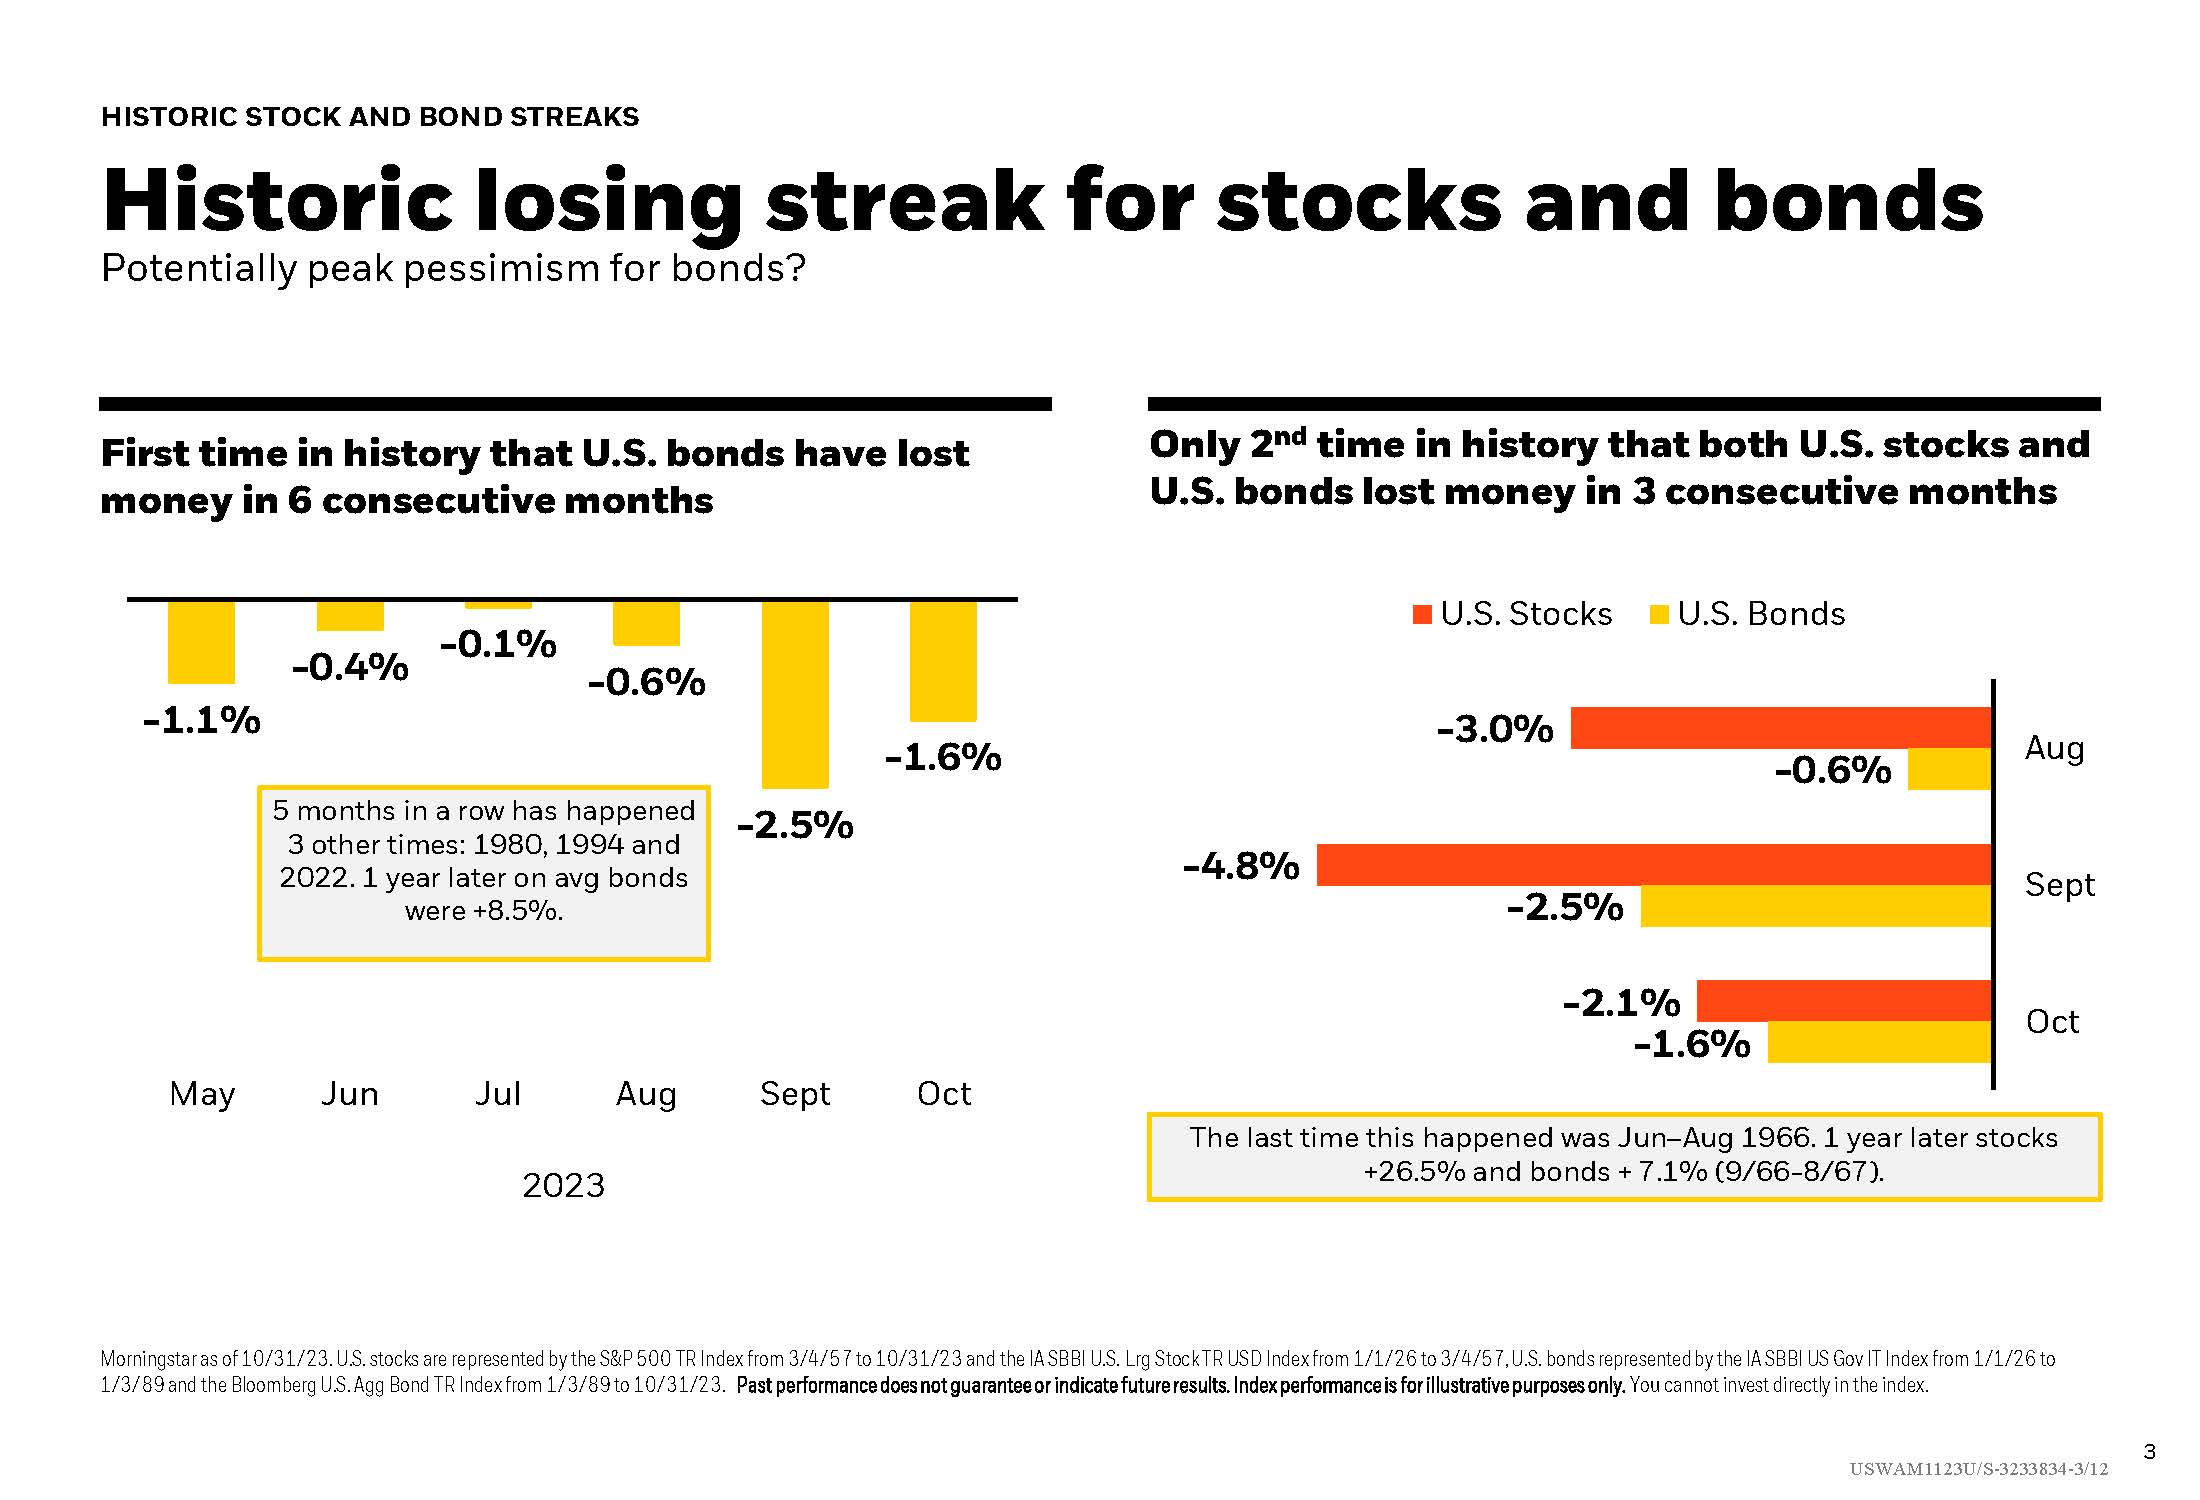
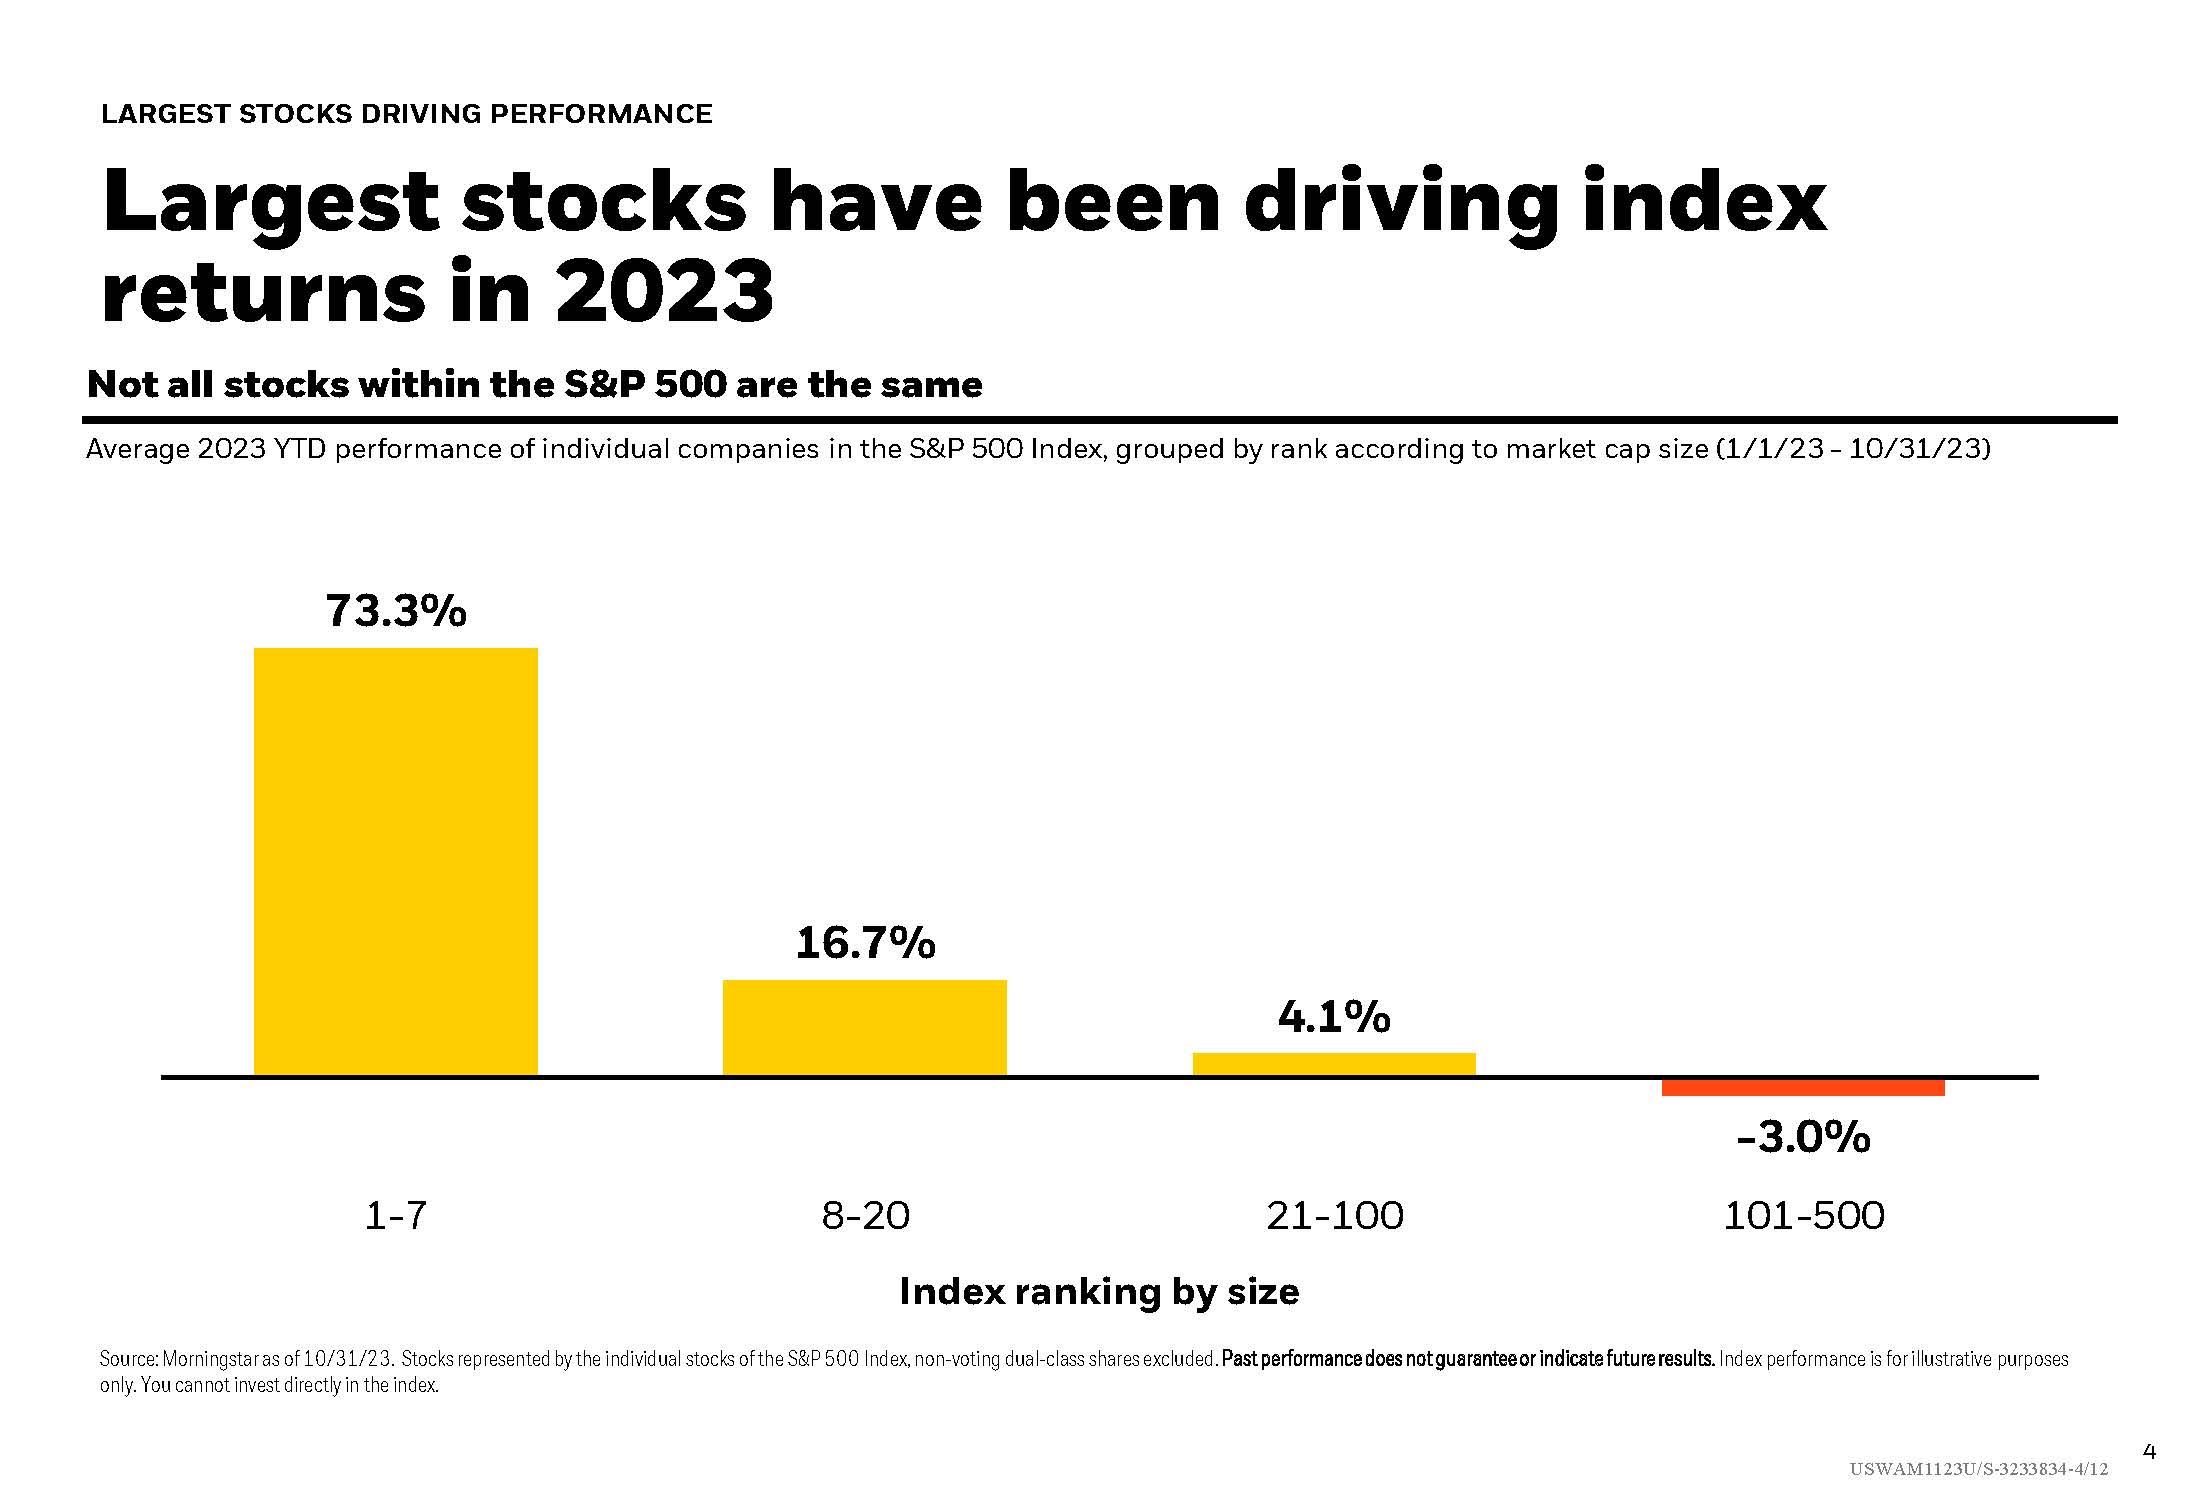
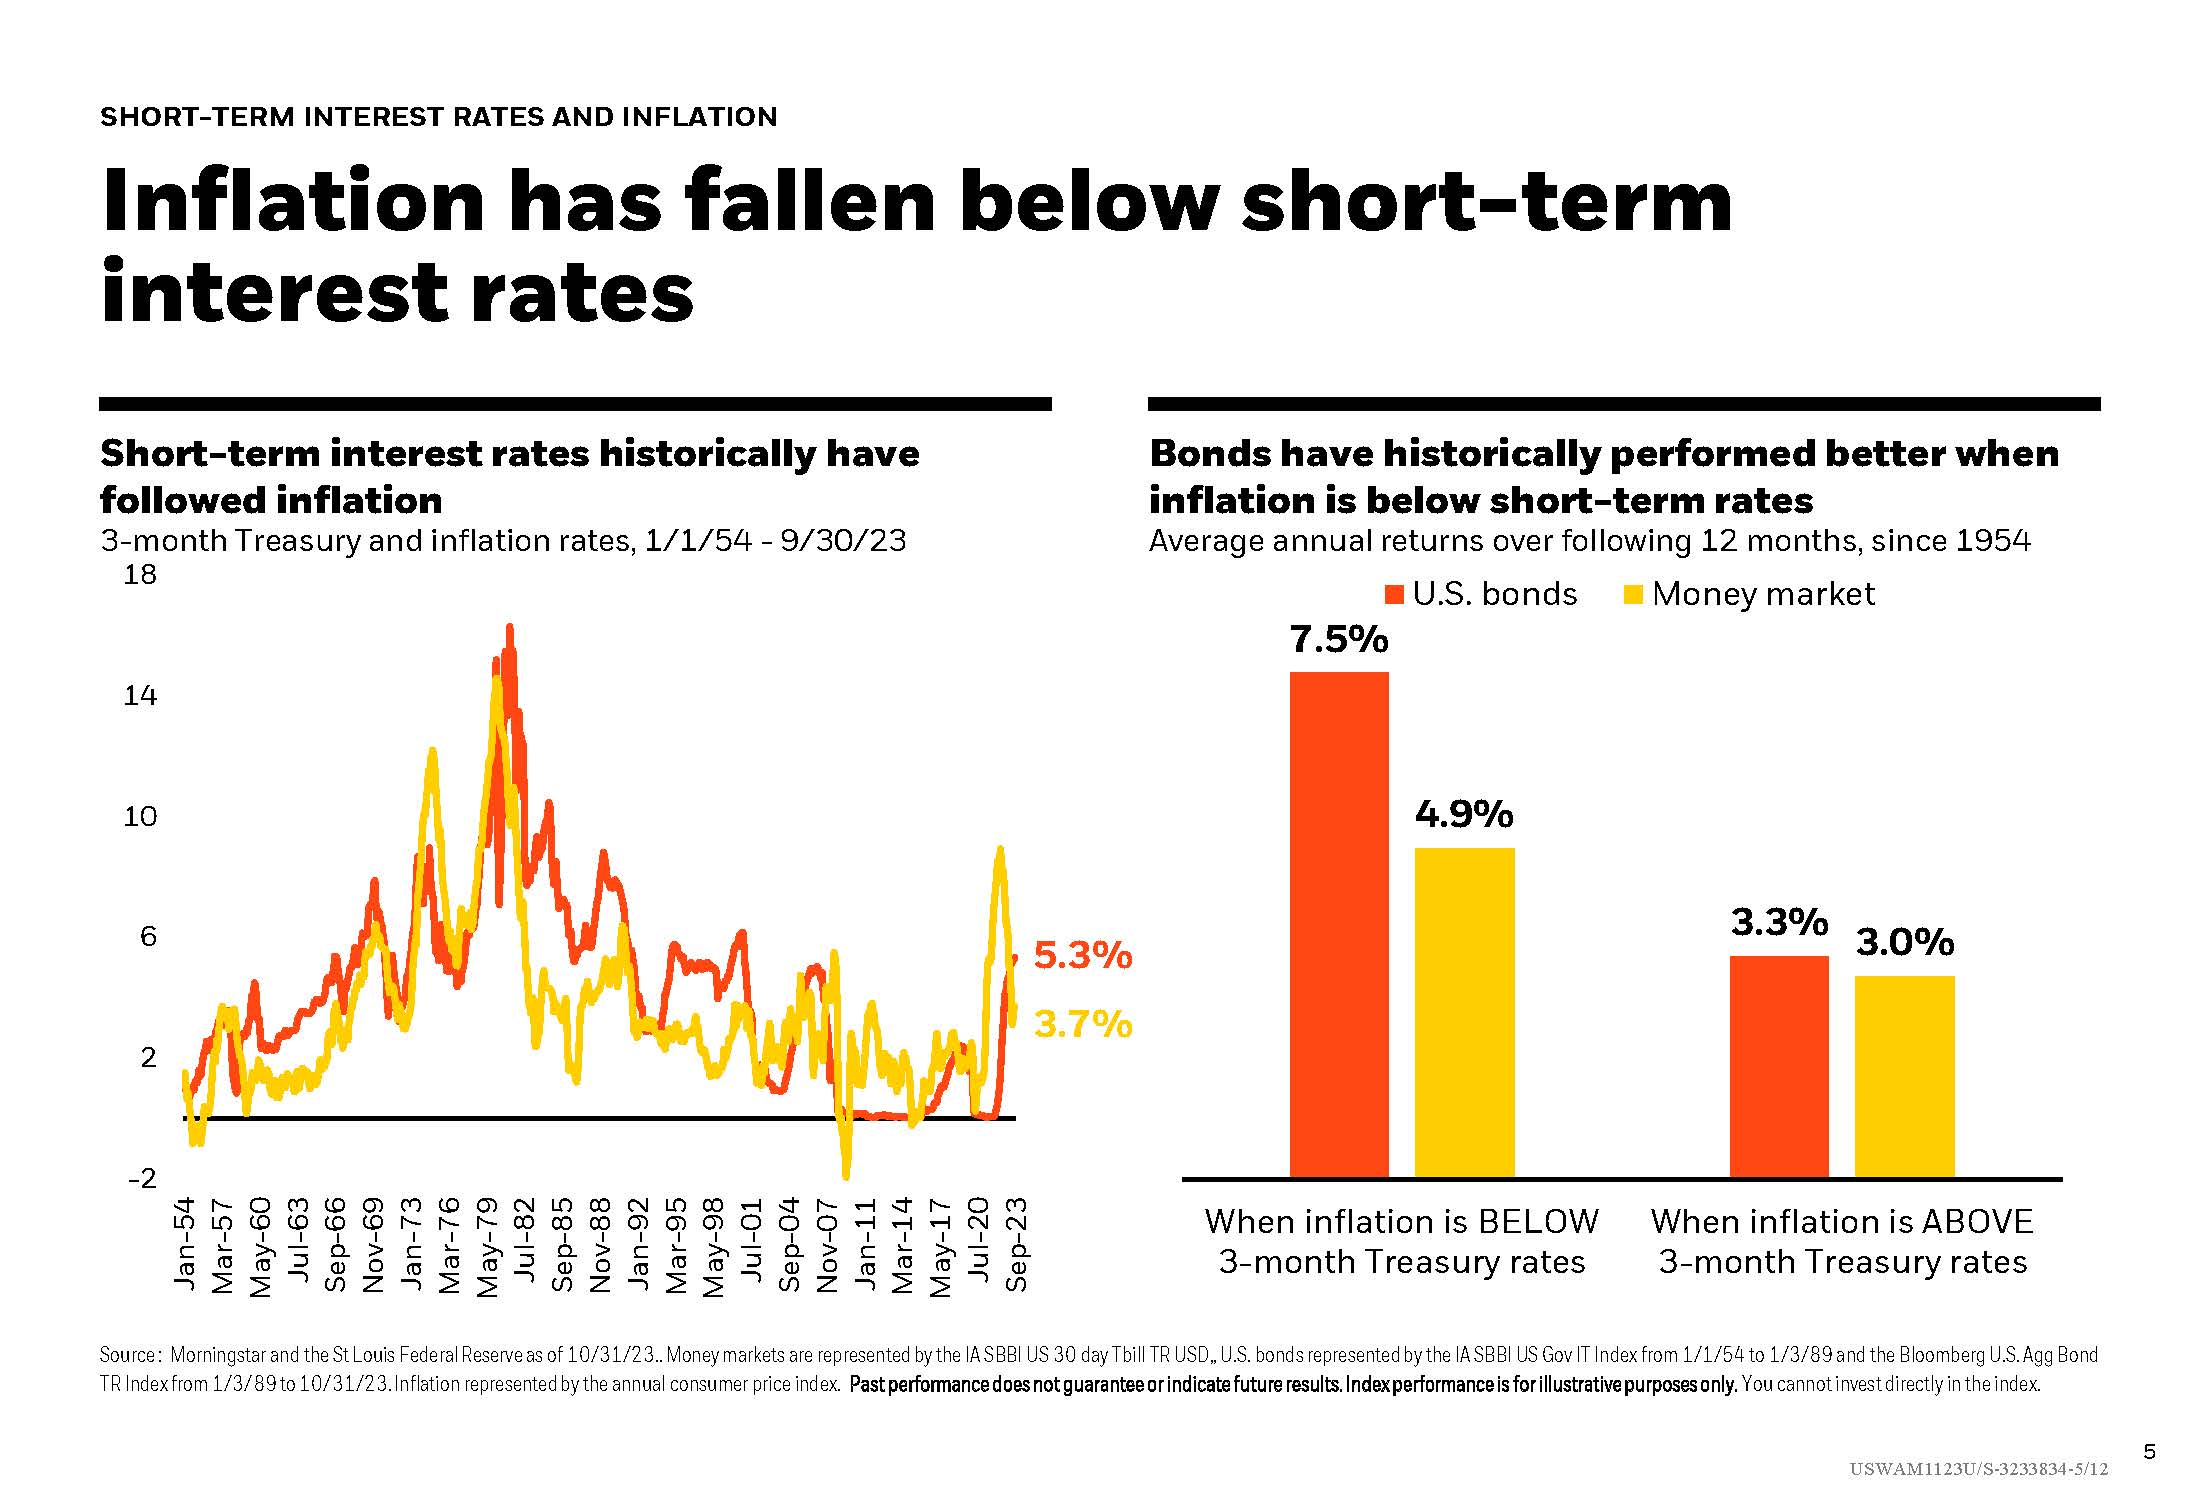
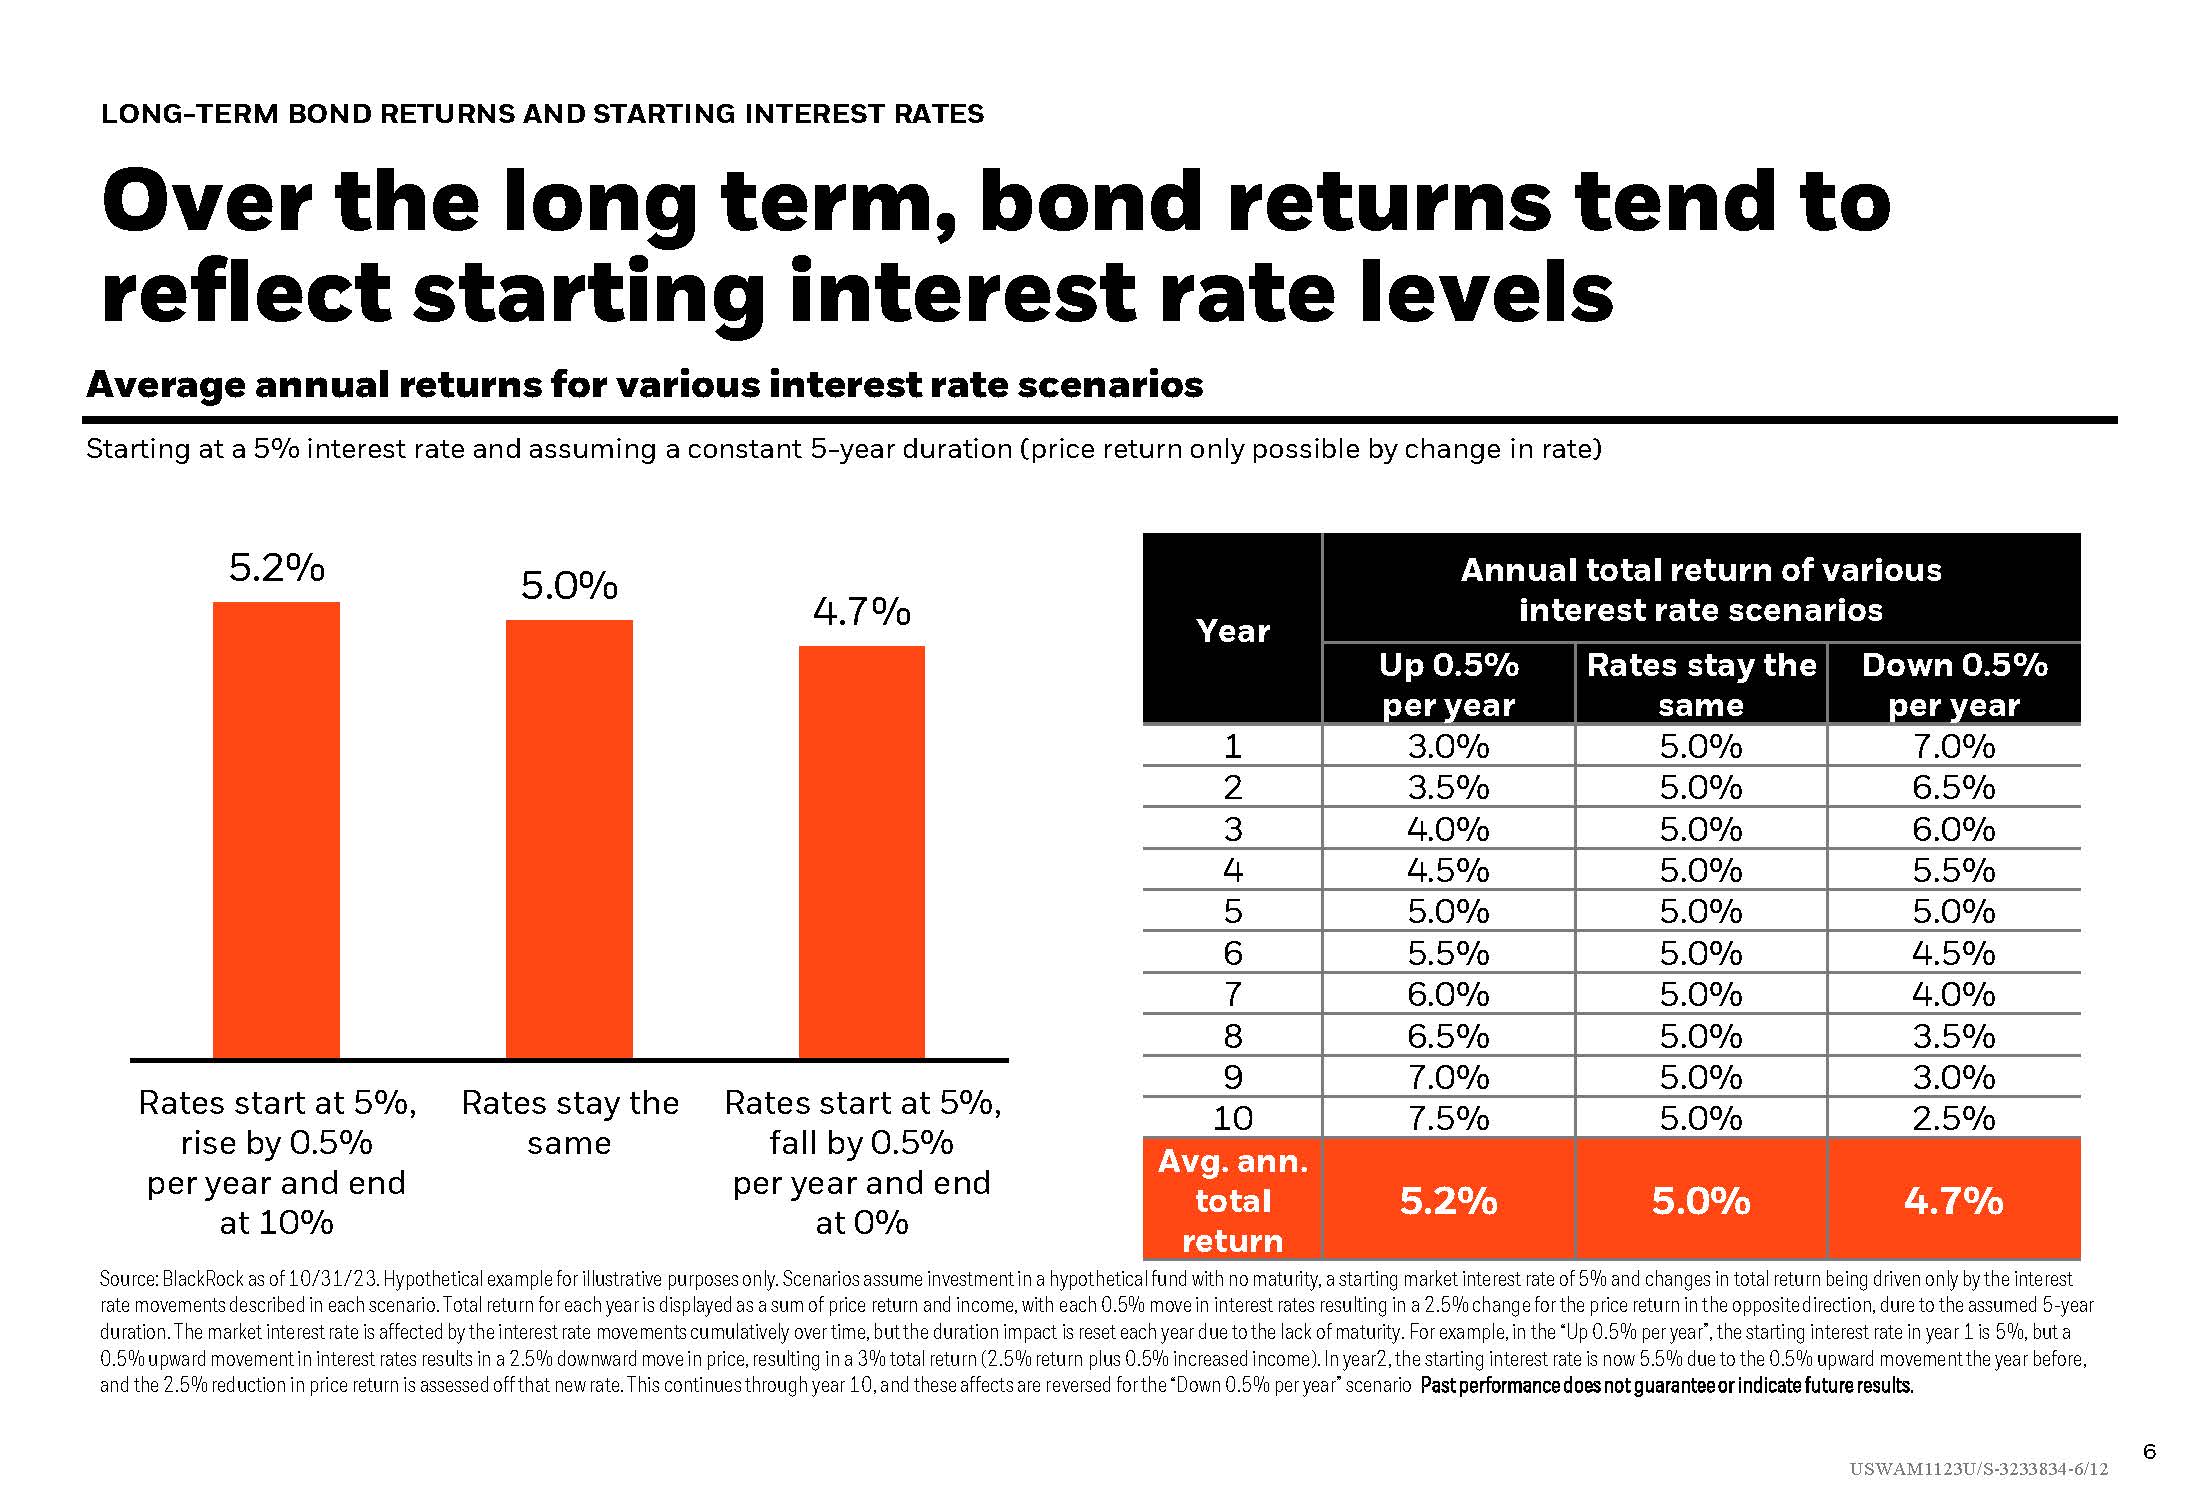
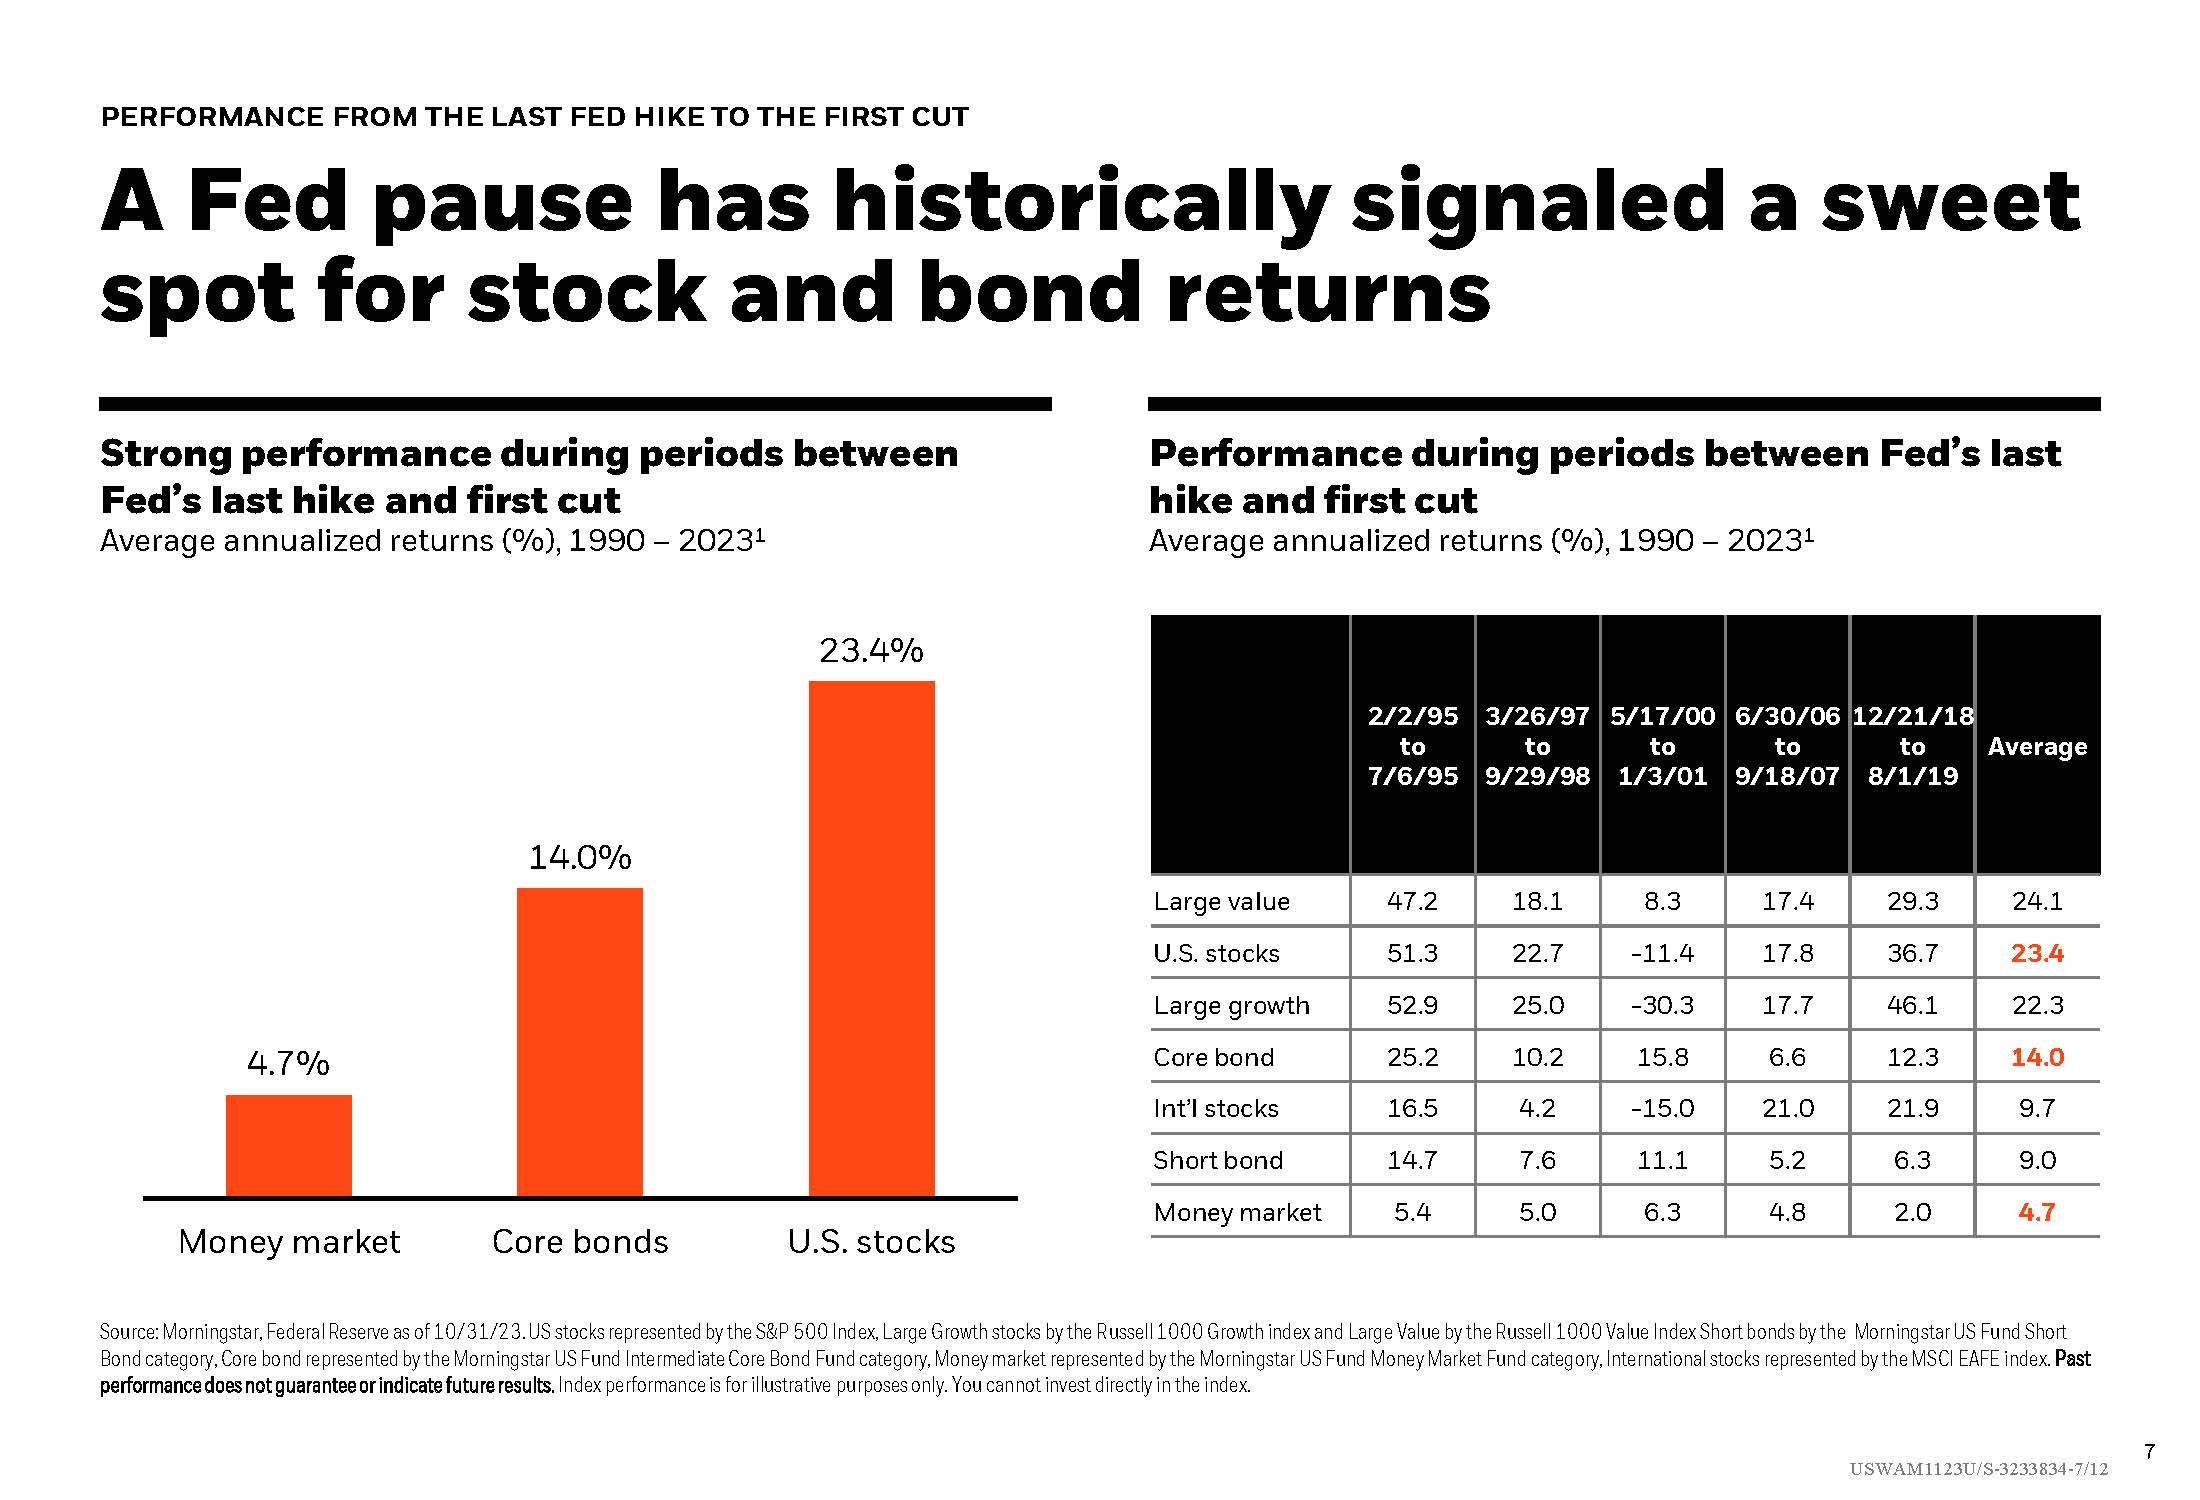
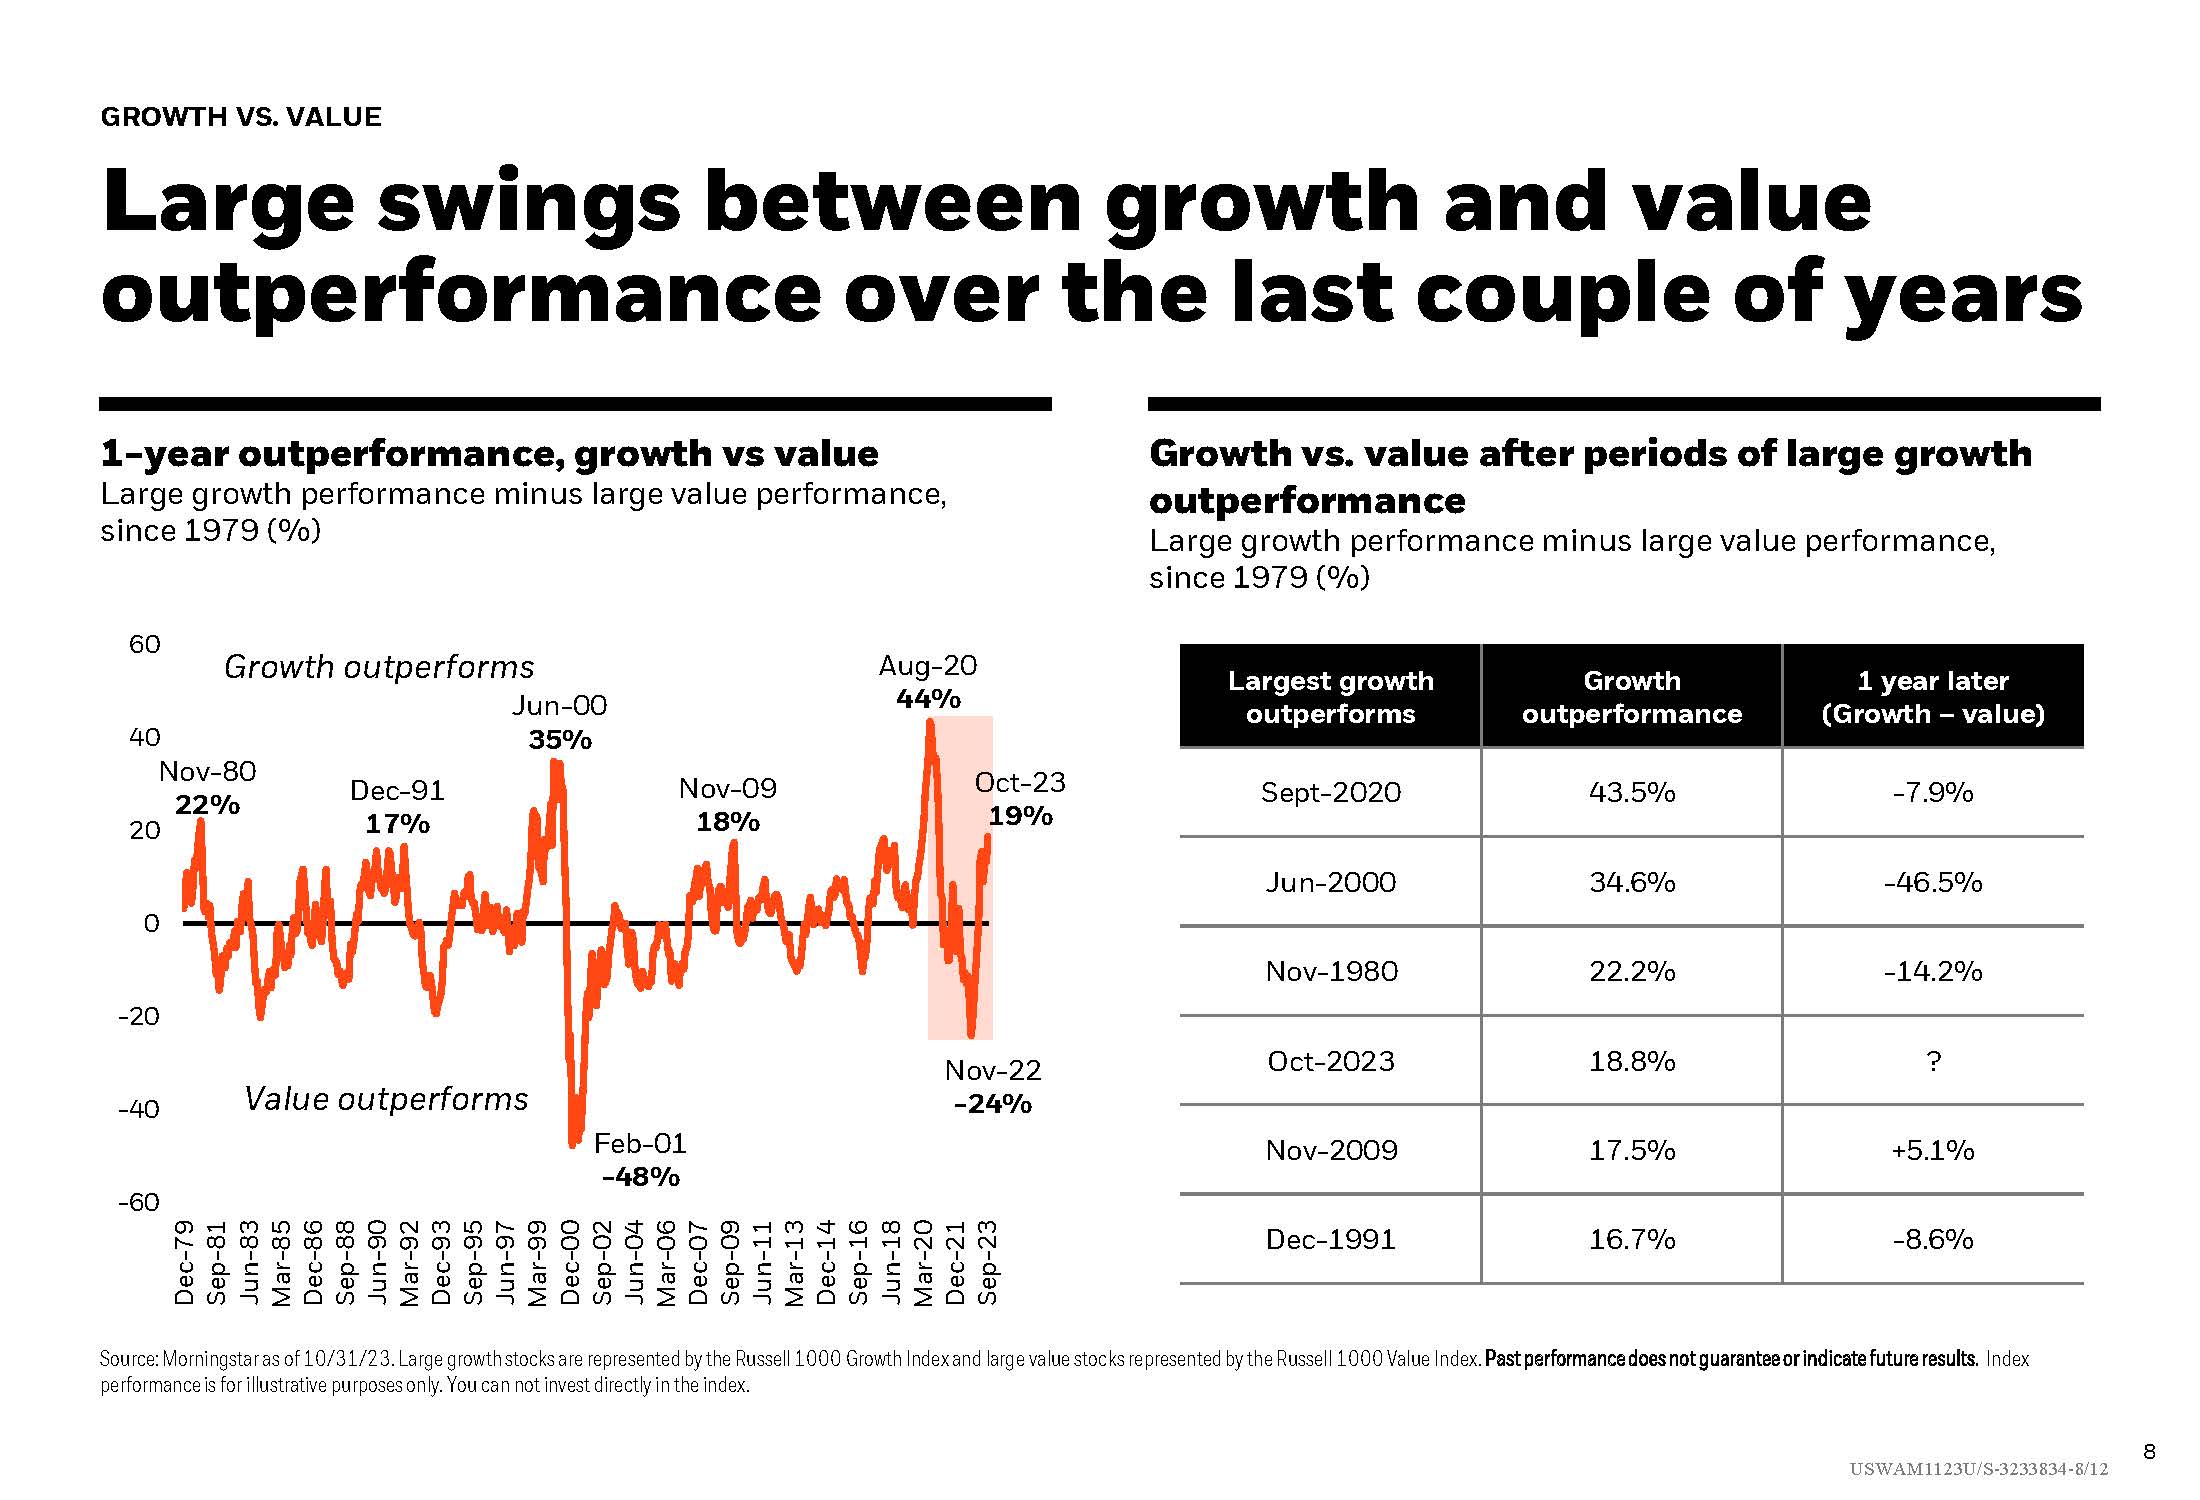
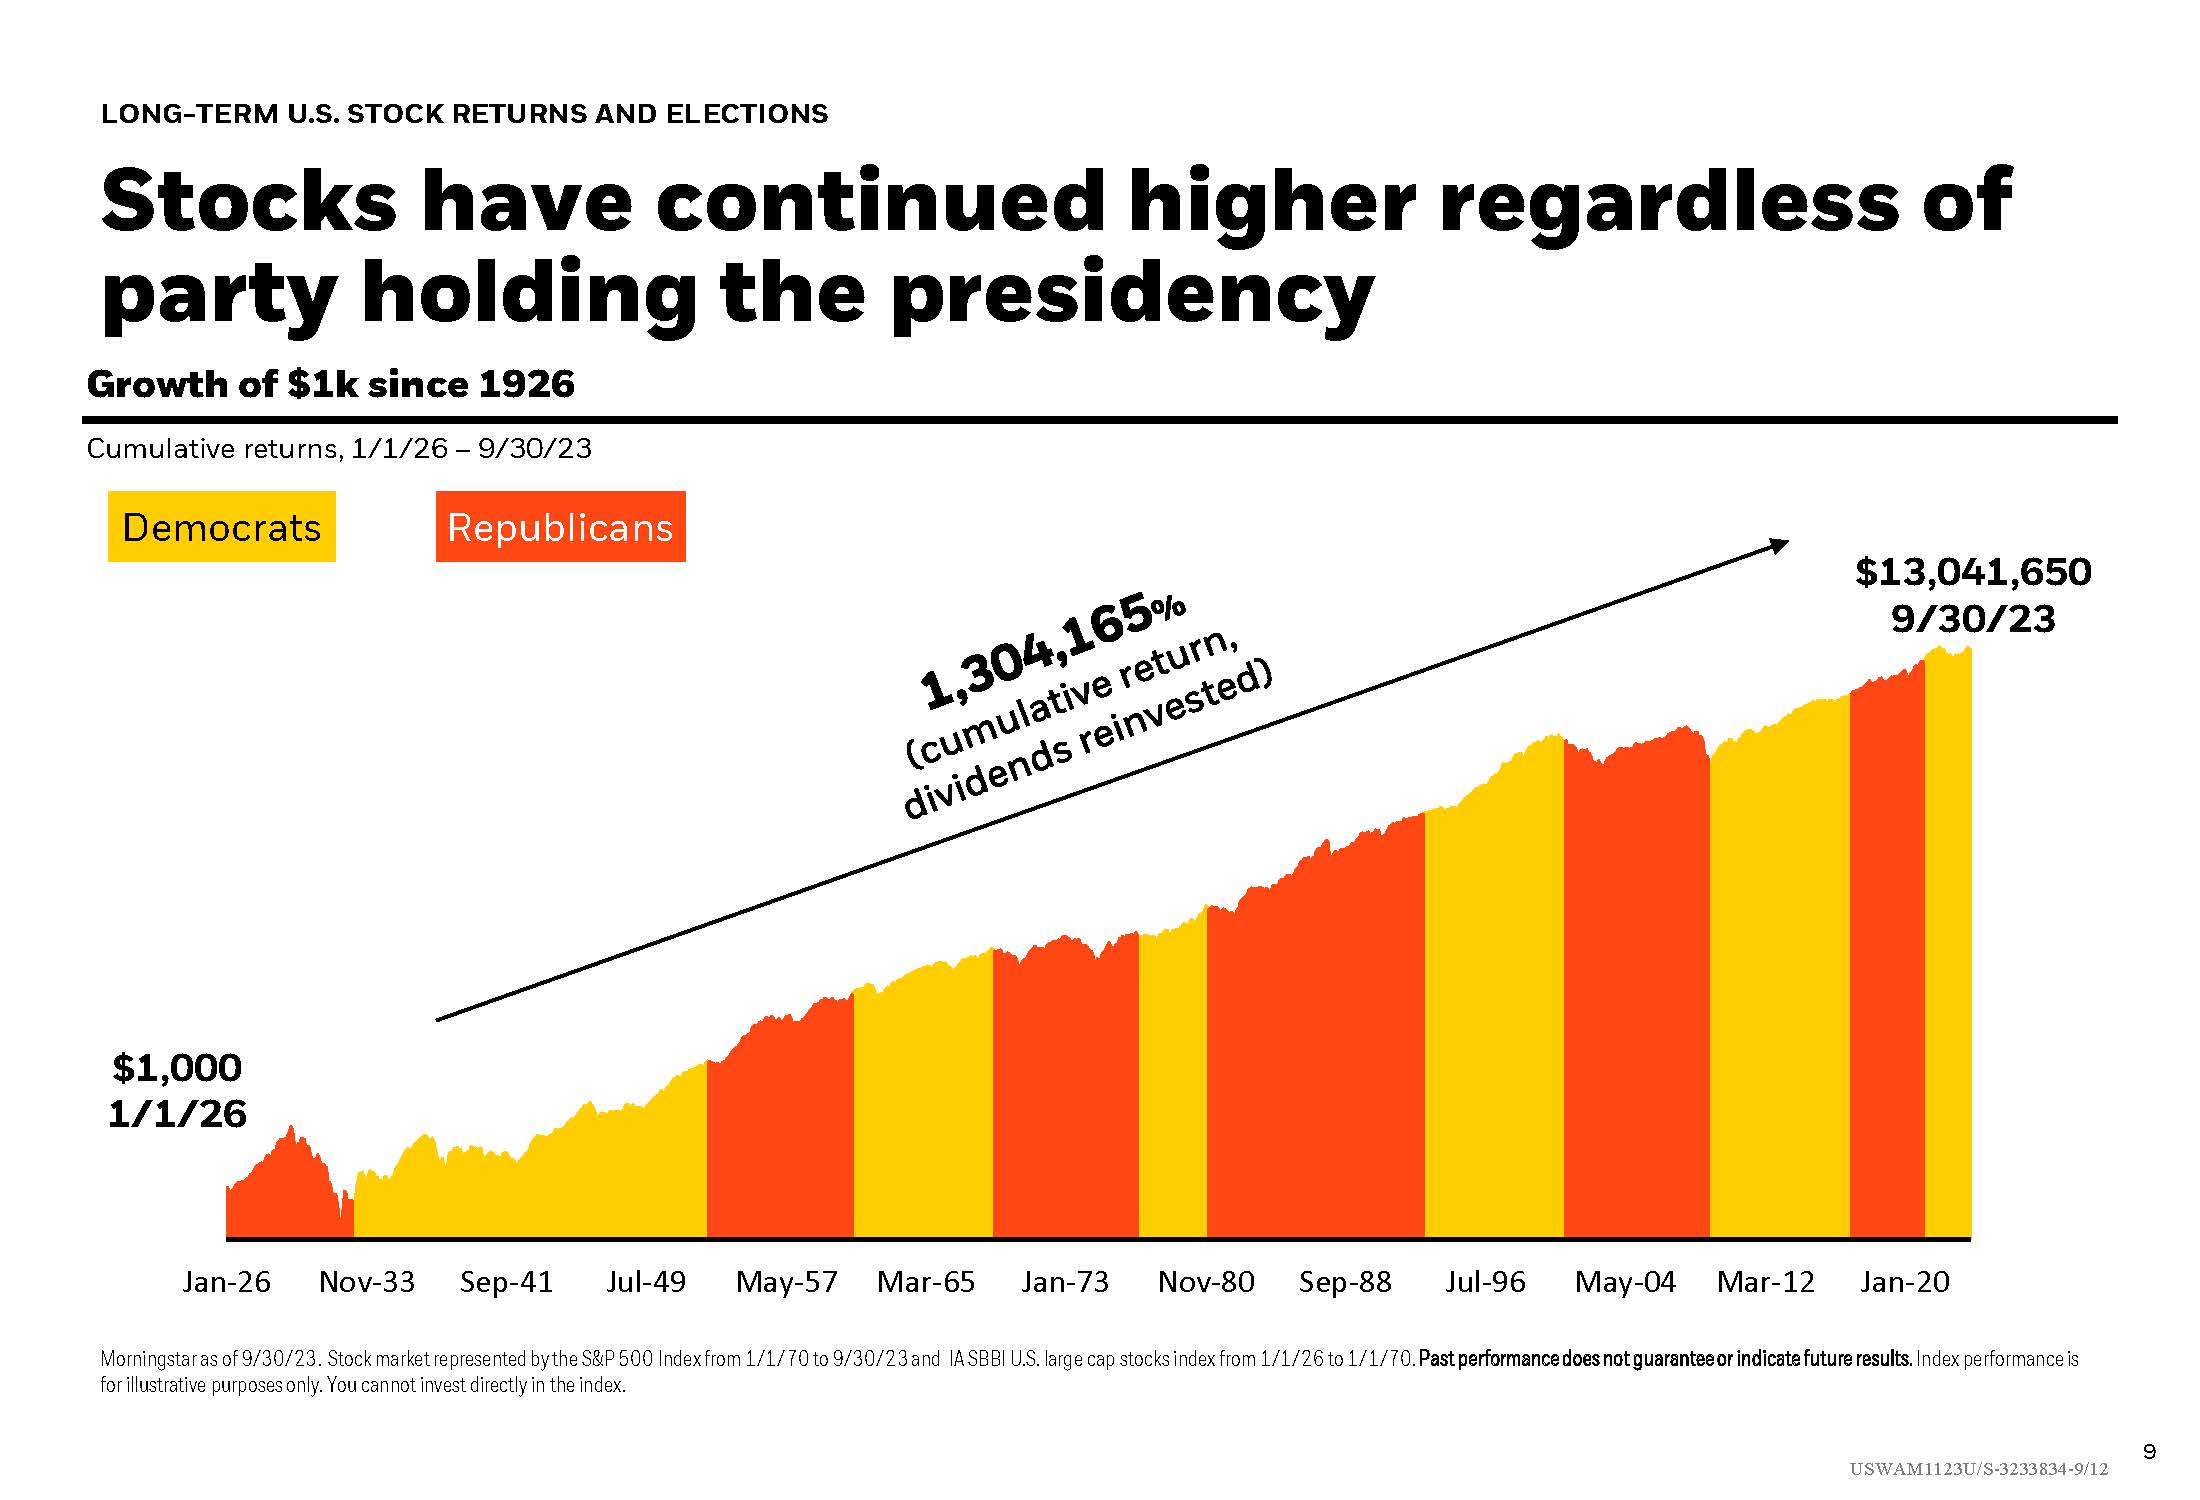
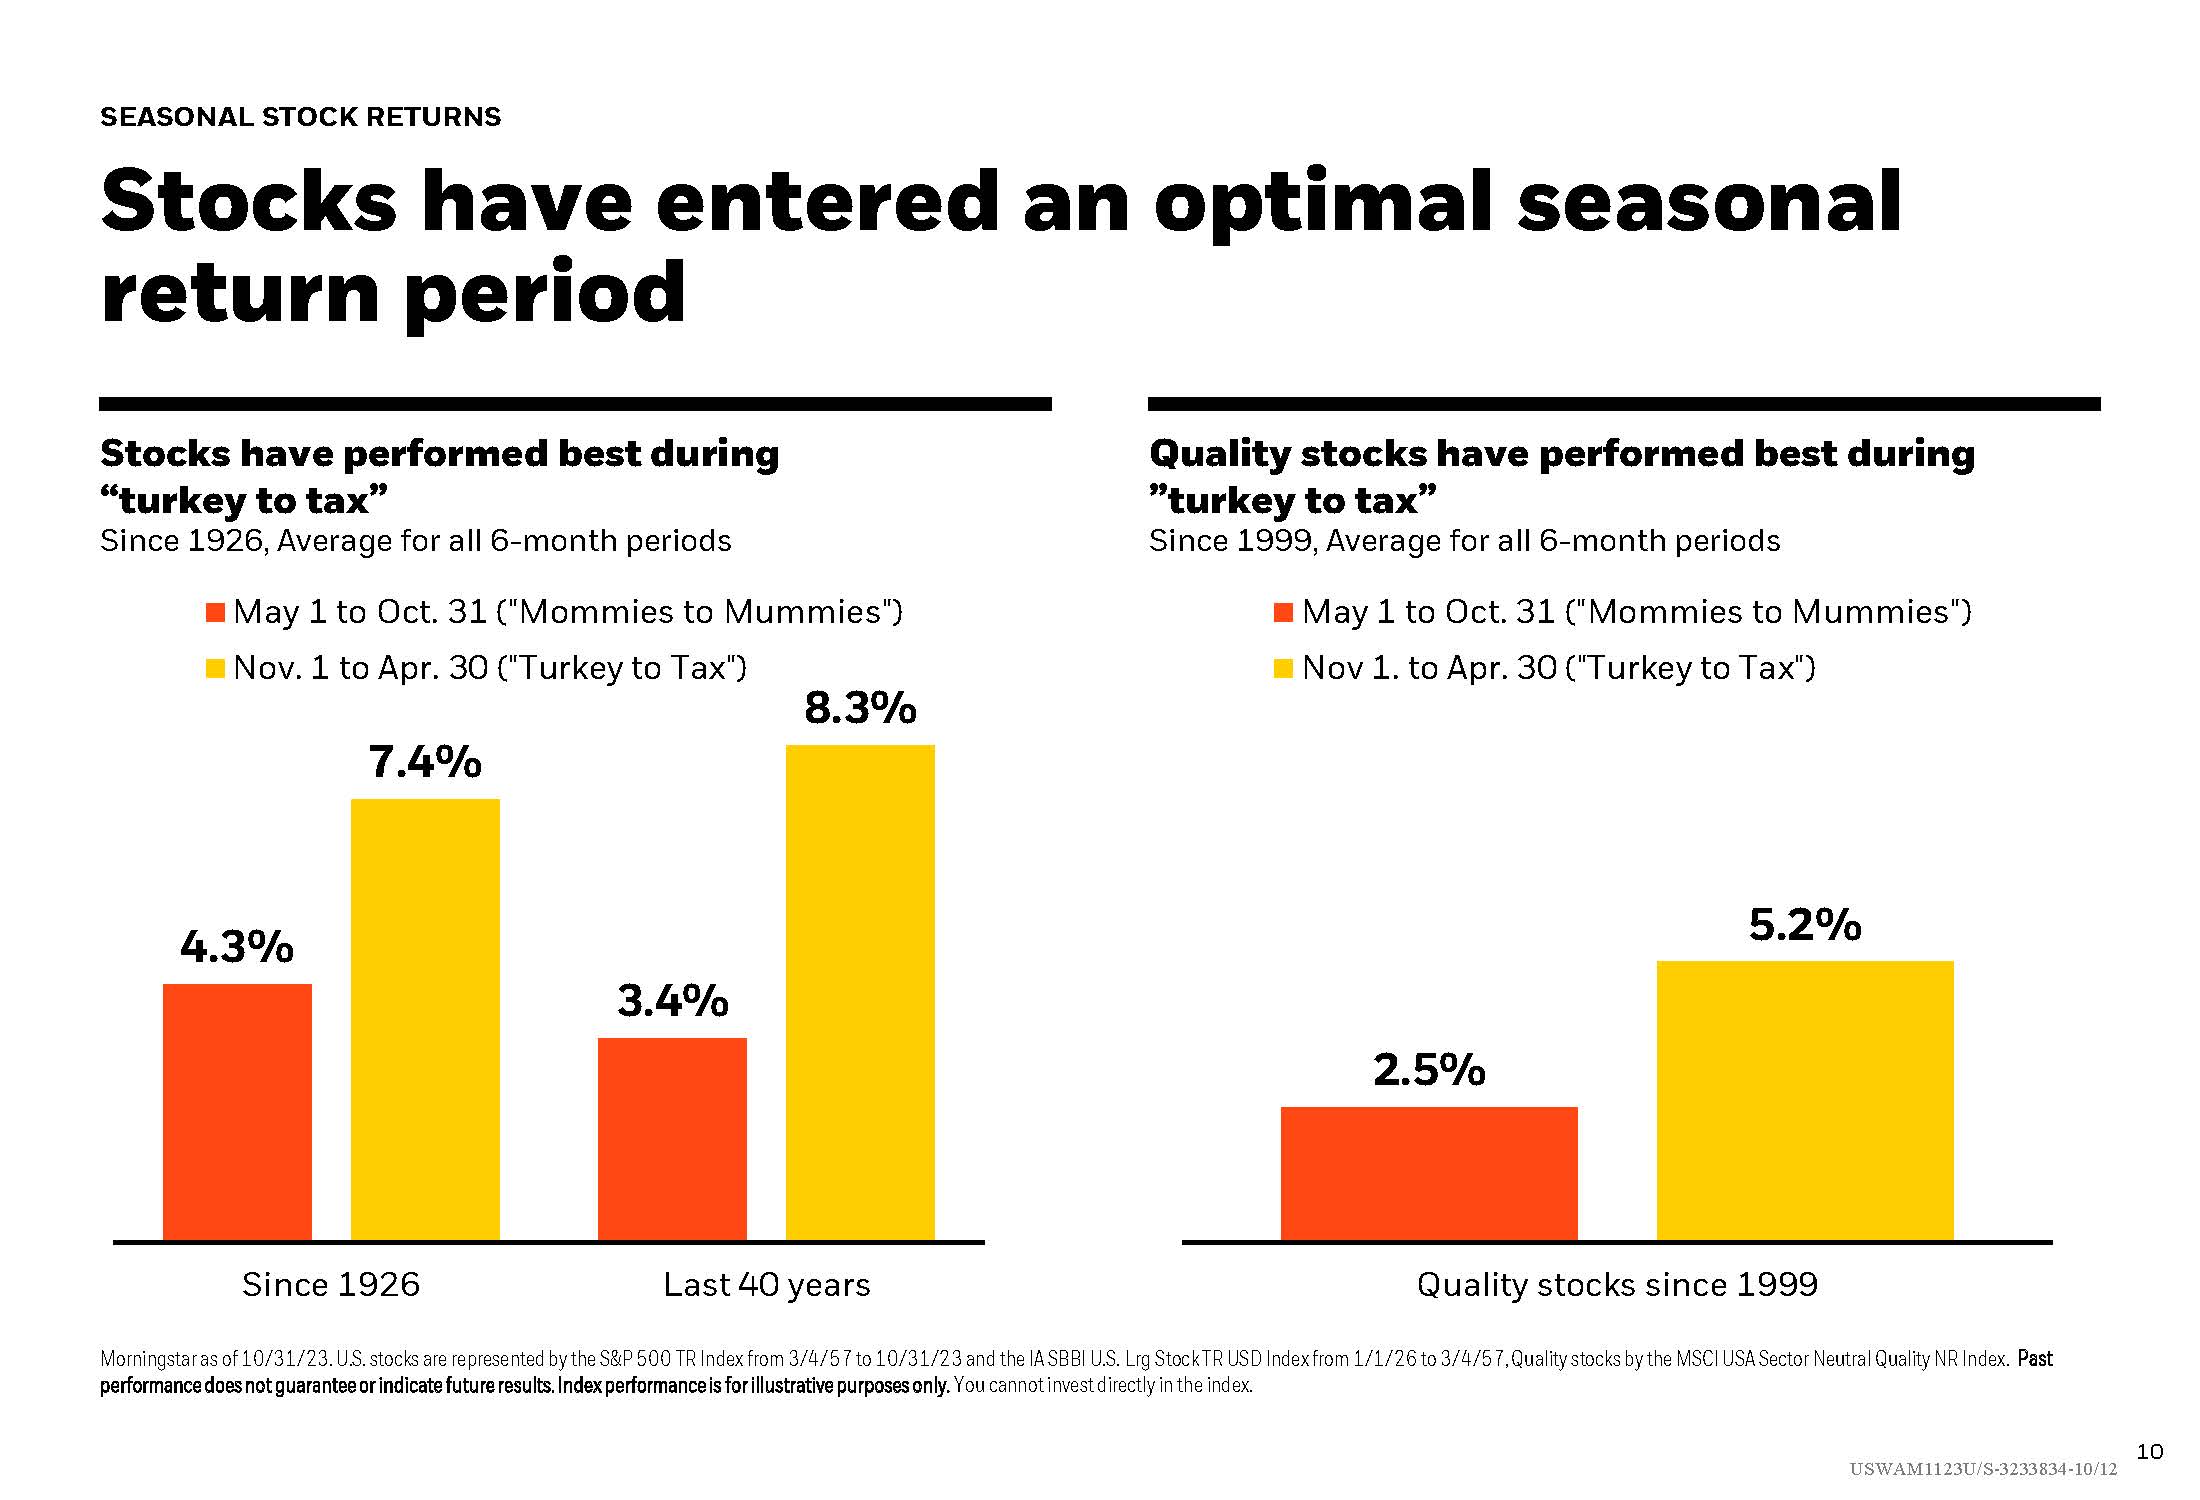
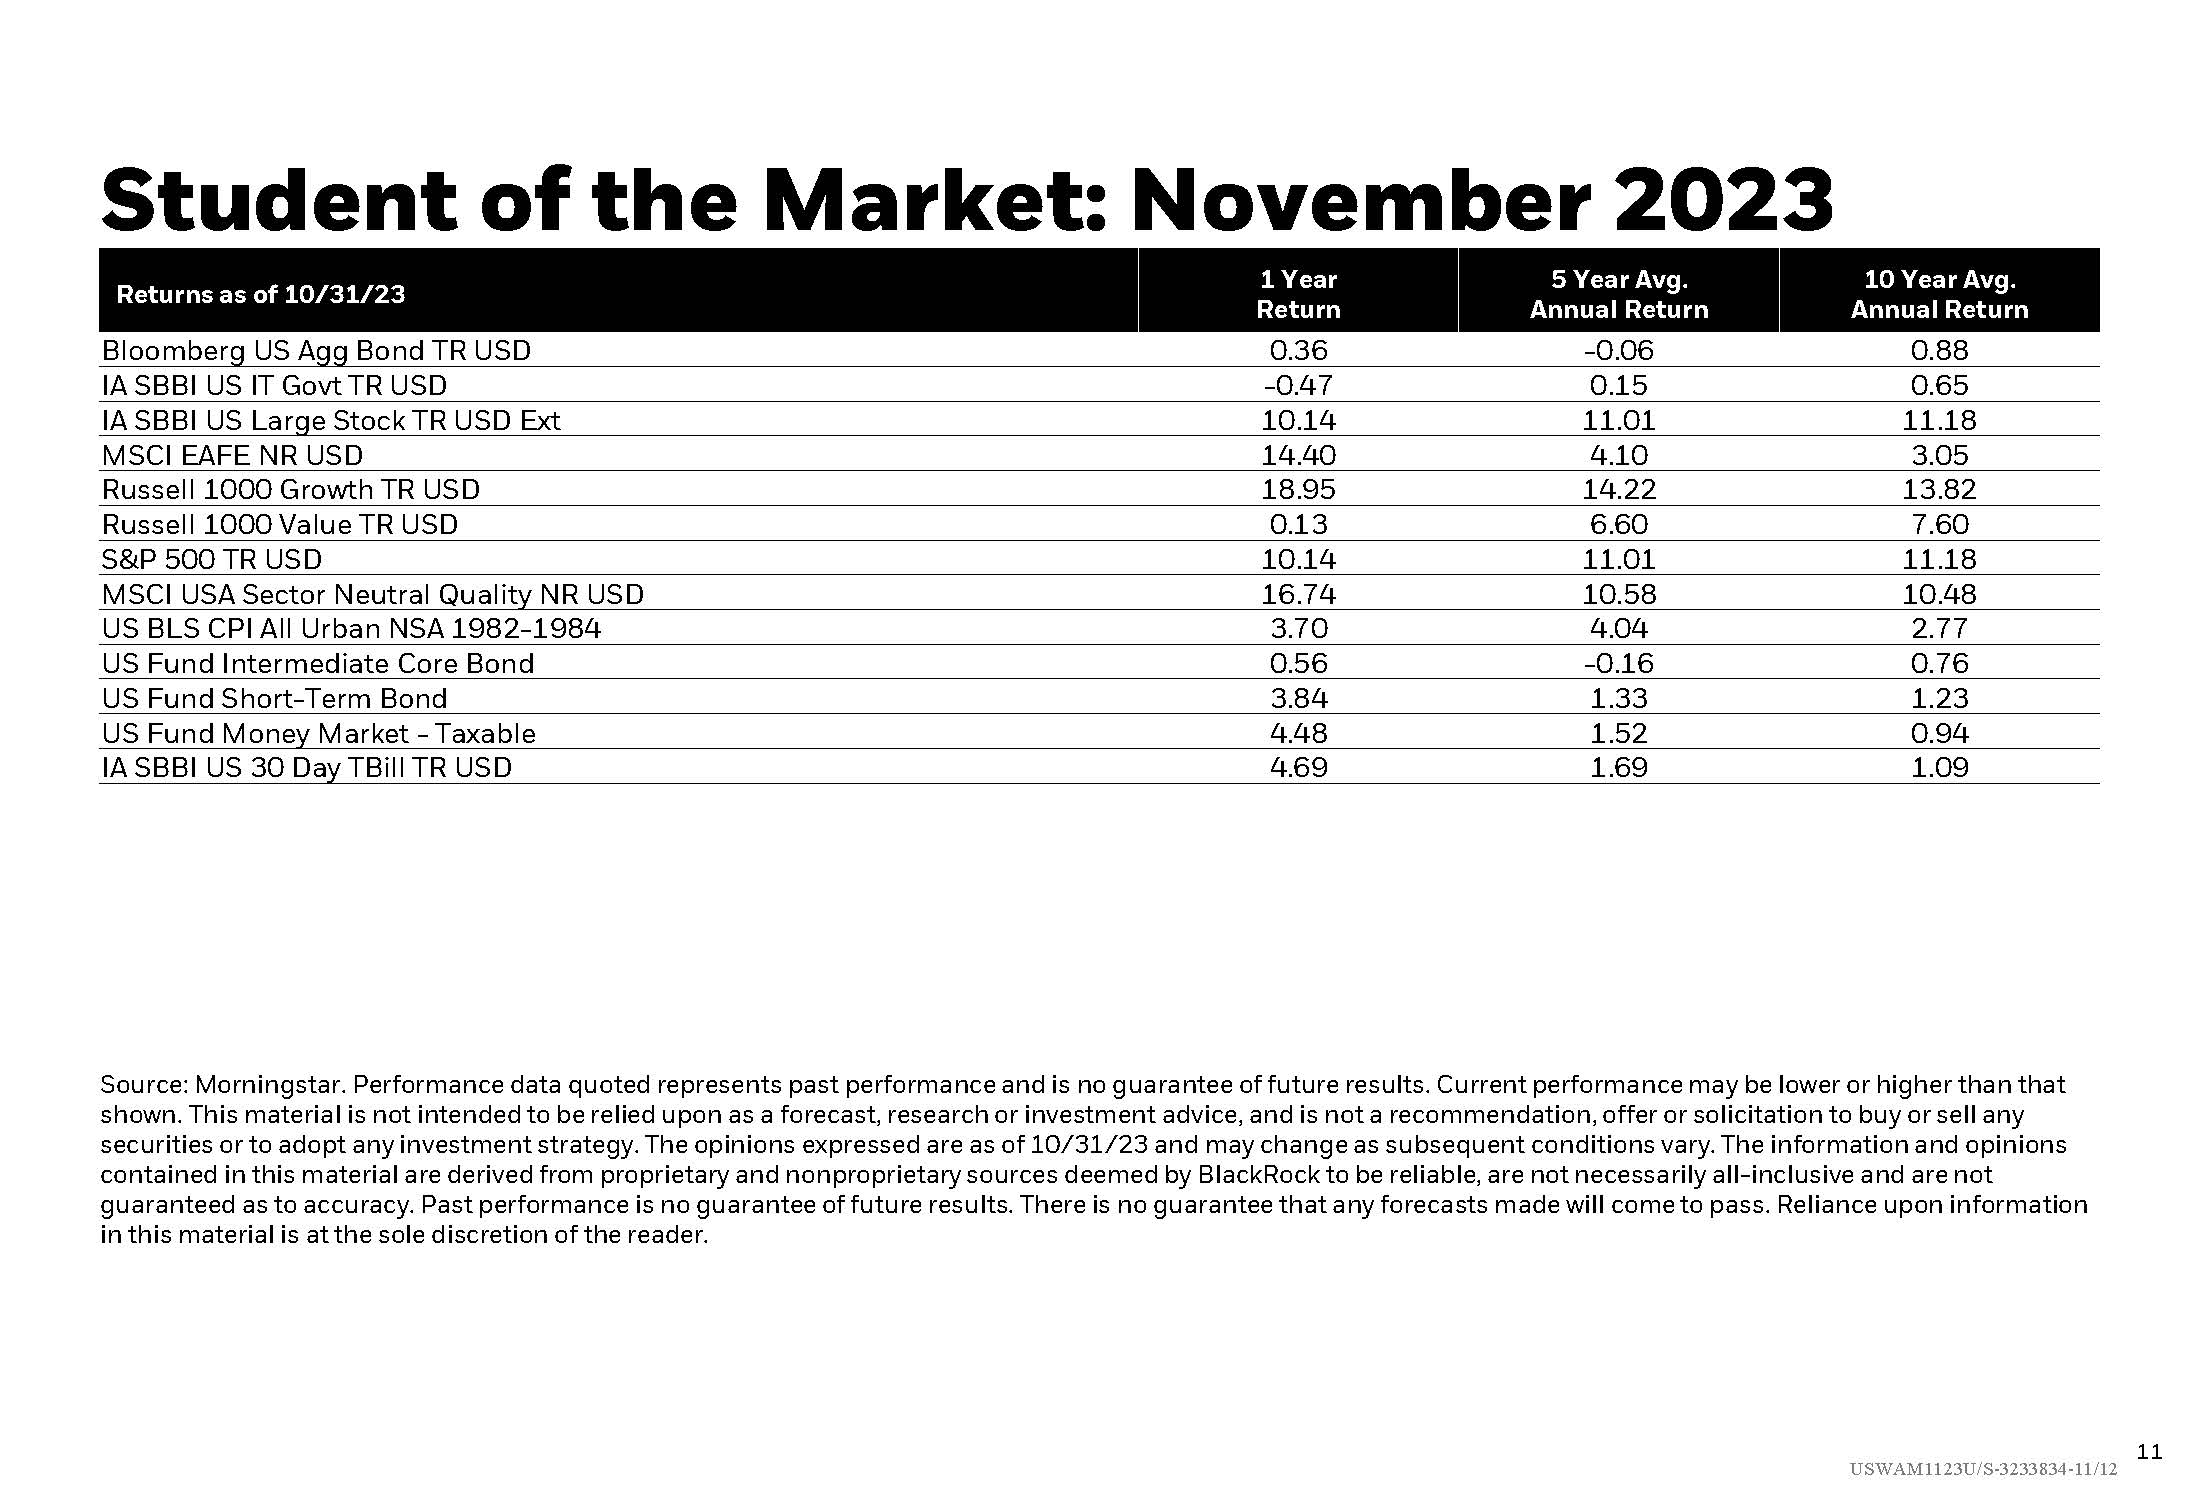
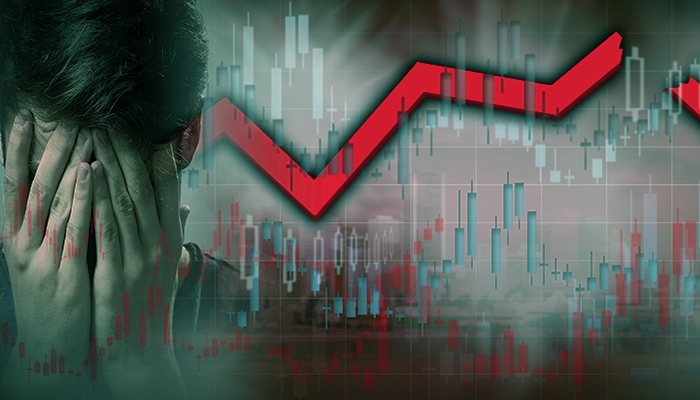
Is there potentially peak pessimism for bonds? Check out this month's past stats for losing streaks for stocks and bonds, as well as long-term bond returns and starting interest rates. Take a look to see how not all stocks within the S&P500 are the same and find the historic sweet spots for stock and bond returns during a Fed pause.

November 29, 2023
NOV Student of the Market
Important Disclosure: Content on our website and in our newsletters is for informational purposes only. The information provided may (or may not) directly apply to your situation. We recommend that readers work directly with a professional advisor when making decisions in the context of their specific situation.

Other content you may like

  • What Happened in August + Student Loans

    September 2, 2022
    In this first episode of the newly created Monthly Market Matters, Adam and Kyle take a brief look at the beginning of August and how things changed up by the end. Also, they share non-political insight into the government's Student Loan forgiveness and a proposed plan that is being discussed for going forward.
    Read this Article
  • Podcast Highlight 1 - Market Recap

    Podcast Highlight 5 - How the Market Ties to Inflation

    June 4, 2024
    The Strong Valley advisor team reviews how the market prices in rate cuts and what this could mean to the way things have been muddling along with cuts in the Fed Funds rate.
    Read this Article
  • Podcast Highlight 1 - Market Recap

    Podcast Highlight 6 - Policy and Inflation

    June 4, 2024
    The Strong Valley advisor team looks at the data from deficit government spending, money printing, new minimum wage numbers and even the bump in Social Security, and observes how the economy is responding.
    Read this Article
  • Stock Performance in Election Years

    Stock Performance in Election Years

    May 23, 2024
    Historical data showing how U.S. stocks have tended to lose money less often in election years, showing the smaller percent of calendar years that lost money, which often tended to be driven by historic economic events, not elections. Included is a glimpse at seasonal stock and bond returns in election years. Also asset classes, inverted yield curve update, high yield bonds environment, and private credit returns.
    Read this Article
  • The link you have selected is located on another server. The linked site contains information that has been created, published, maintained, or otherwise posted by institutions or organizations independent of this organization. We do not endorse, approve, certify, or control any linked websites, their sponsors, or any of their policies, activities, products, or services. We do not assume responsibility for the accuracy, completeness, or timeliness of the information contained therein. Visitors to any linked websites should not use or rely on the information contained therein until they have consulted with an independent financial professional. Please click “Continue to Link” to leave this website and proceed to the selected site.
    phone-handset