For clients of Kate Eiland, please CLICK HERE to see important details related to the Strong Valley transition.
Article

Historic Tandem Stock and Bond Returns

Historic Tandem Stock and Bond Returns

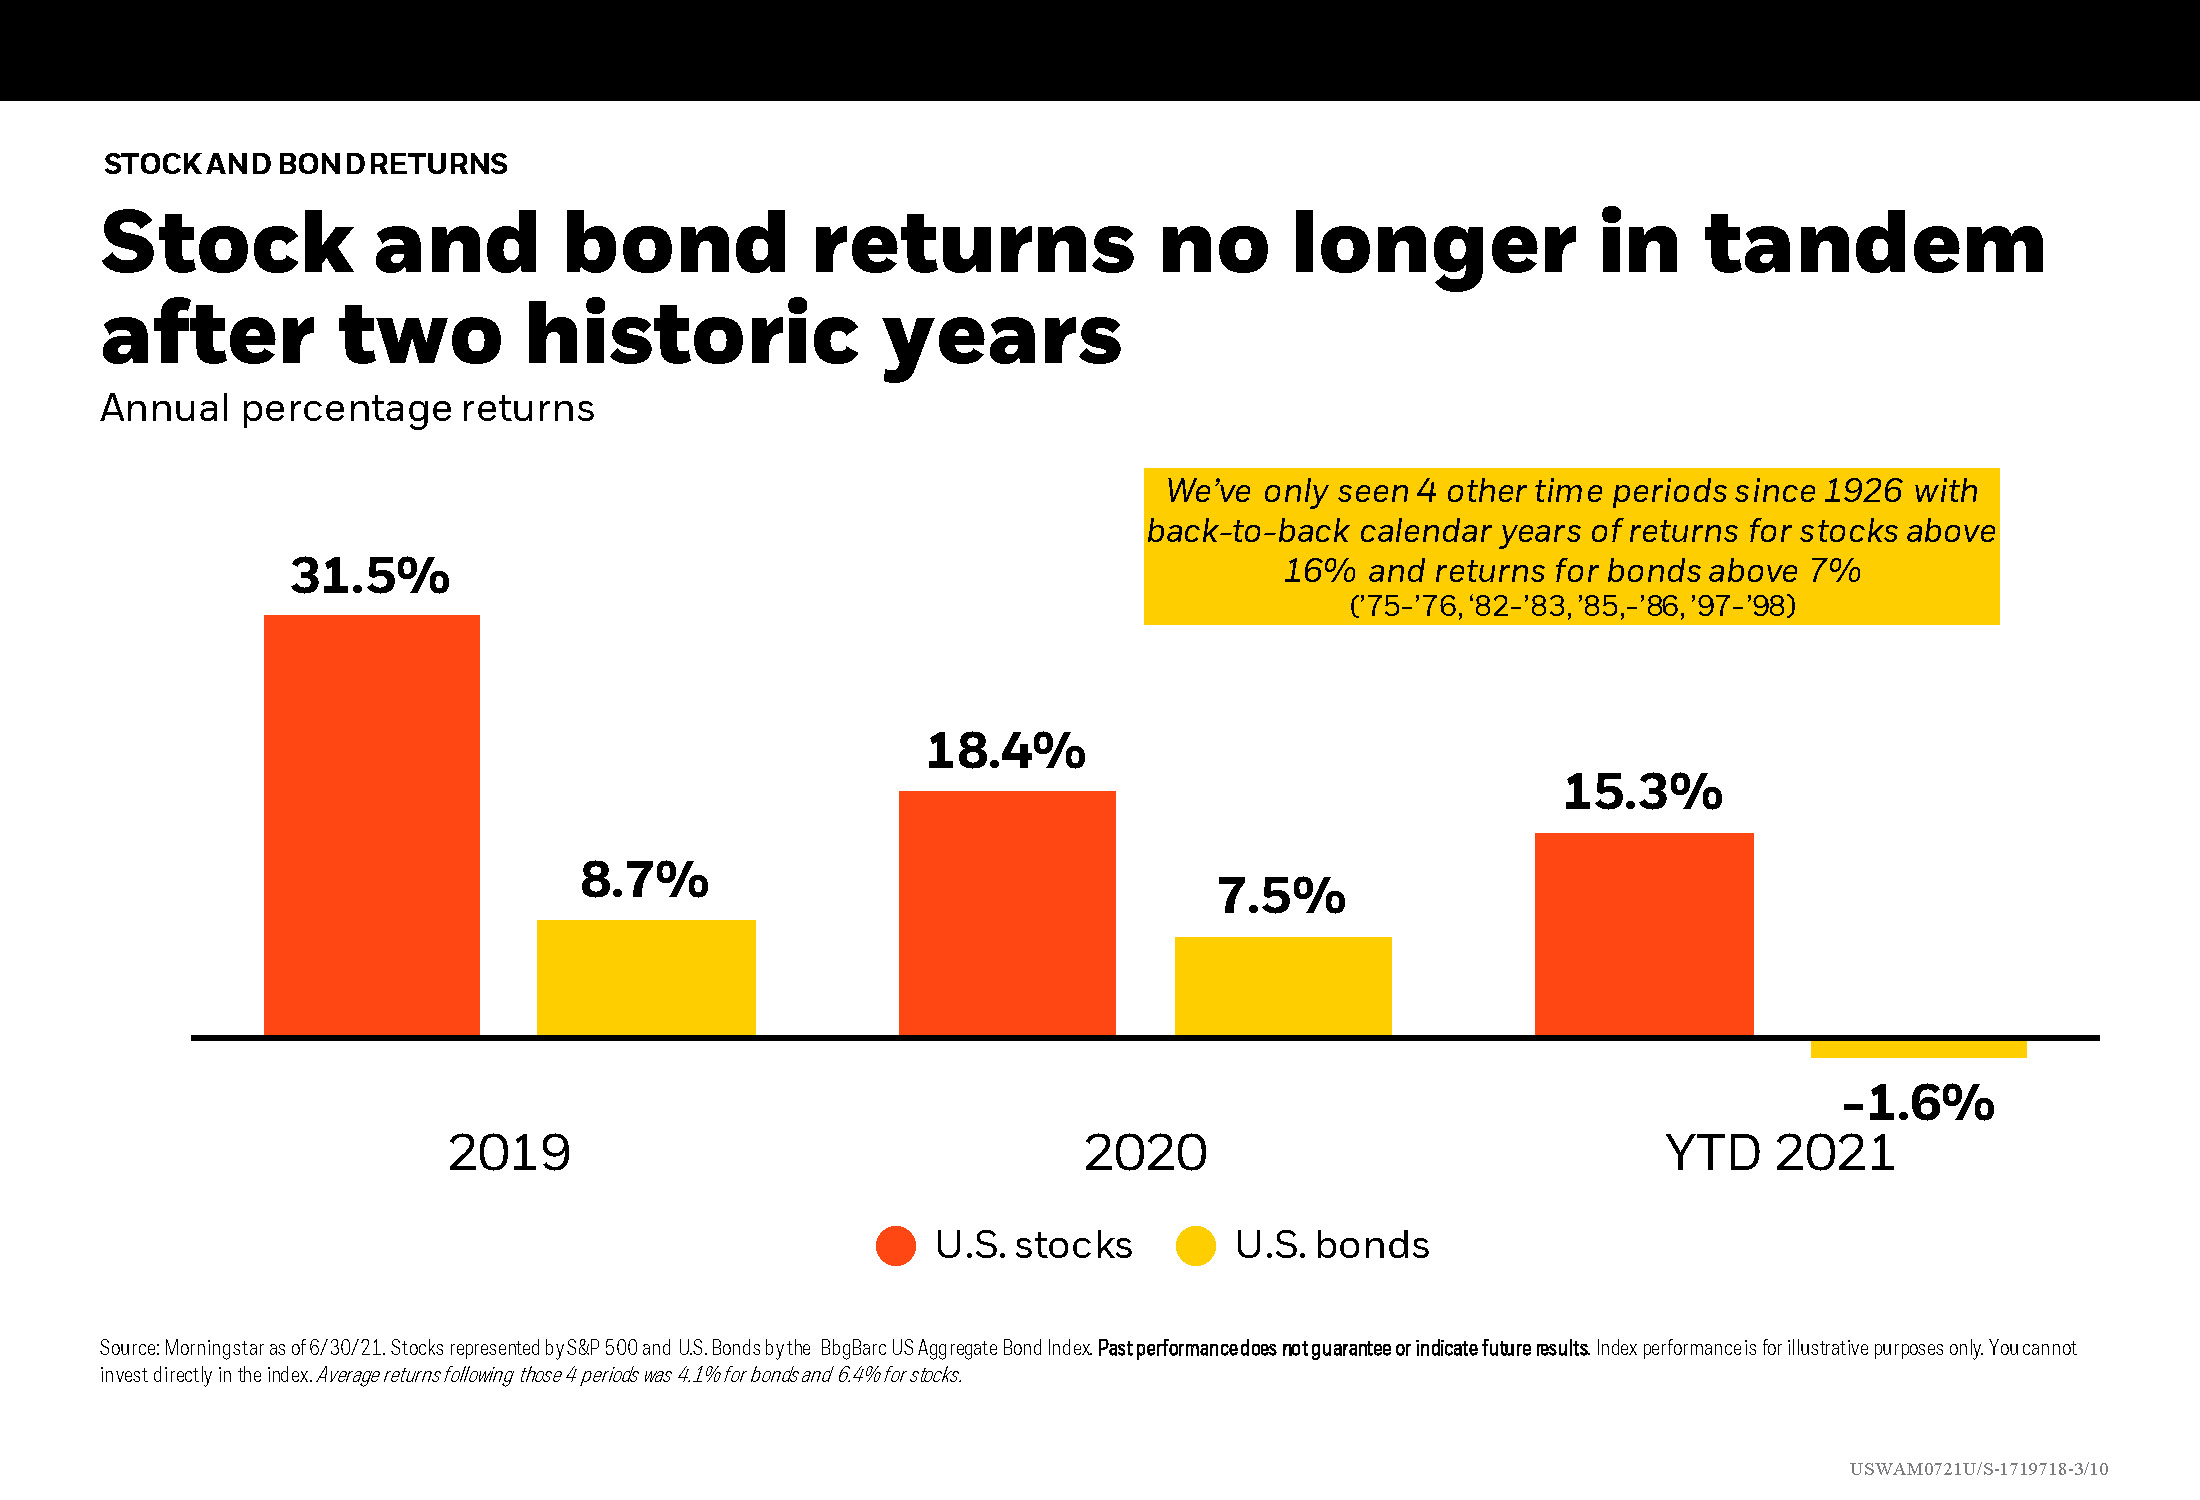
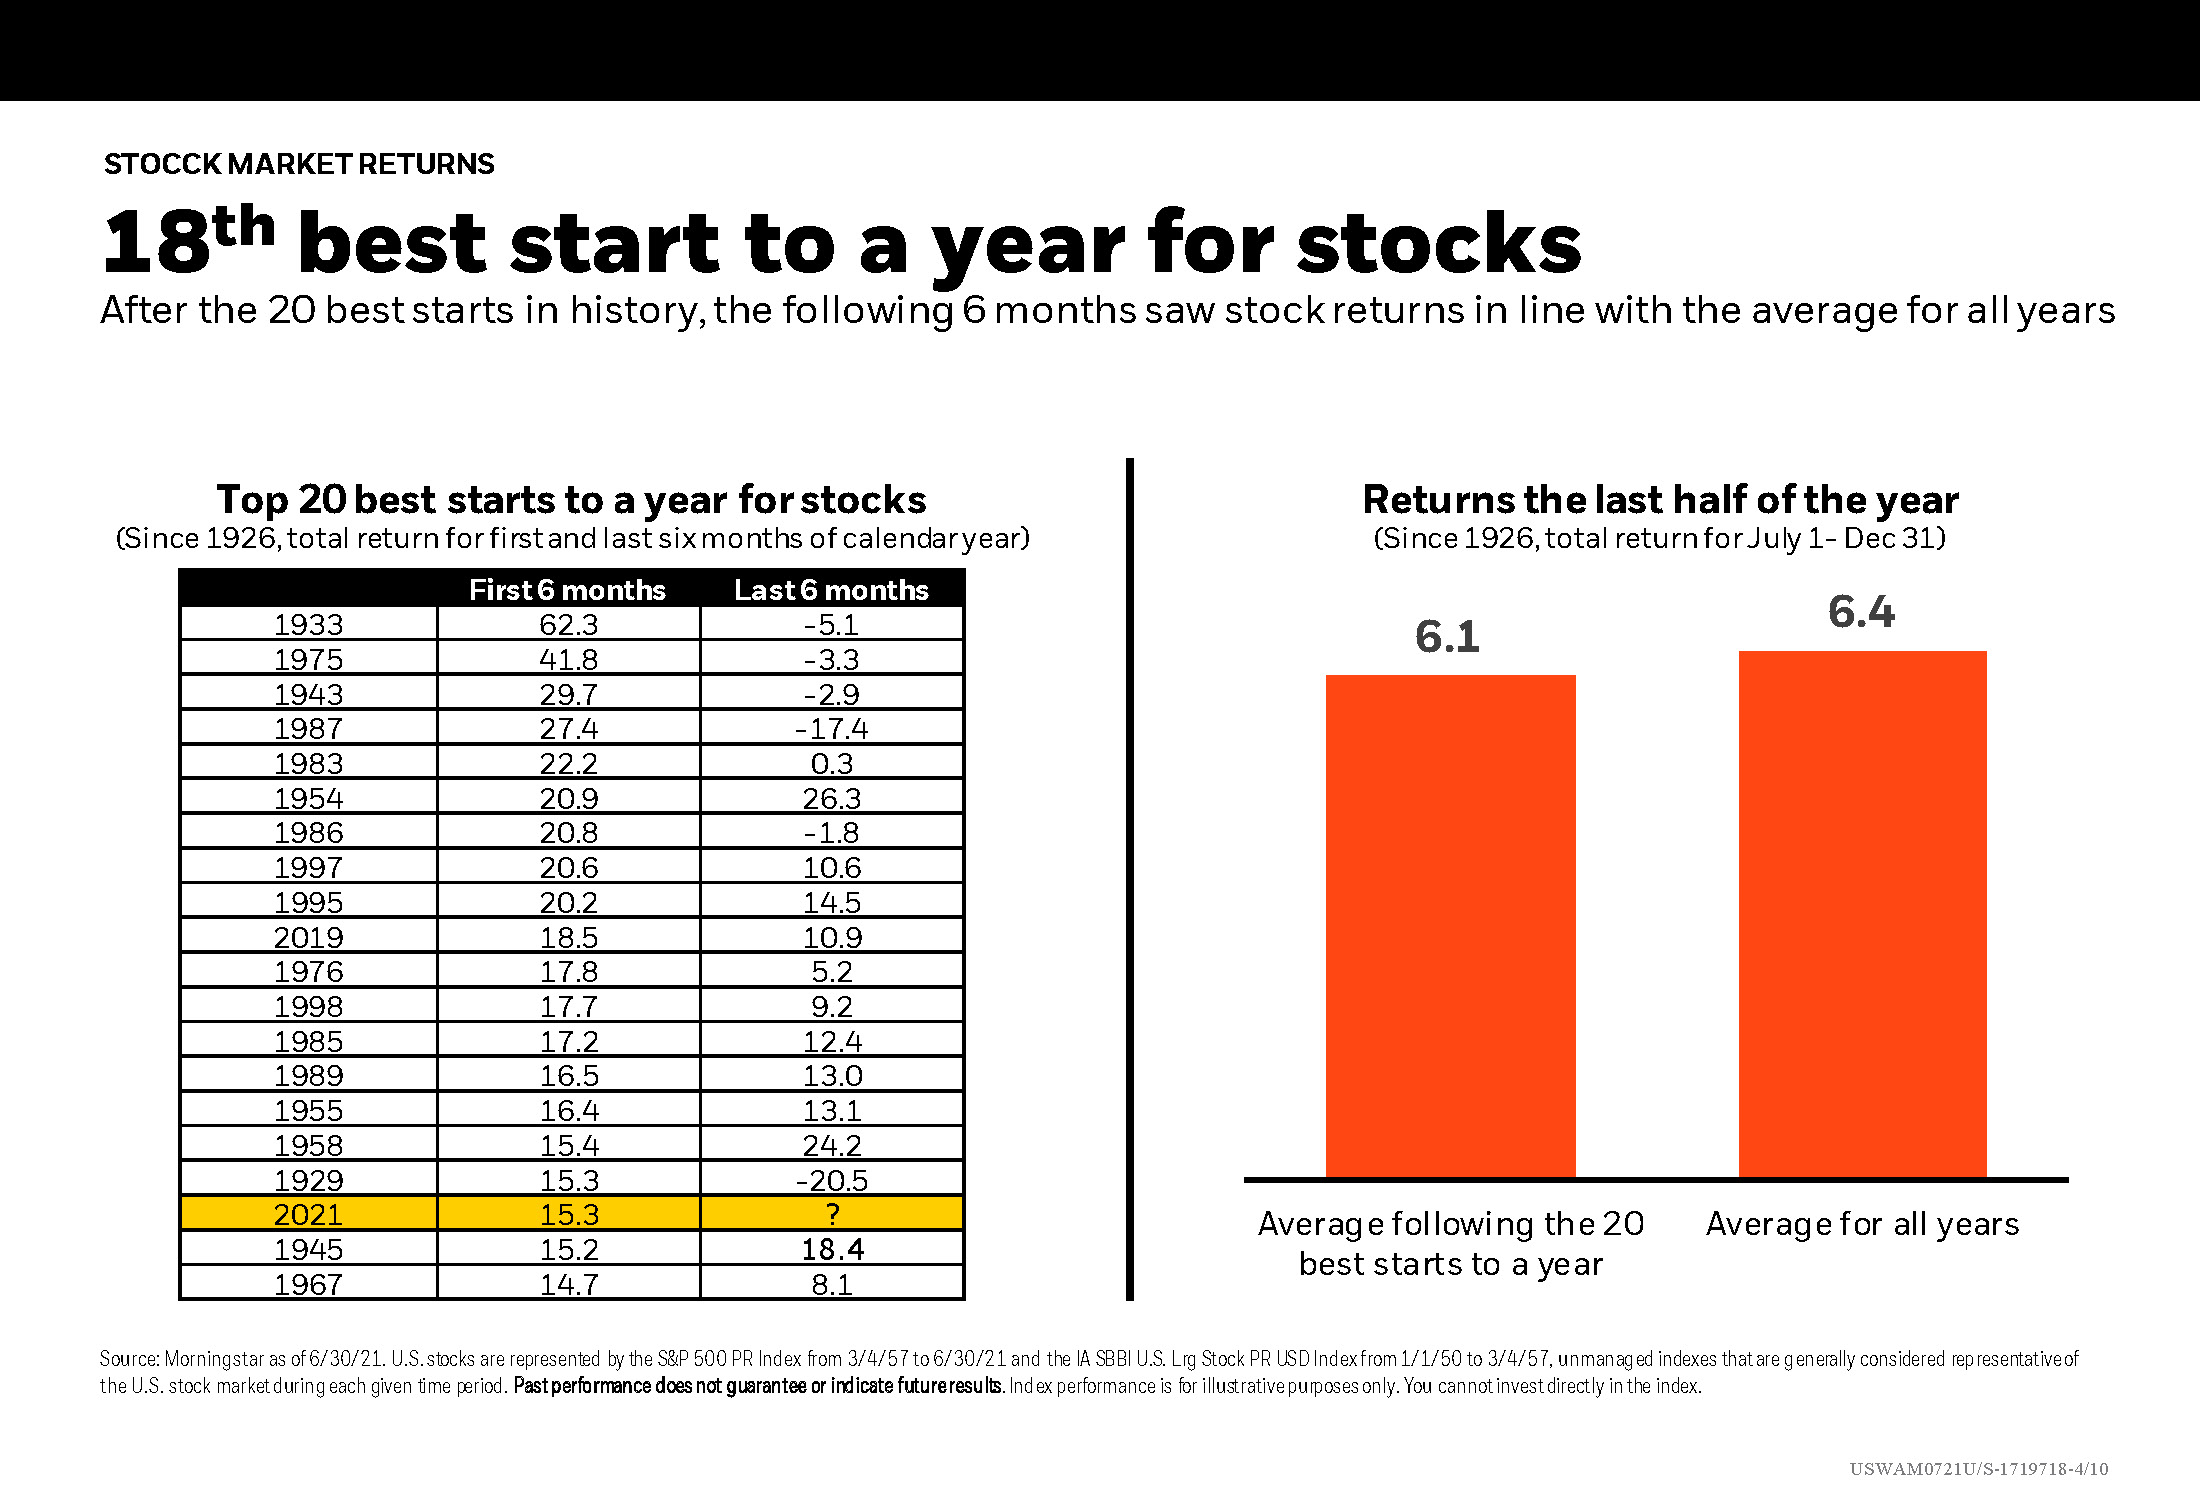
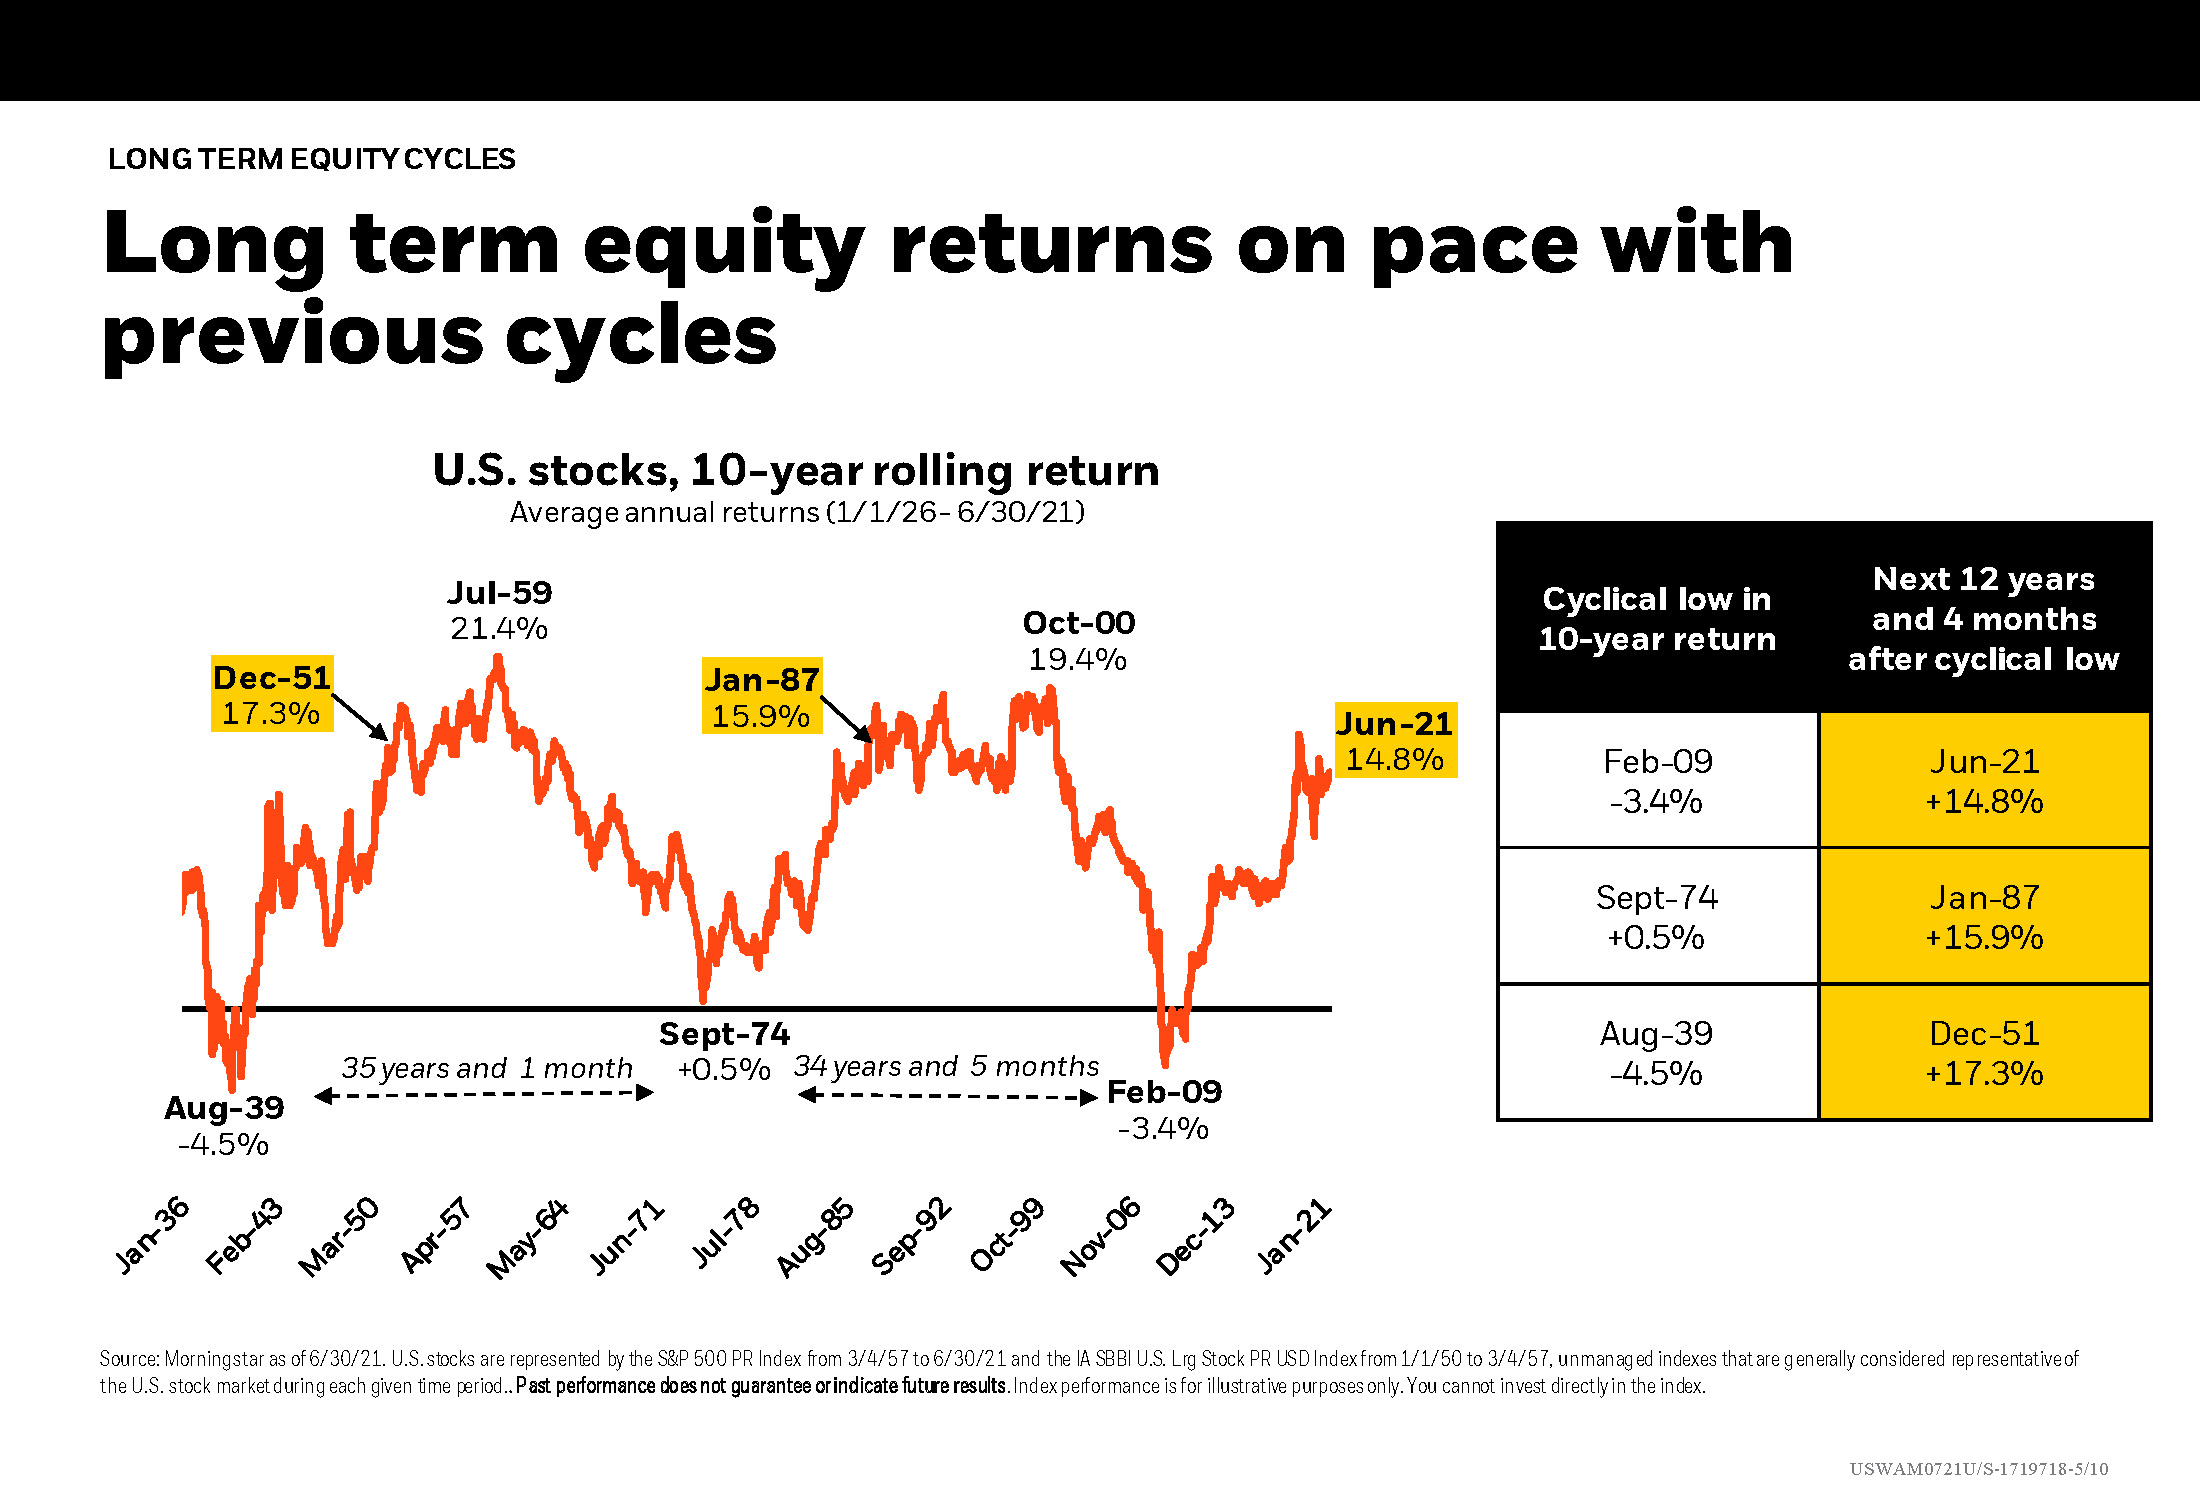
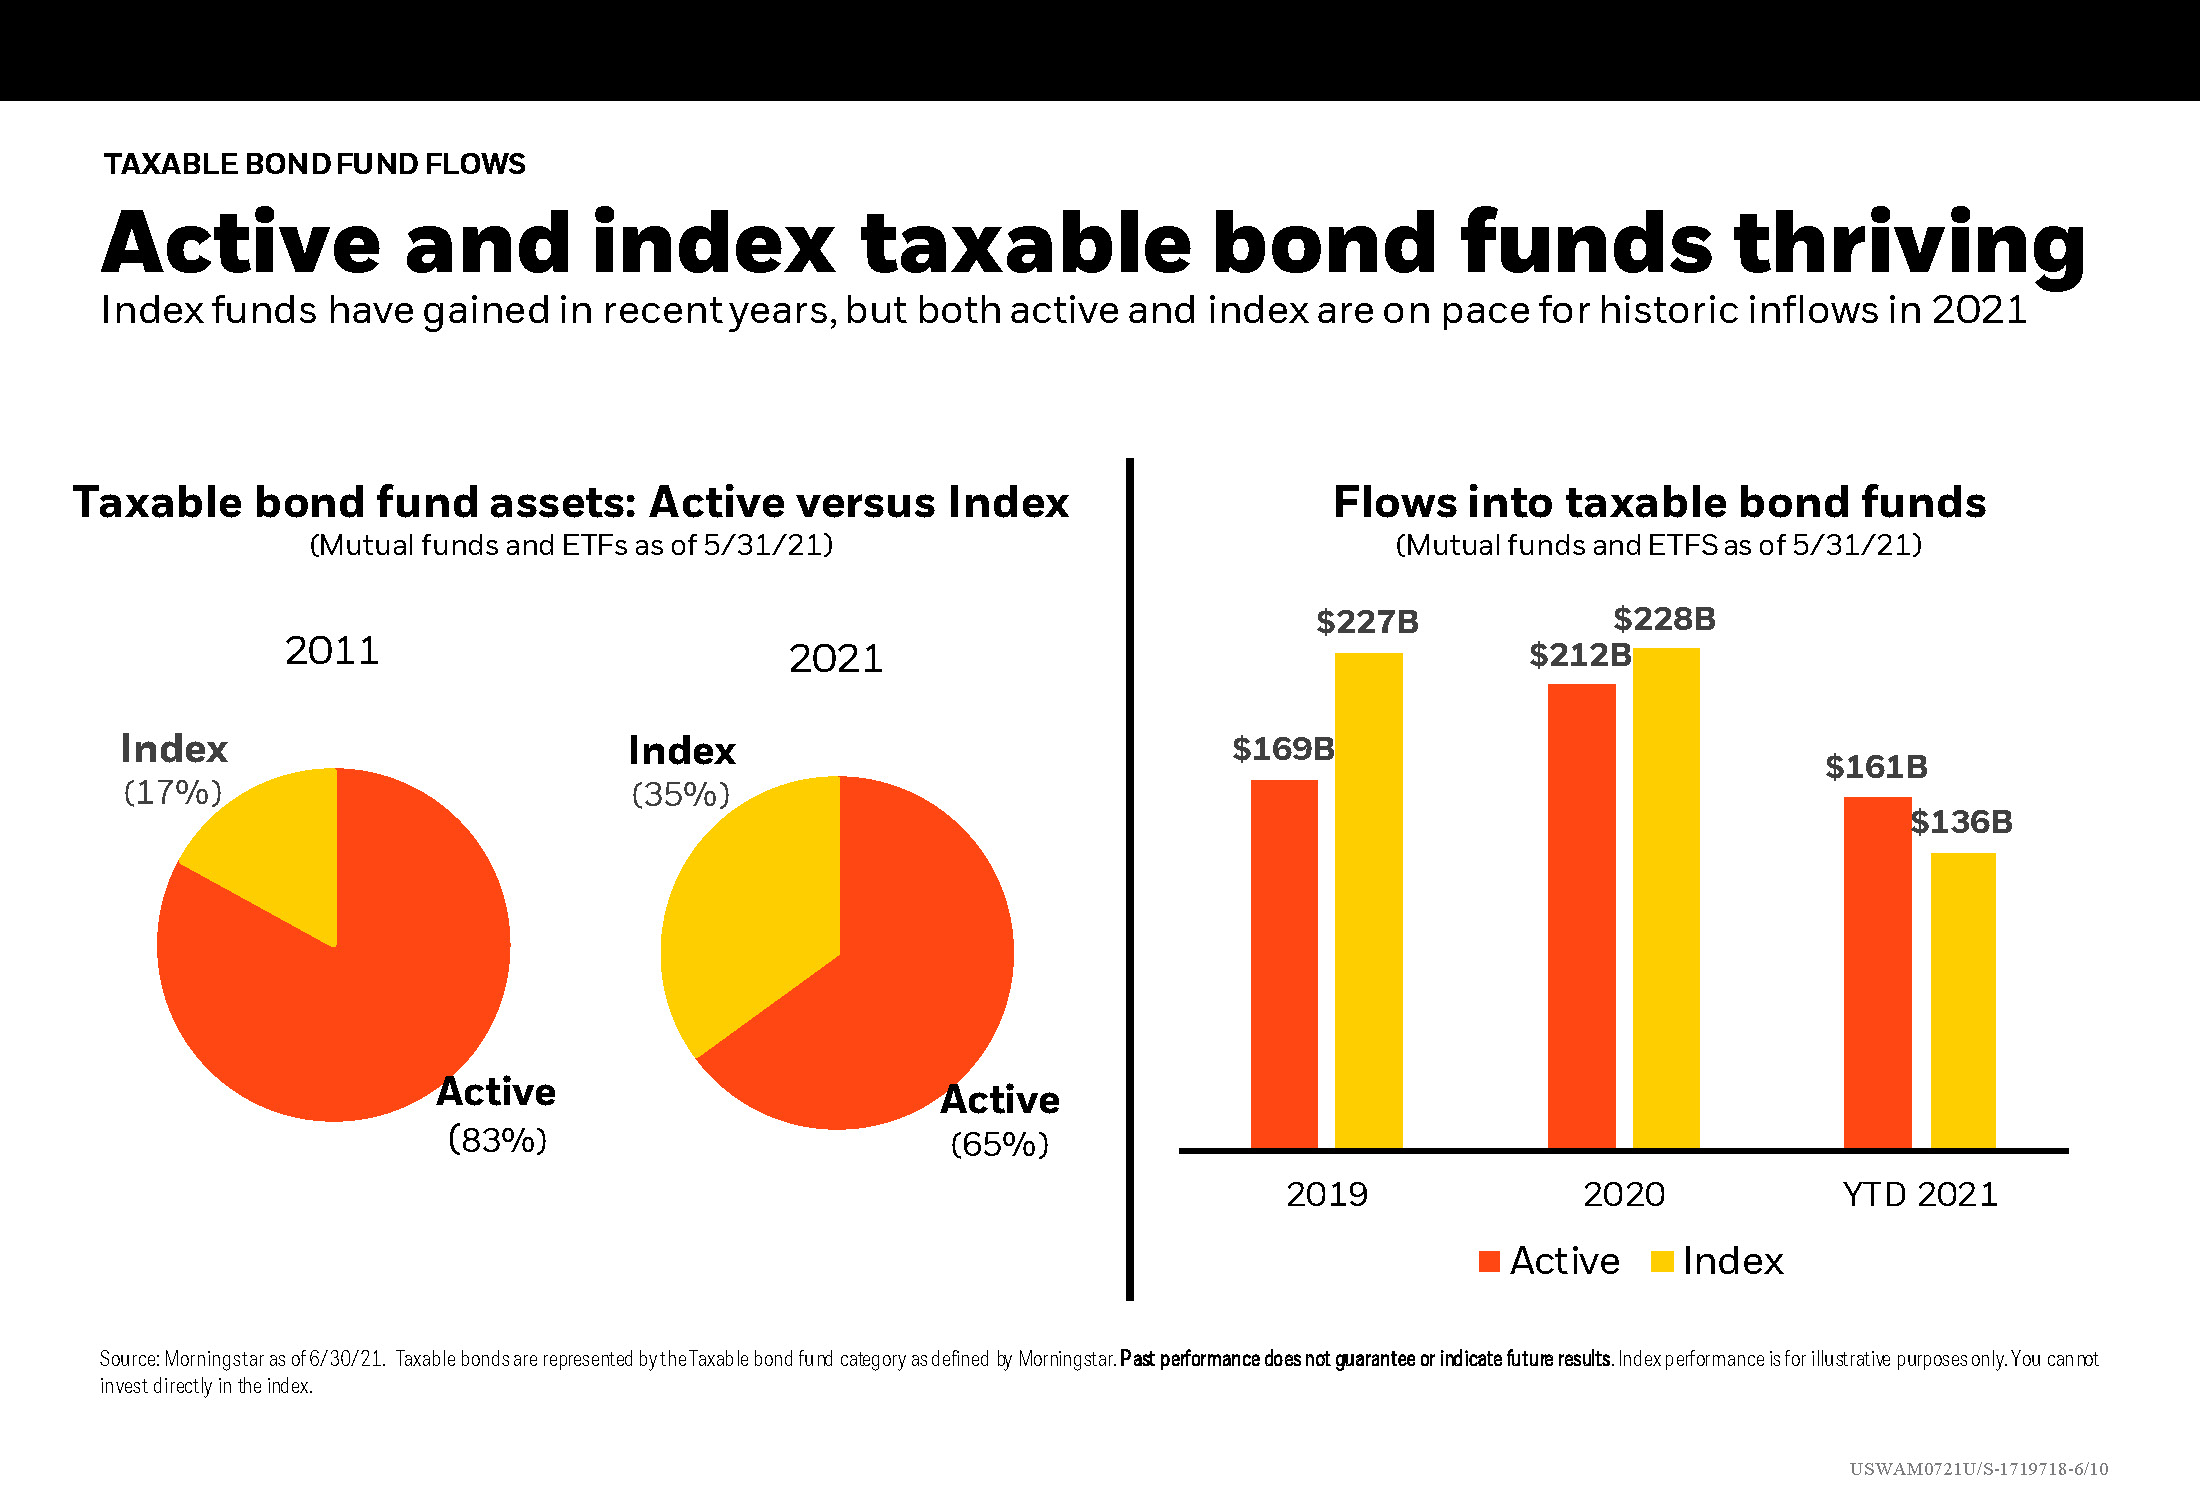
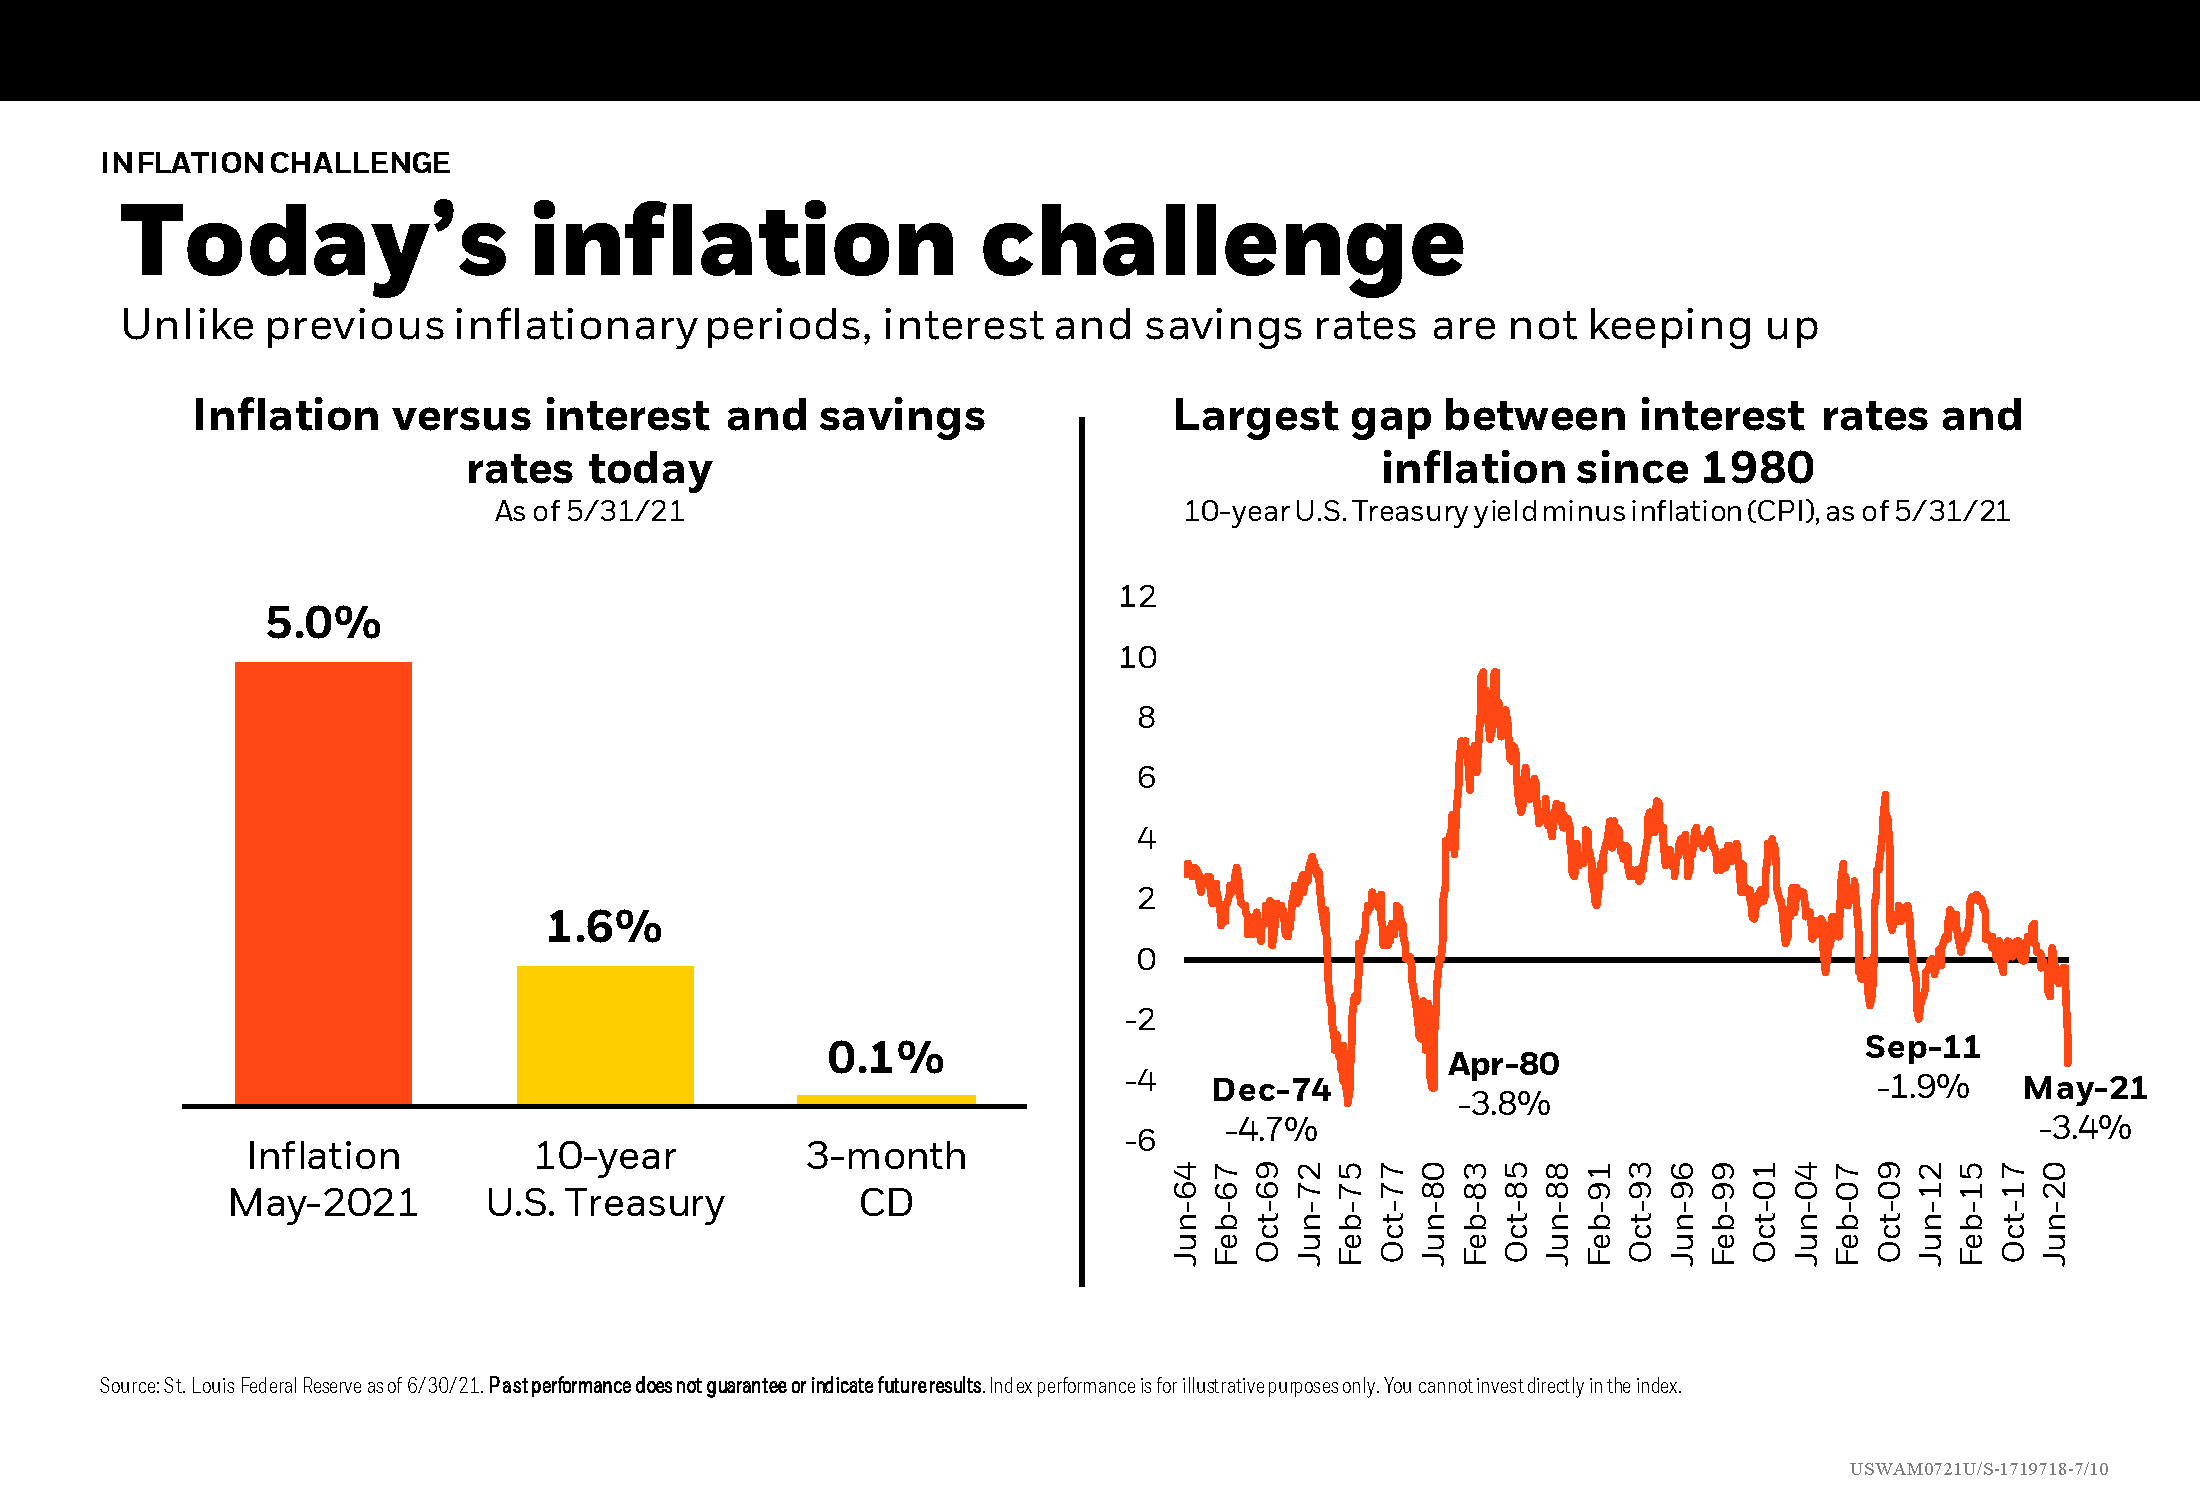
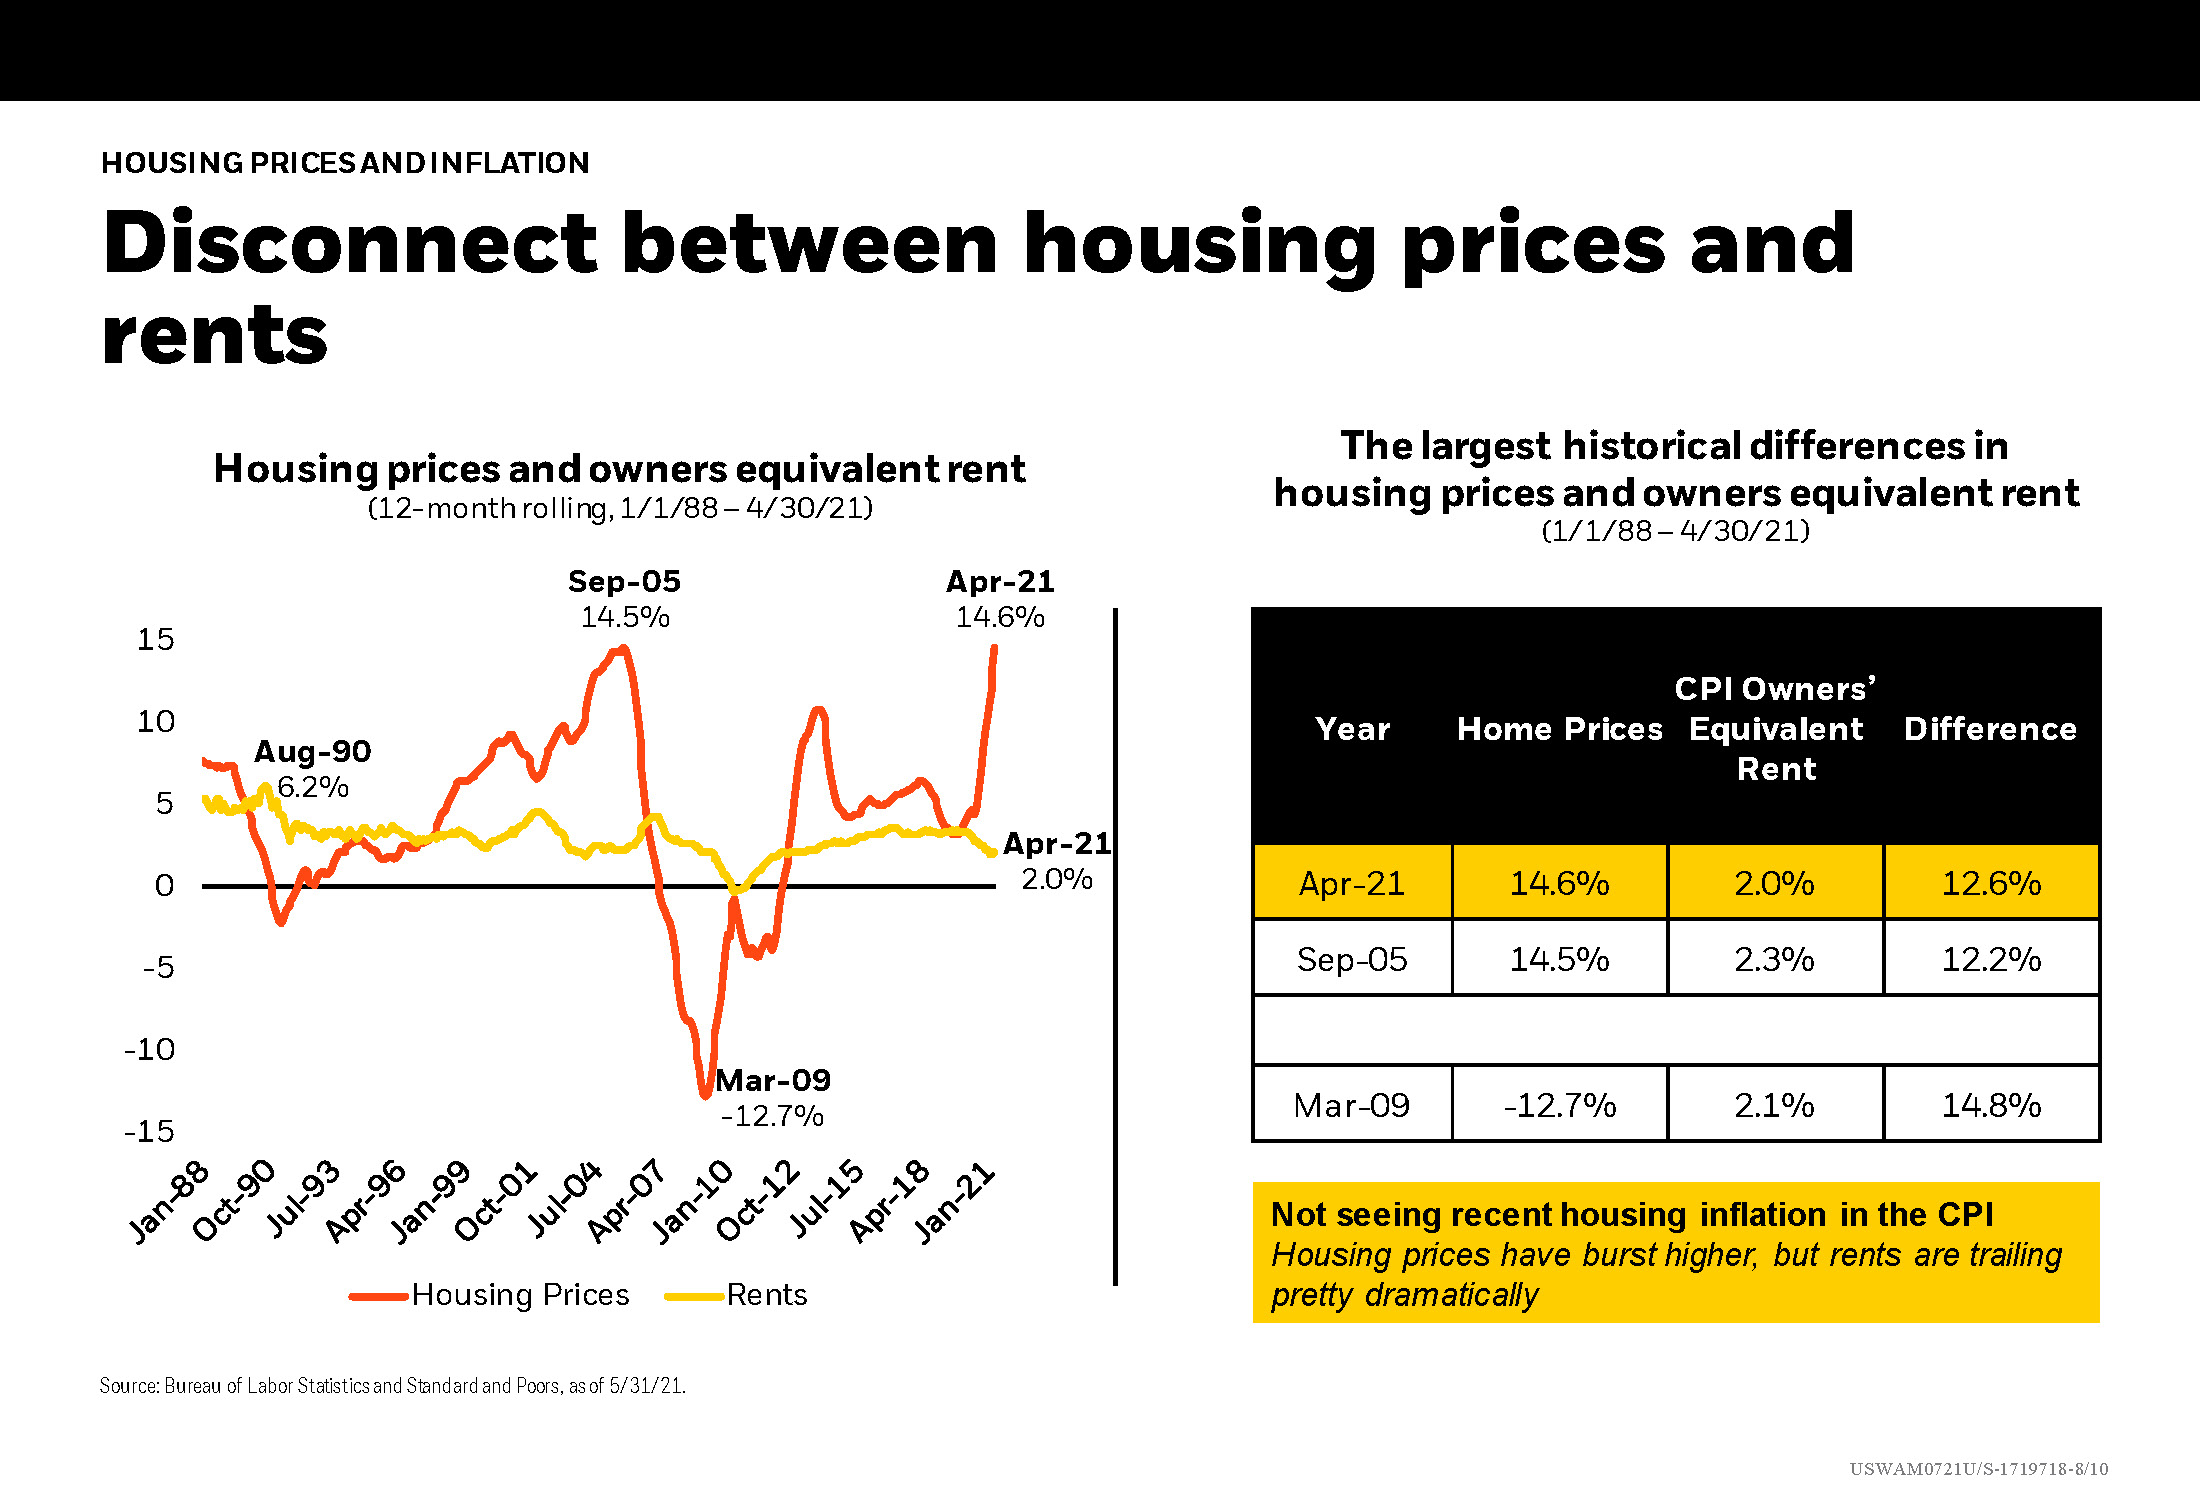
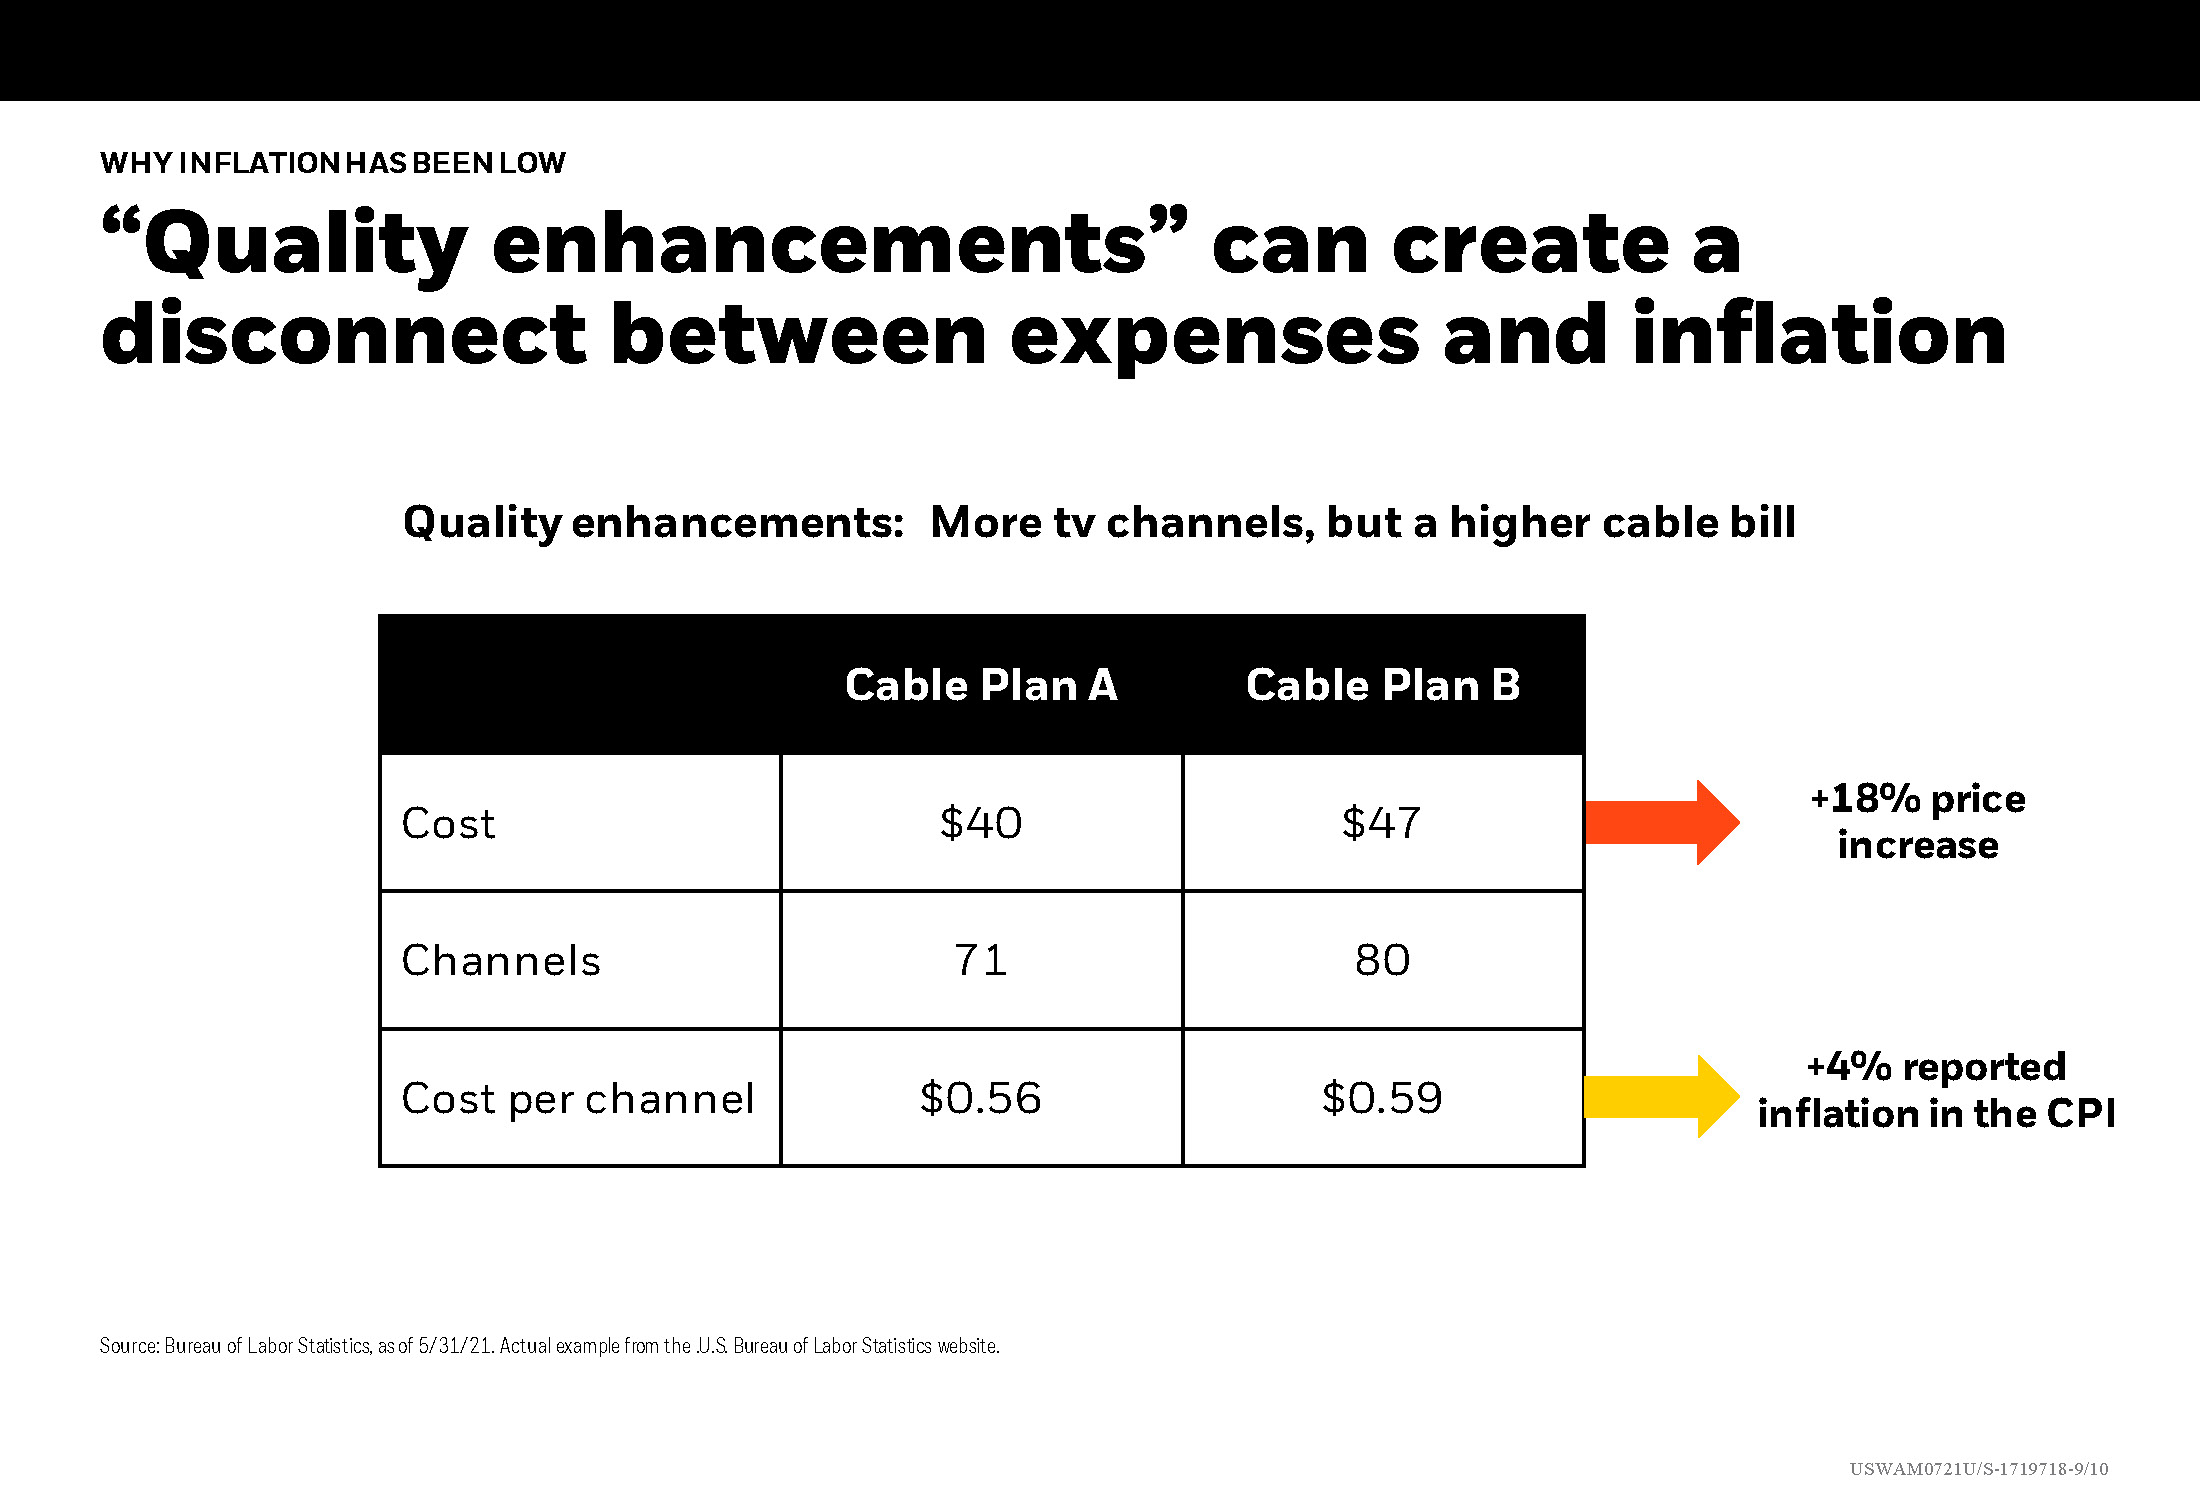
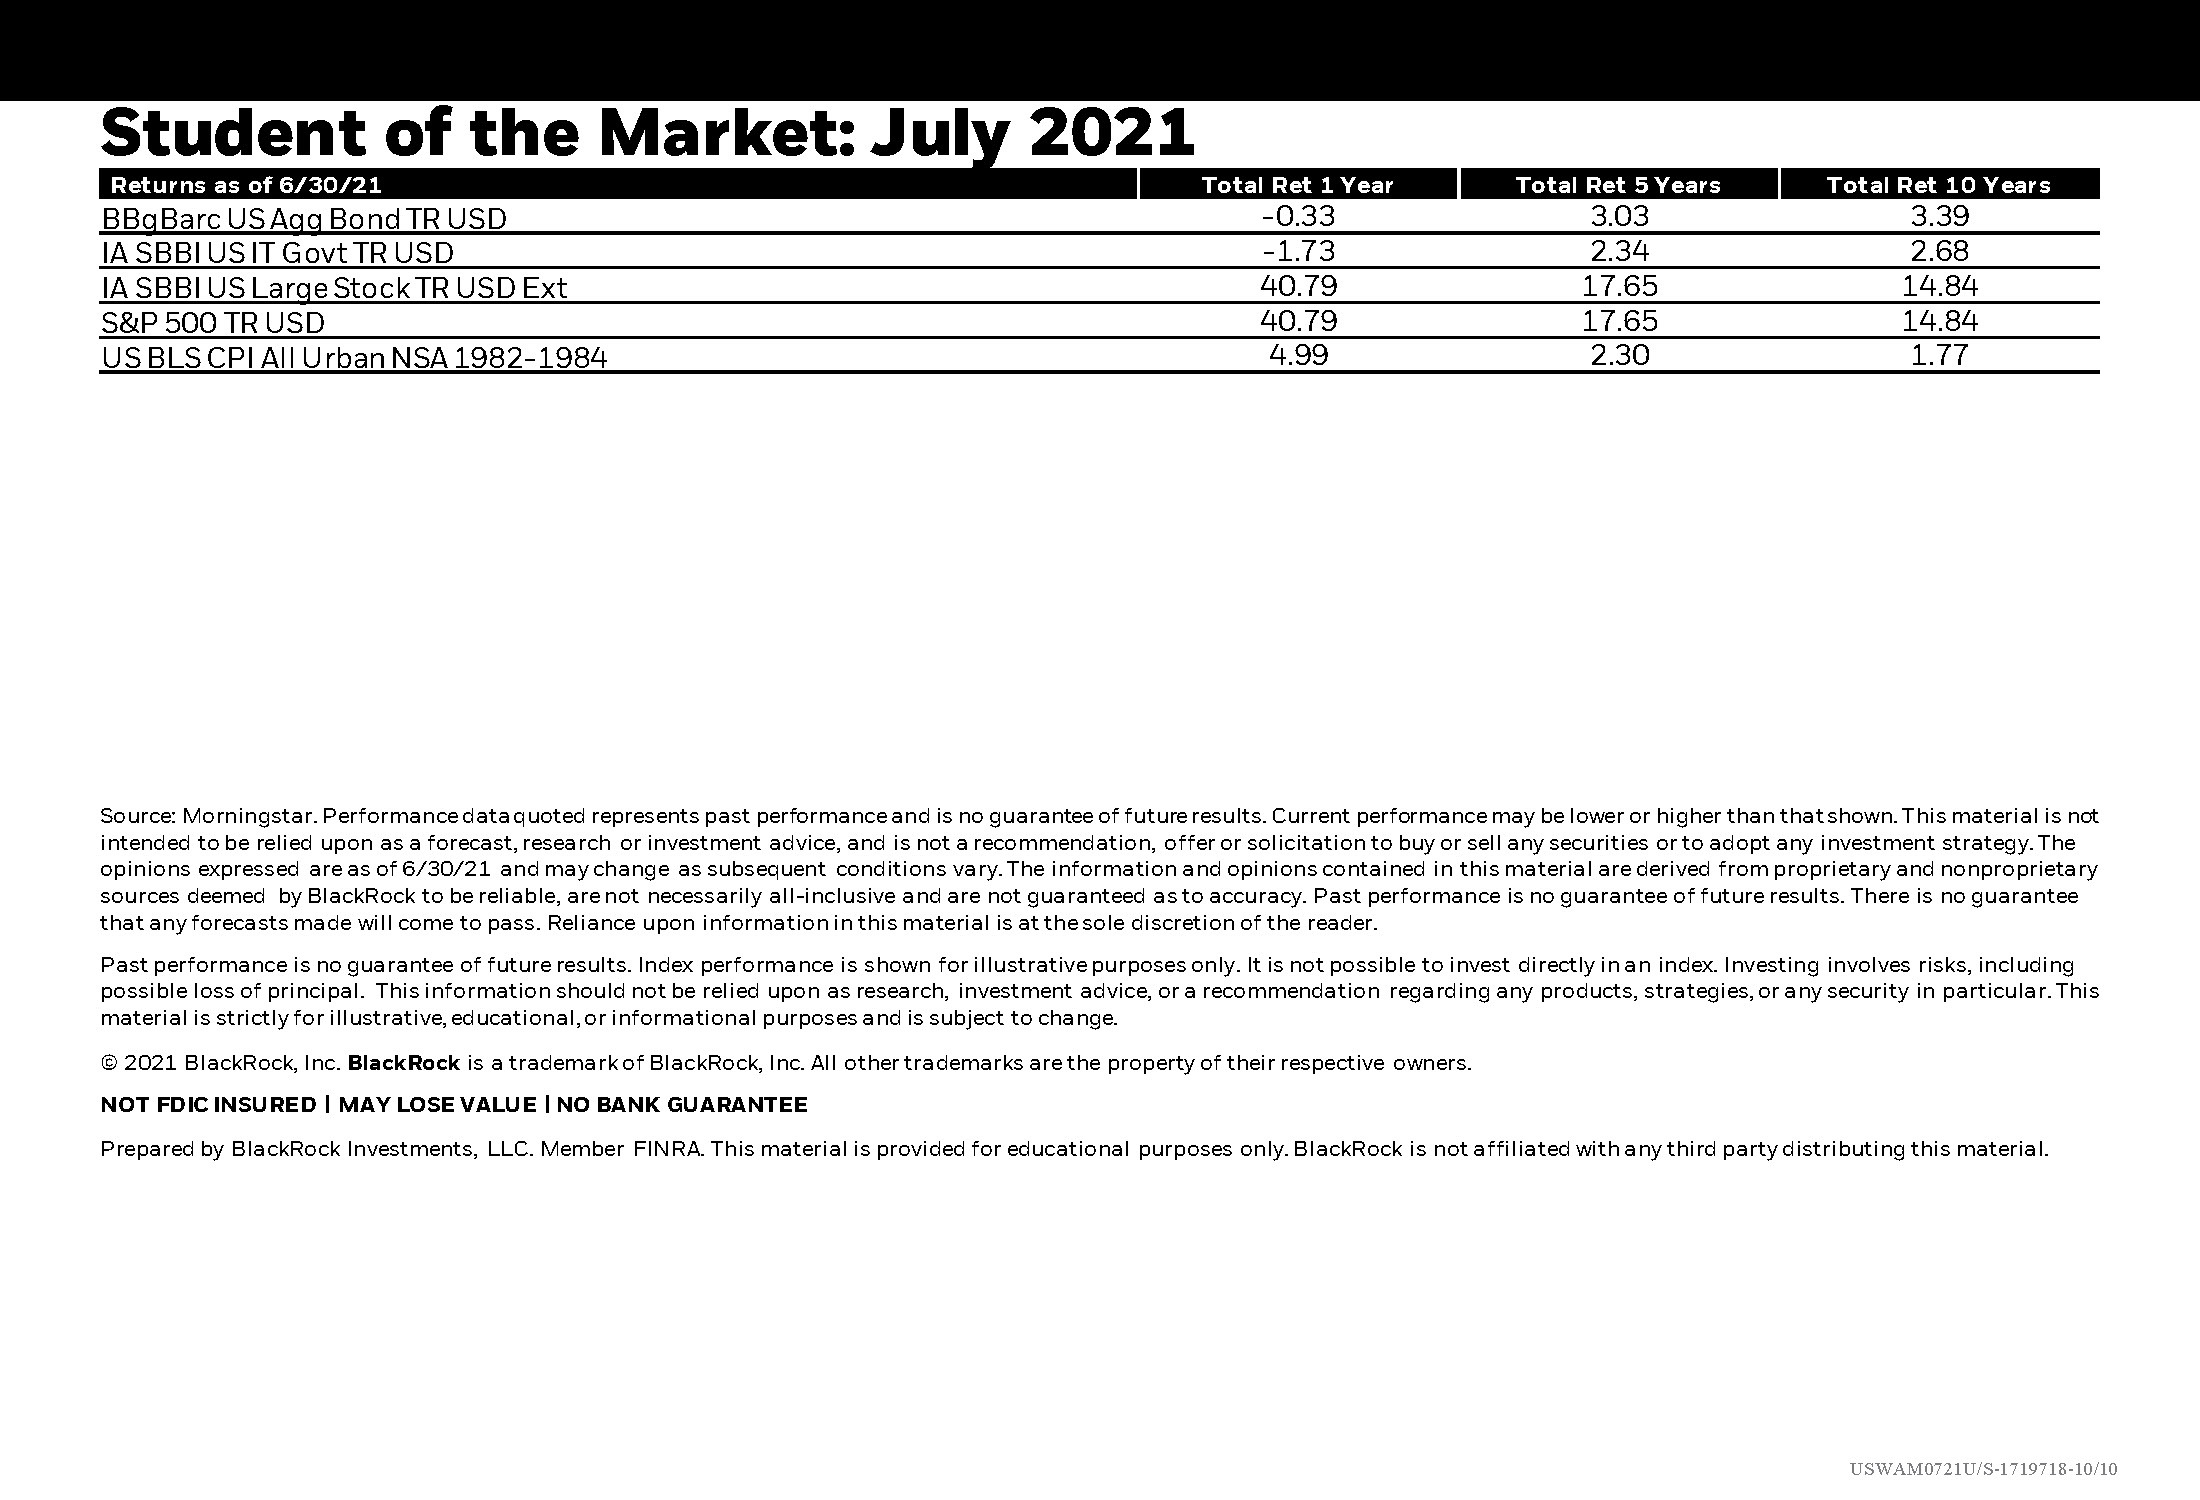
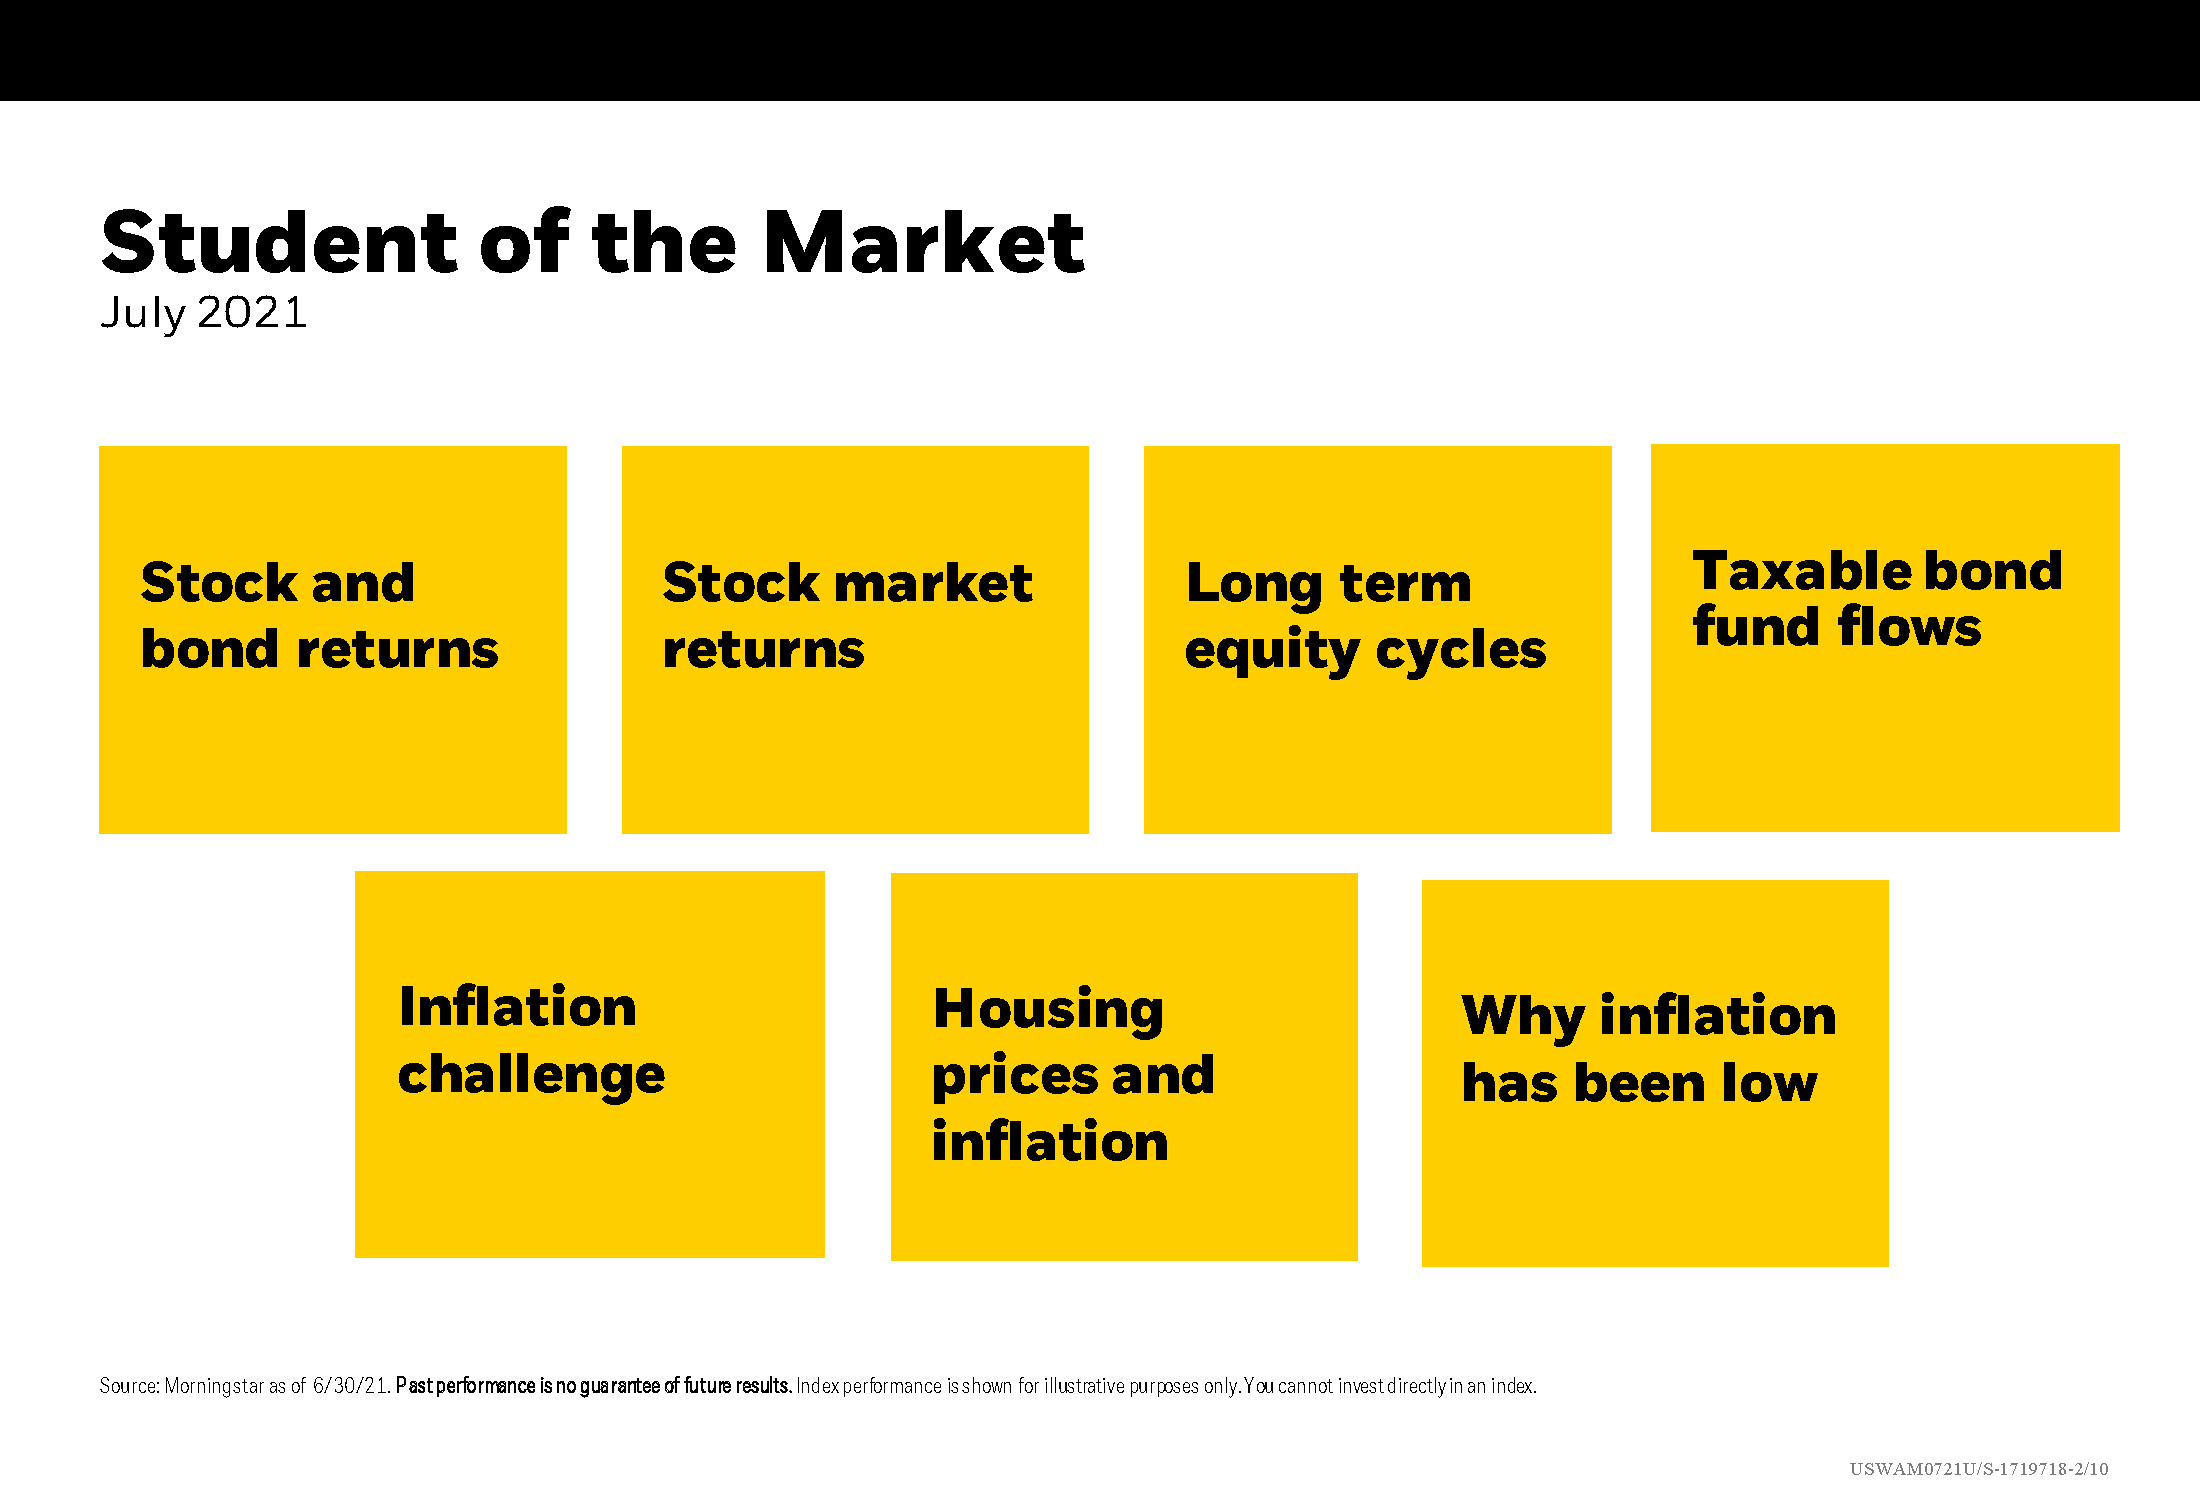
We’ve only seen 4 other time periods since 1926 with back-to-back calendar years of both stock returns above 16% and bond returns above 7%. This Student of the Market for July looks at those stats, along with the top 20 best starts to a year for stocks, long-term equity cycles, taxable bond fund flows and interesting inflation disconnects.

July 21, 2021
Historic Tandem Stock and Bond Returns
Important Disclosure: Content on our website and in our newsletters is for informational purposes only. The information provided may (or may not) directly apply to your situation. We recommend that readers work directly with a professional advisor when making decisions in the context of their specific situation.

Other content you may like

  • Summer Reminds Us to Be Flexible

    Summer Reminds Us to Be Flexible

    July 16, 2023
    No one knows what tomorrow will bring. Your financial plan must be adaptable too. You don’t just set it and forget it. So how does someone grasp a fast-changing world to formulate a job or career strategy, and an investment strategy to accumulate capital needed to fund their secure future?
    Read this Article
  • Podcast Highlight - Fed Forecasts & Policy

    November 21, 2023
    Discussion centers around how inflation is tightly correlated with economic growth and the outlook, along with how outlook models have been working.
    Read this Article
  • Podcast Highlight 1 - Market Recap

    Podcast Highlight 4 - Market Saturation and AI

    June 3, 2024
    Discussing the inevitability of market saturation, the Strong Valley advisor team talks about how that looks, how it affects growth and how the market responds.
    Read this Article
  • Historic Bear Market in Bonds

    Historic Bear Market in Bonds

    October 24, 2022
    As market volatility continues and the mid-term election draws rapidly near, this month’s Student of the Market gives insight into the relationship between midterm election years and market performance. You might be surprised to see the breakdown of U.S. stock sector performance for the last five Presidents. Also stats on performance following peaks in inflation and performance 12 months after bad starts for bonds/stocks, may bring some relief.
    Read this Article
  • The link you have selected is located on another server. The linked site contains information that has been created, published, maintained, or otherwise posted by institutions or organizations independent of this organization. We do not endorse, approve, certify, or control any linked websites, their sponsors, or any of their policies, activities, products, or services. We do not assume responsibility for the accuracy, completeness, or timeliness of the information contained therein. Visitors to any linked websites should not use or rely on the information contained therein until they have consulted with an independent financial professional. Please click “Continue to Link” to leave this website and proceed to the selected site.
    phone-handset