Article

Large Cap Stock Outperformance

Large Cap Stock Outperformance

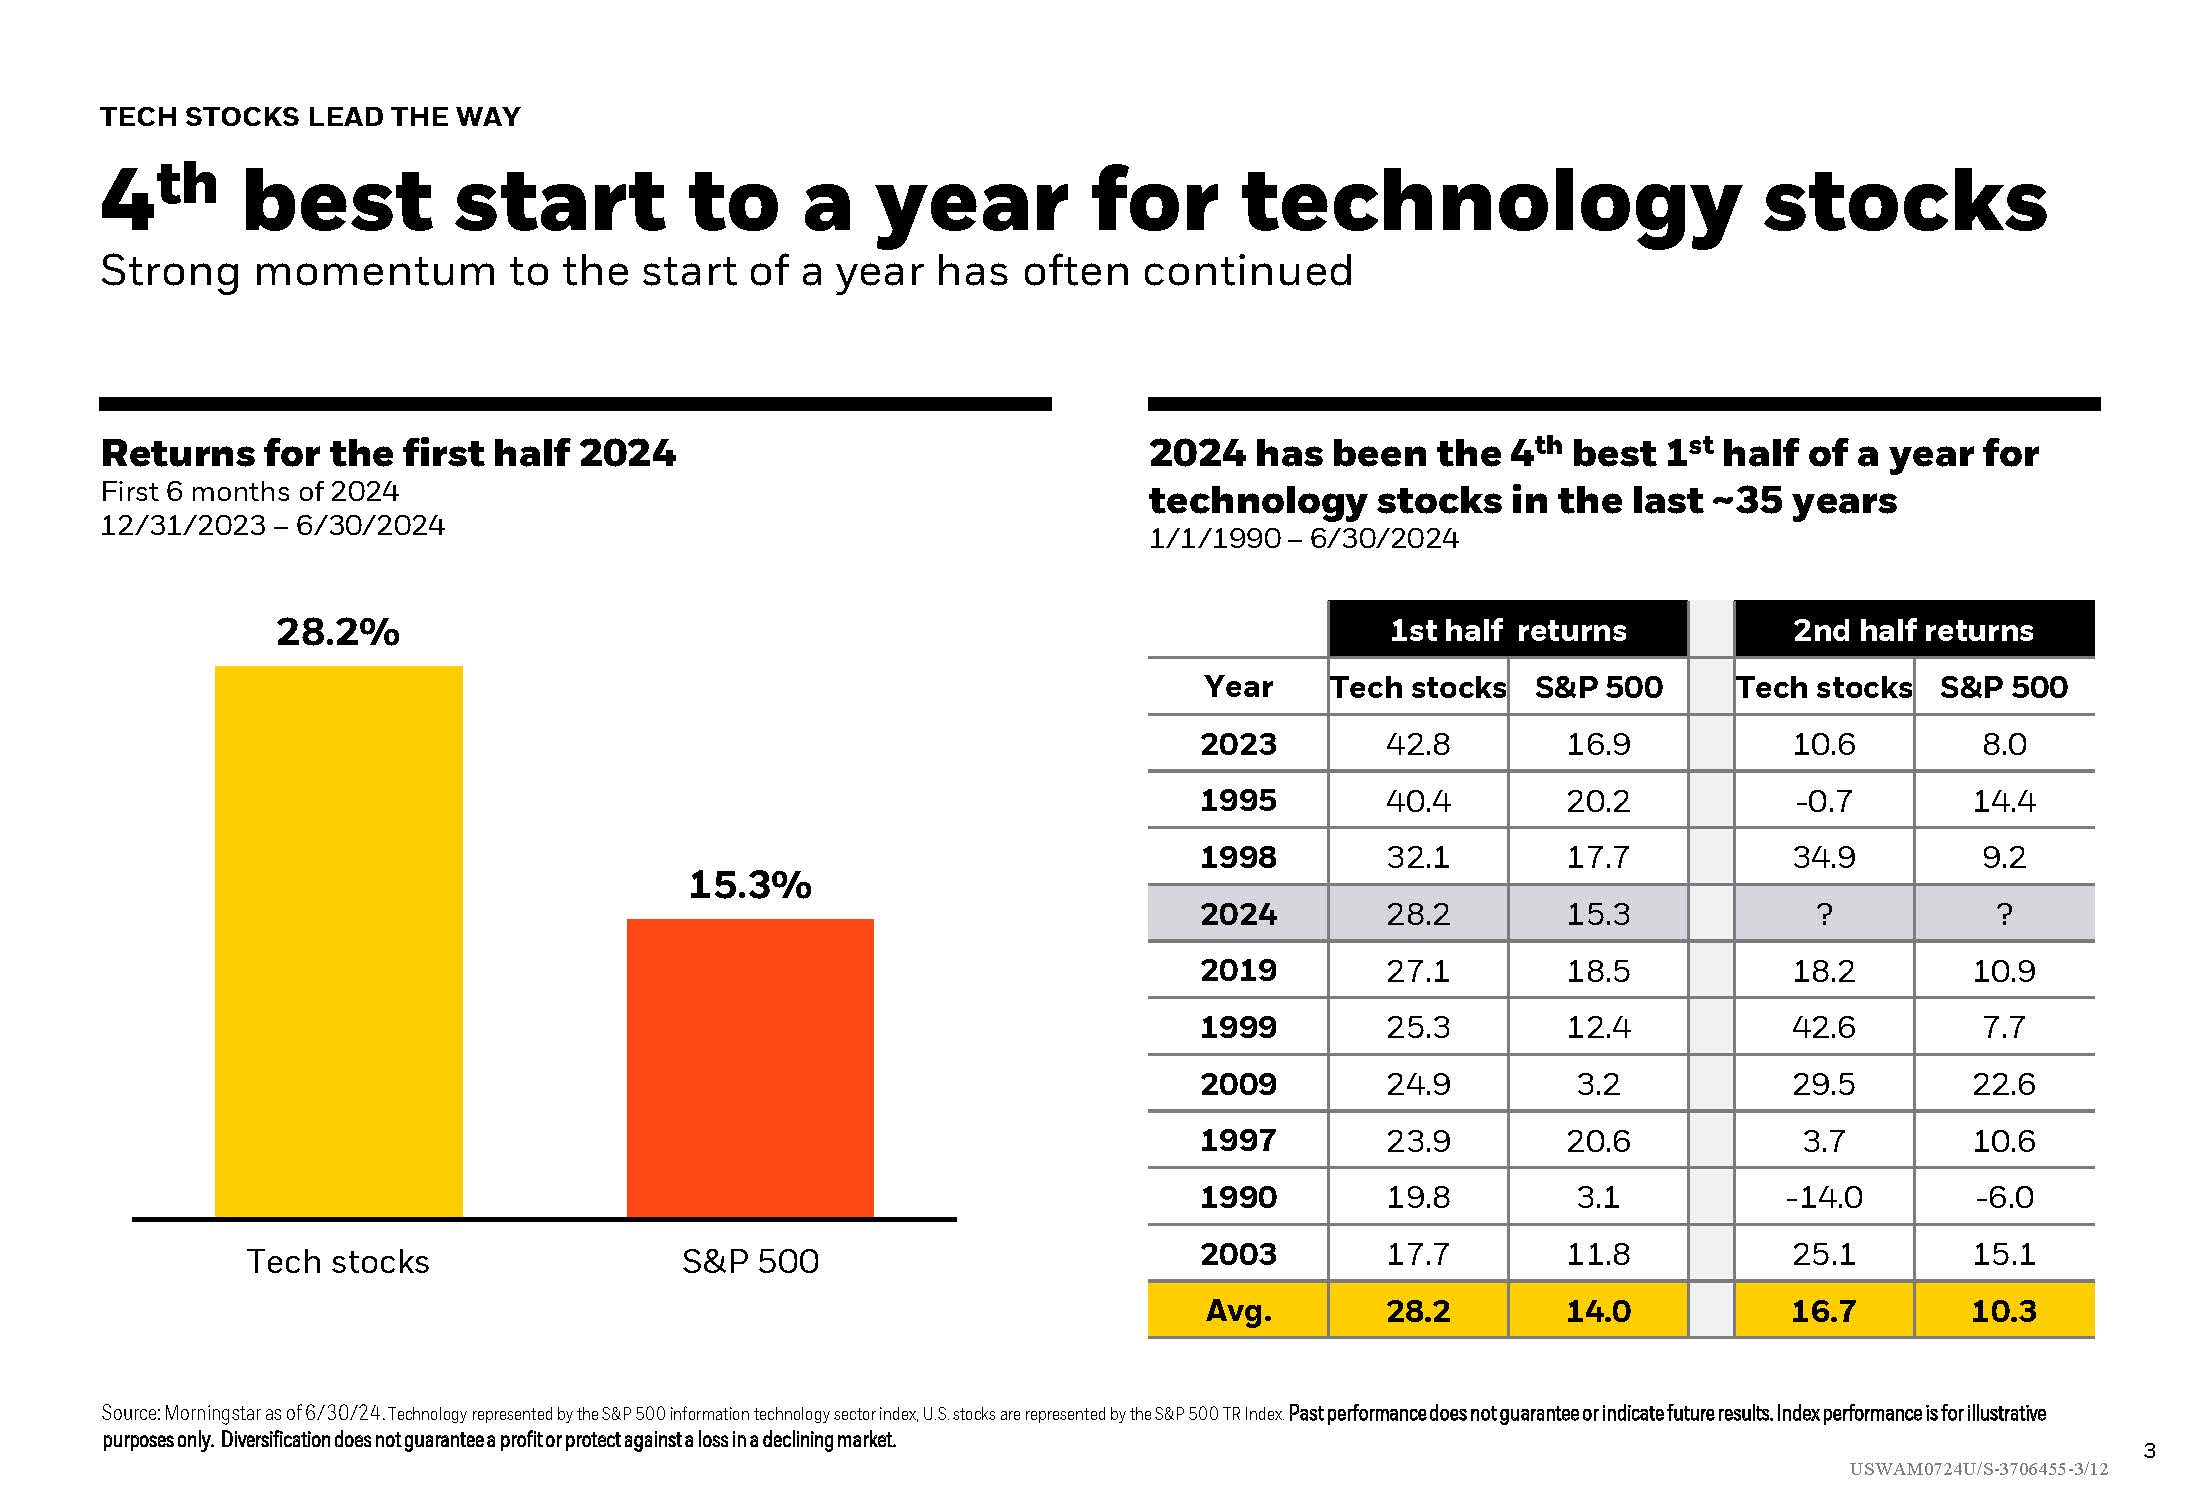
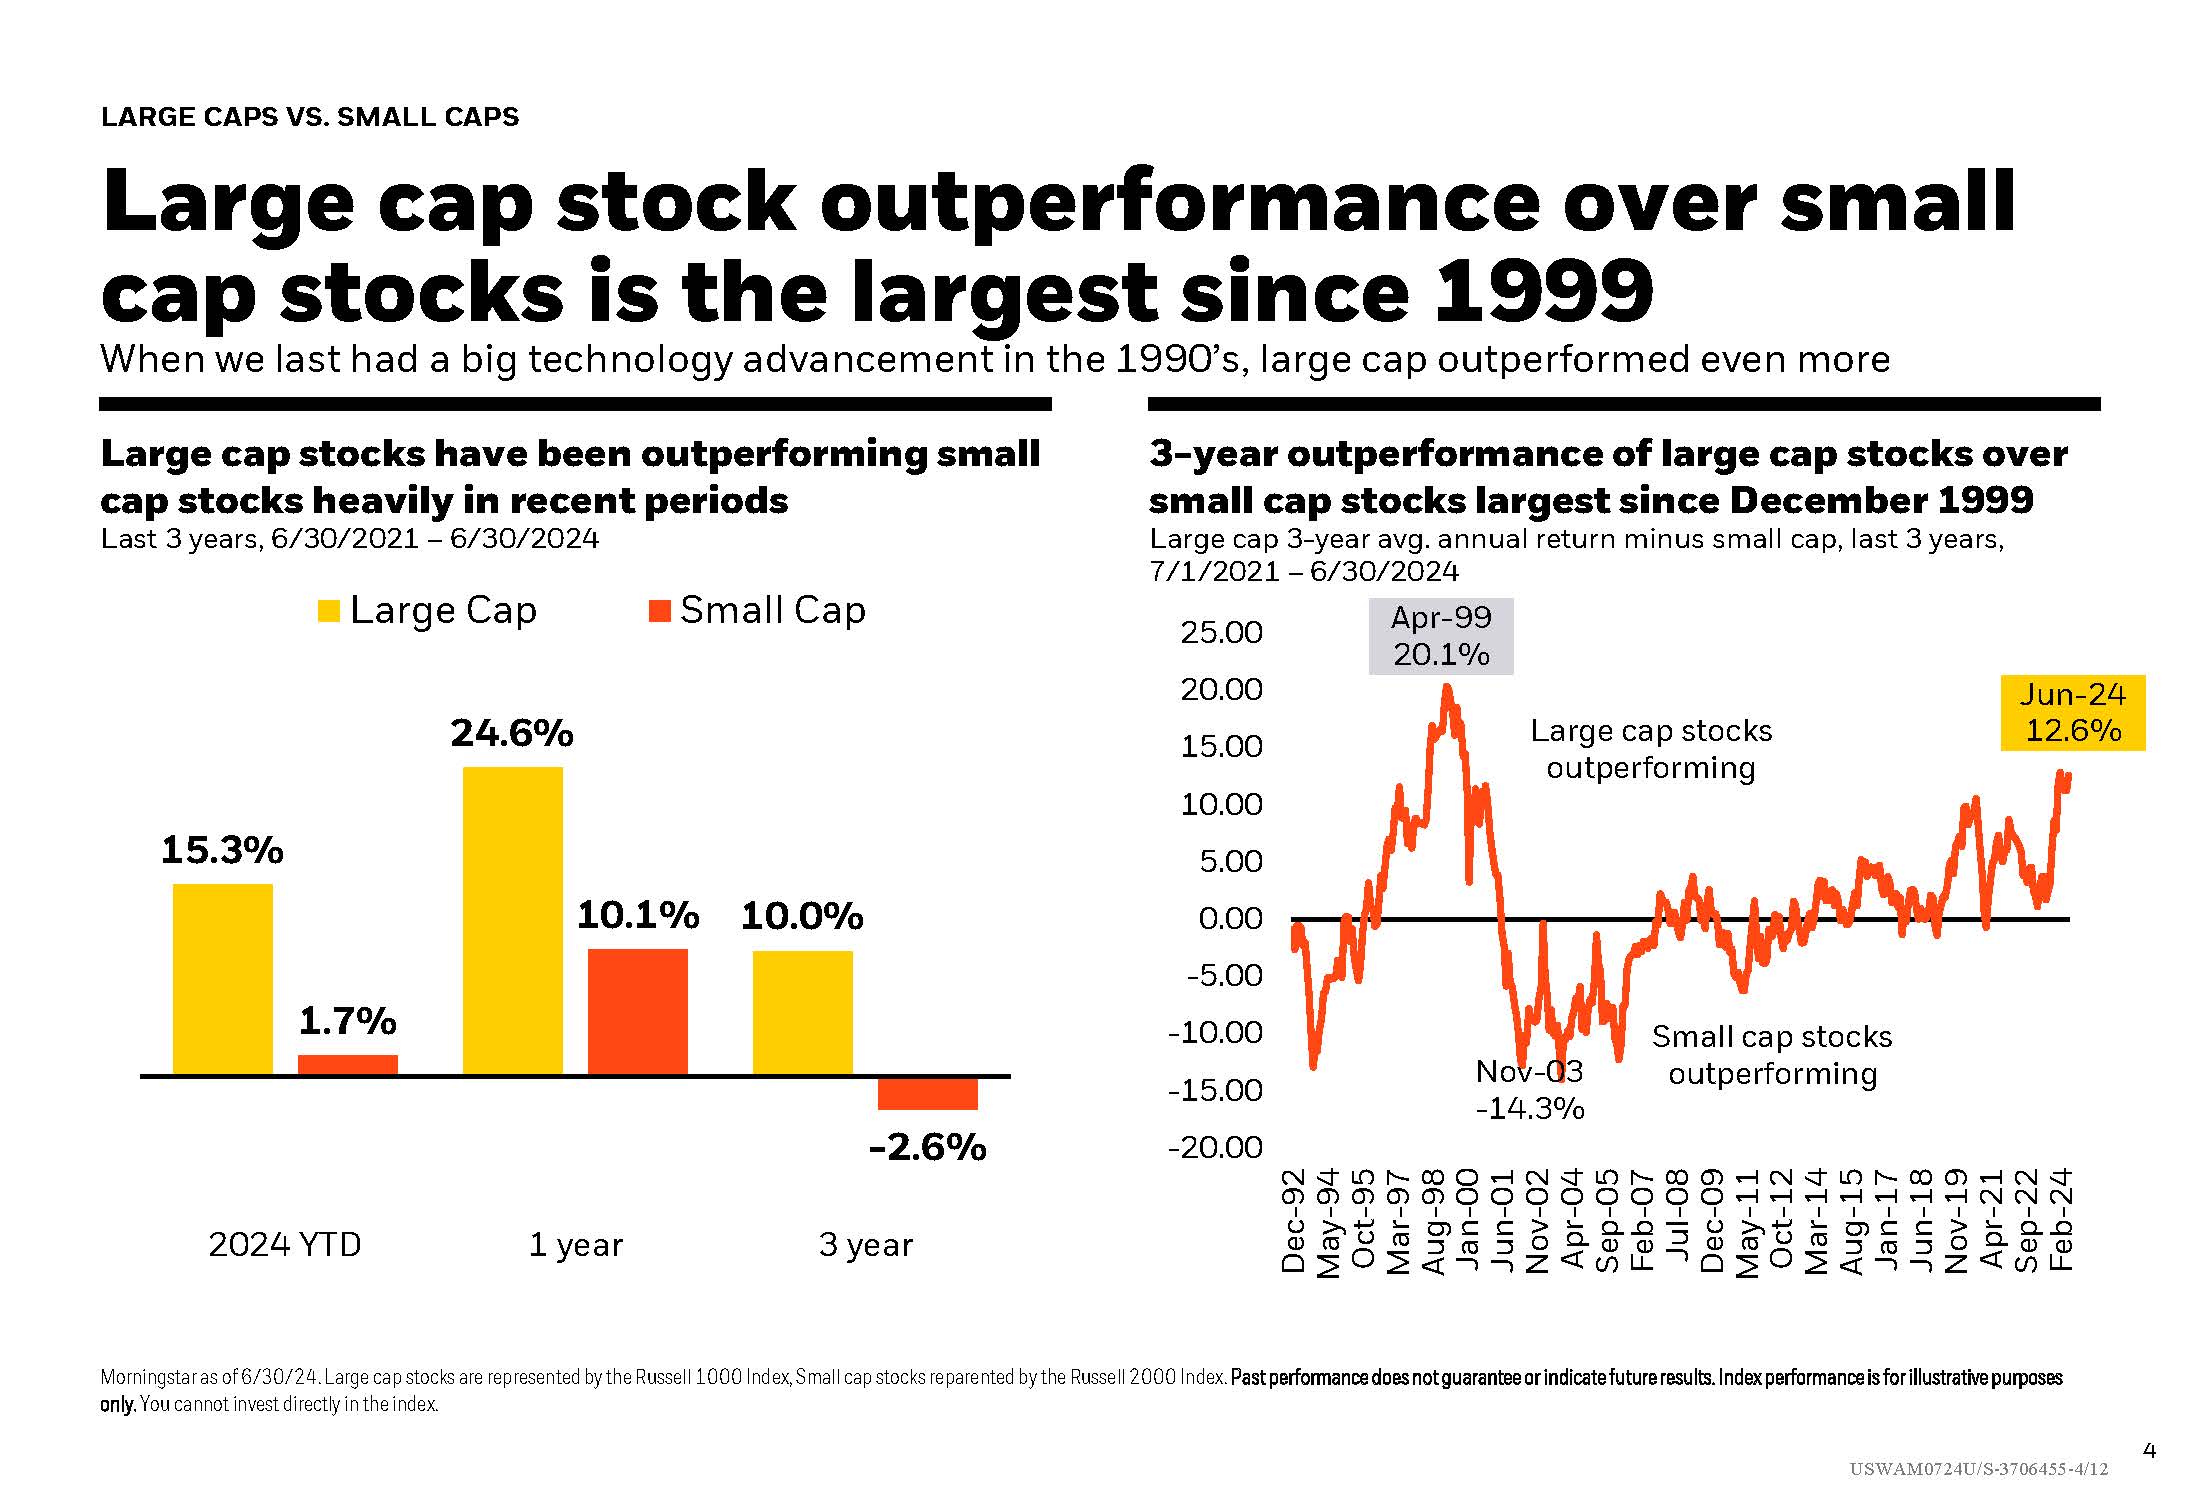
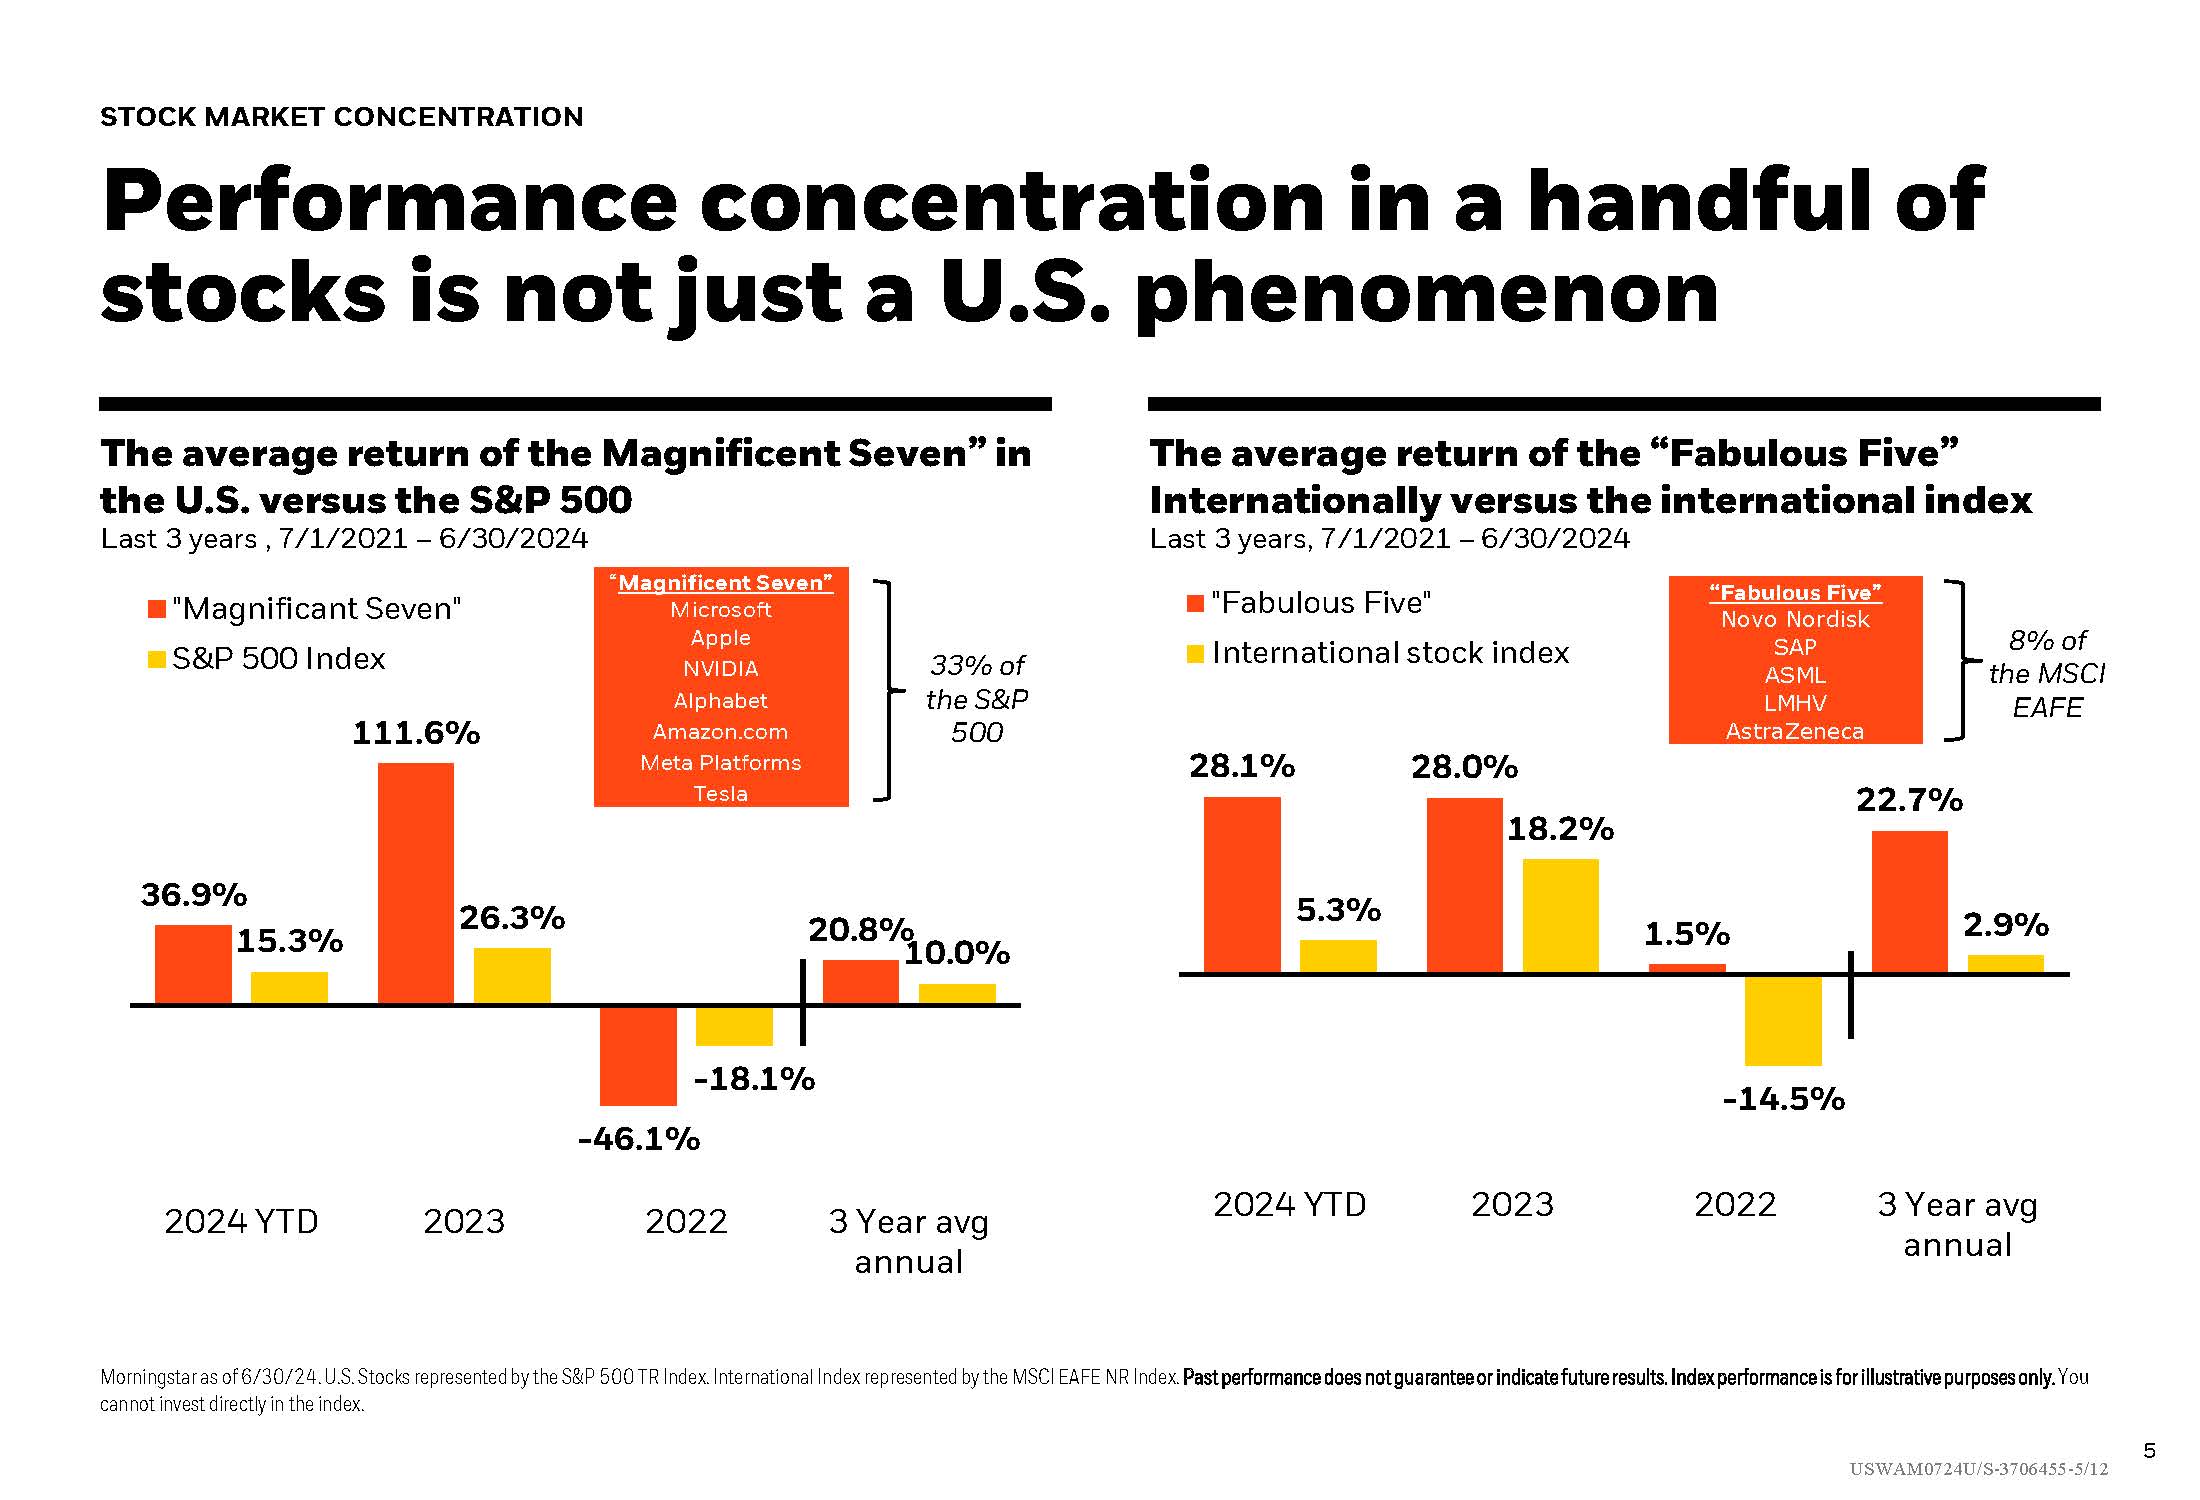
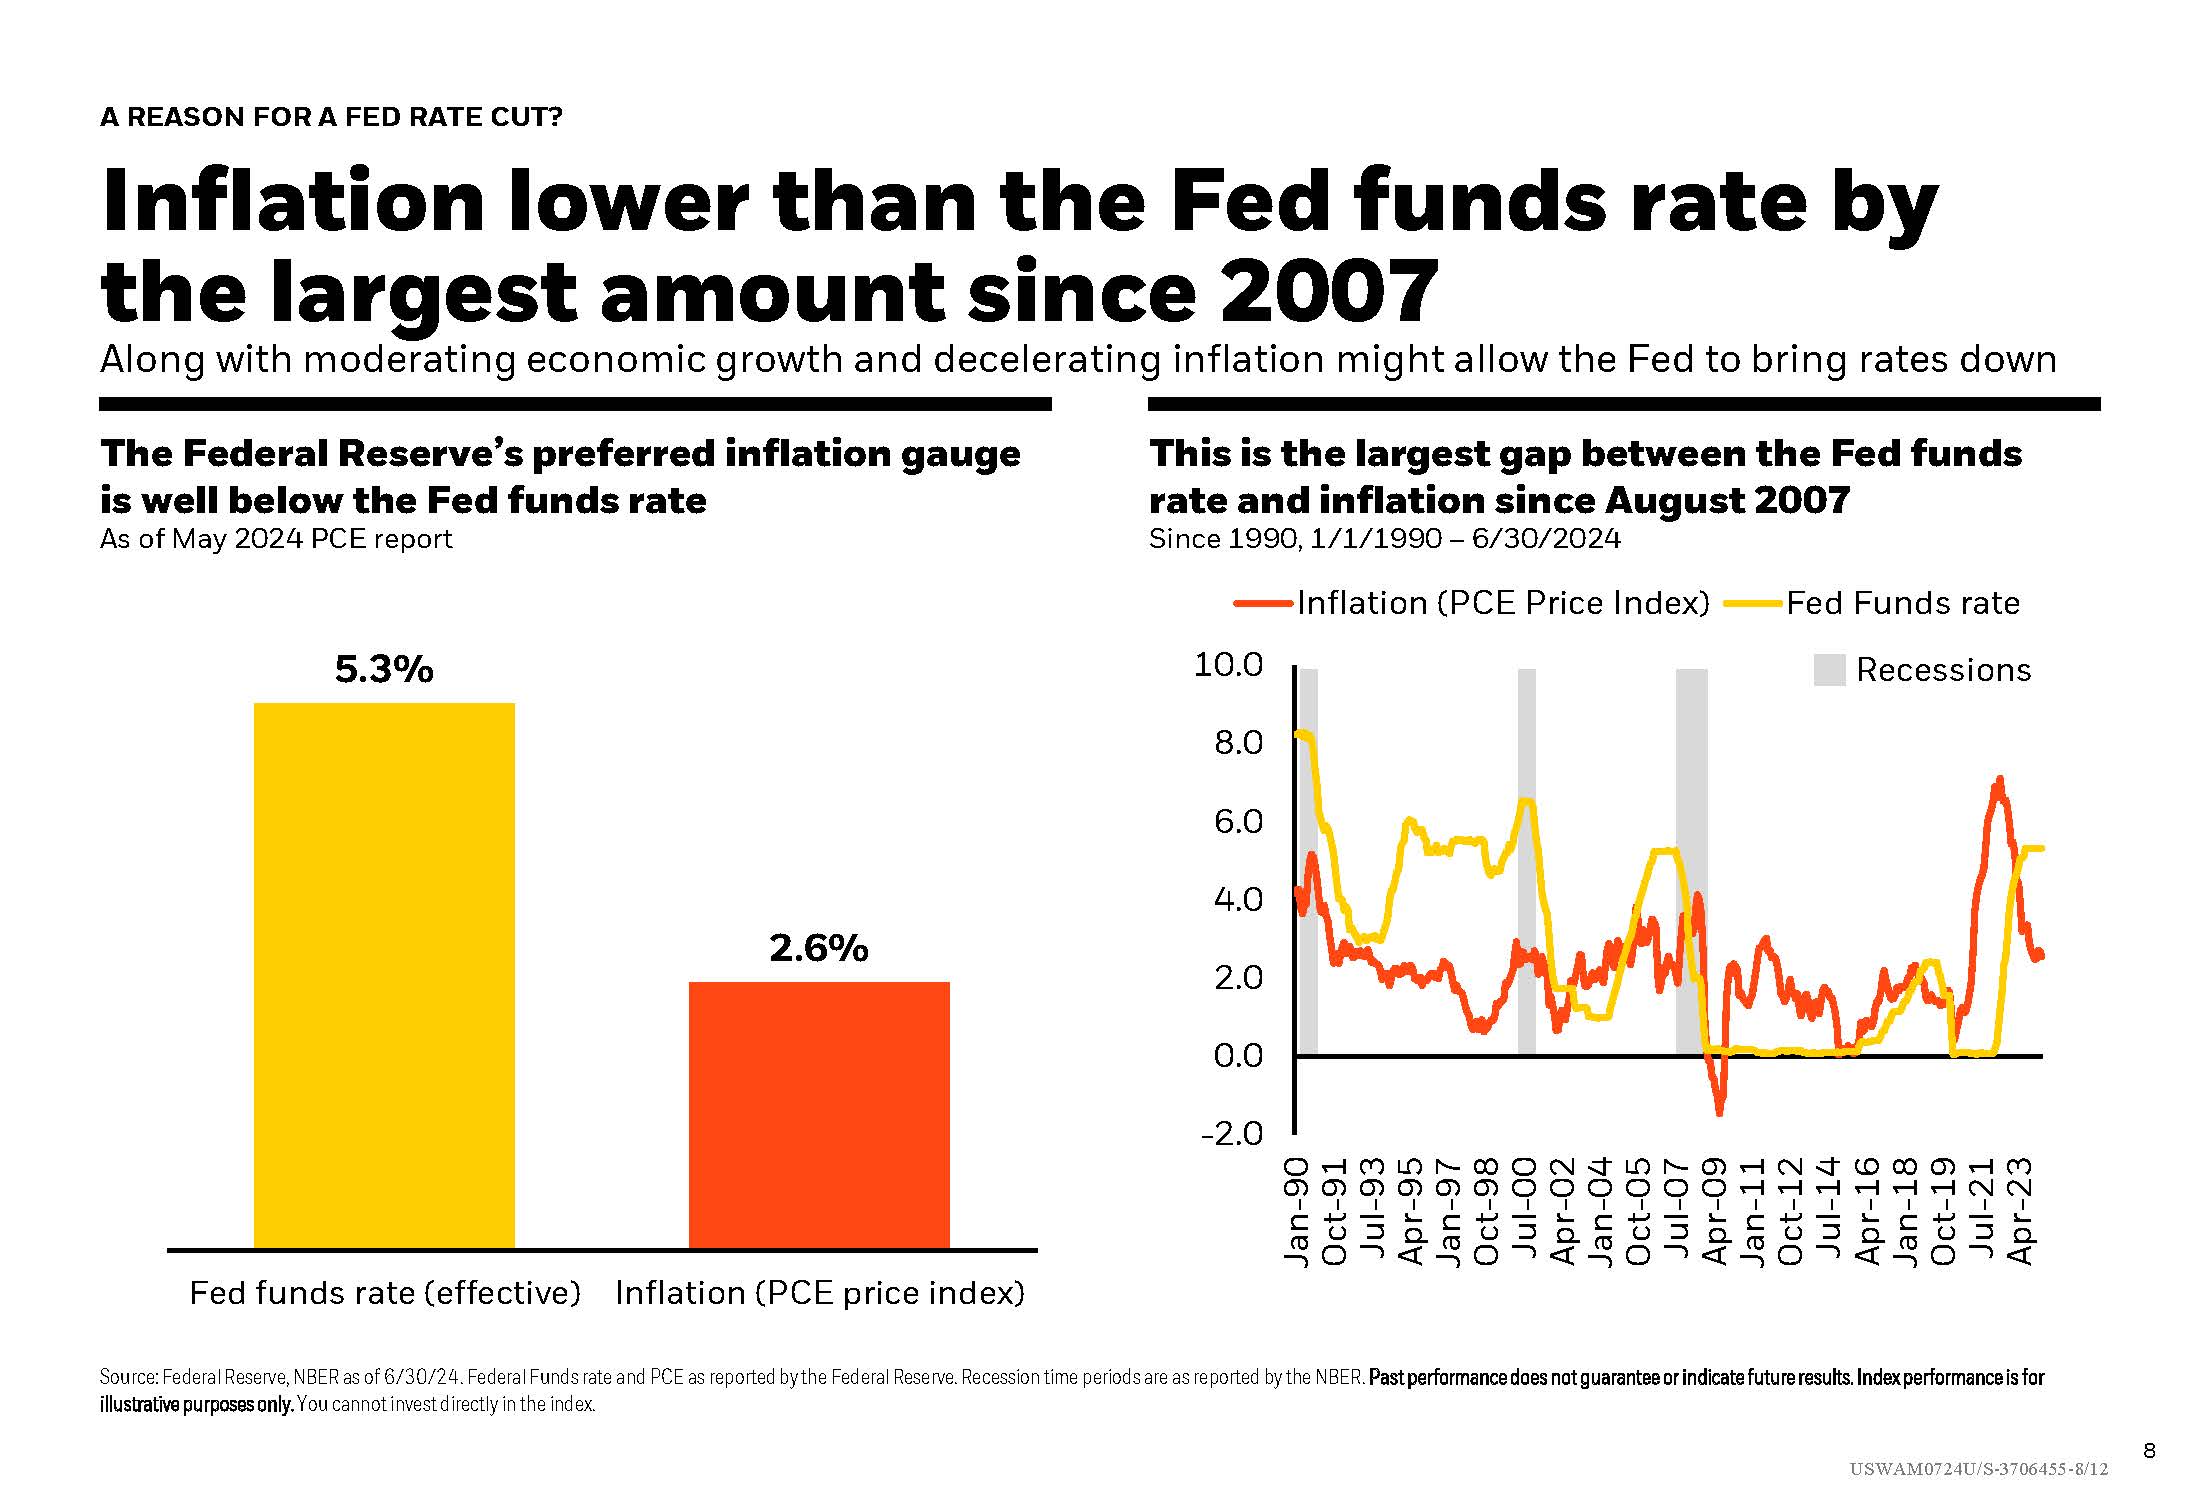
Large cap stock performance is catching up with the last big technology advancement in the 1990’s, making the 3-year outperformance of large cap stocks over small cap stocks the largest since Dec 1999. This Student of the Market also takes a look at stock market performance concentration showing up internationally, a comparison of Inflation to the Fed funds rate, and more.

August 1, 2024
Large Cap Stock Outperformance
Important Disclosure: Content on our website and in our newsletters is for informational purposes only. The information provided may (or may not) directly apply to your situation. We recommend that readers work directly with a professional advisor when making decisions in the context of their specific situation.

Other content you may like

  • Mid-Quarter Roundtable Highlights

    Podcast Highlight - Mid-Quarter Recap: Bonds, Markets and U.S. Dollar

    November 28, 2022
    Enjoy this highlight clip from the Strong Valley Mid-Quarter Roundtable discussion.
    Read this Article
  • Is The University of Michigan Consumer Sentiment Too Pessimistic?

    April 15, 2025
    What is happening with the latest economic data? Both the hard and soft data have been softening. Do you know the difference? What does this mean for our economic outlook at home? Let’s take a look at the GDP, inflation and durable goods, as well as consumer sentiment.
    Read this Article
  • Charitable Ideas for What to Do With Your Money

    Charitable Ideas for What to Do With Your Money

    October 7, 2021
    Giving away some of your money is a great way to support the people and organizations you love. But there are smart ways to do it, minimizing your taxes and avoiding pitfalls along the way. This article is full of useful information. Learn from the great givers and let your advisor be your sounding board.
    Read this Article
  • Stock Performance in Election Years

    Stock Performance in Election Years

    May 23, 2024
    Historical data showing how U.S. stocks have tended to lose money less often in election years, showing the smaller percent of calendar years that lost money, which often tended to be driven by historic economic events, not elections. Included is a glimpse at seasonal stock and bond returns in election years. Also asset classes, inverted yield curve update, high yield bonds environment, and private credit returns.
    Read this Article
  • The link you have selected is located on another server. The linked site contains information that has been created, published, maintained, or otherwise posted by institutions or organizations independent of this organization. We do not endorse, approve, certify, or control any linked websites, their sponsors, or any of their policies, activities, products, or services. We do not assume responsibility for the accuracy, completeness, or timeliness of the information contained therein. Visitors to any linked websites should not use or rely on the information contained therein until they have consulted with an independent financial professional. Please click “Continue to Link” to leave this website and proceed to the selected site.
    phone-handset