Call Our Office
(559) 384-2900 | Fresno
(619) 480-1413 | San Diego
(619) 480-1413 | San Diego
Your Money
Your Life
Your Way
You are now leaving the Strong Valley Wealth & Pension, LLC ("Strong Valley") website. By clicking on the "Schwab Alliance Access" link below you will be entering the Charles Schwab & Co., Inc. (“Schwab”) Website. Schwab is a registered broker-dealer, and is not affiliated with Strong Valley or any advisor(s) whose name(s) appears on this Website. Strong Valley is/are independently owned and operated. Schwab neither endorses nor recommends Strong Valley. Regardless of any referral or recommendation, Schwab does not endorse or recommend the investment strategy of any advisor. Schwab has agreements with Strong Valley under which Schwab provides Strong Valley with services related to your account. Schwab does not review the Strong Valley website(s), and makes no representation regarding the content of the Website(s). The information contained in the Strong Valley website should not be considered to be either a recommendation by Schwab or a solicitation of any offer to purchase or sell any securities.
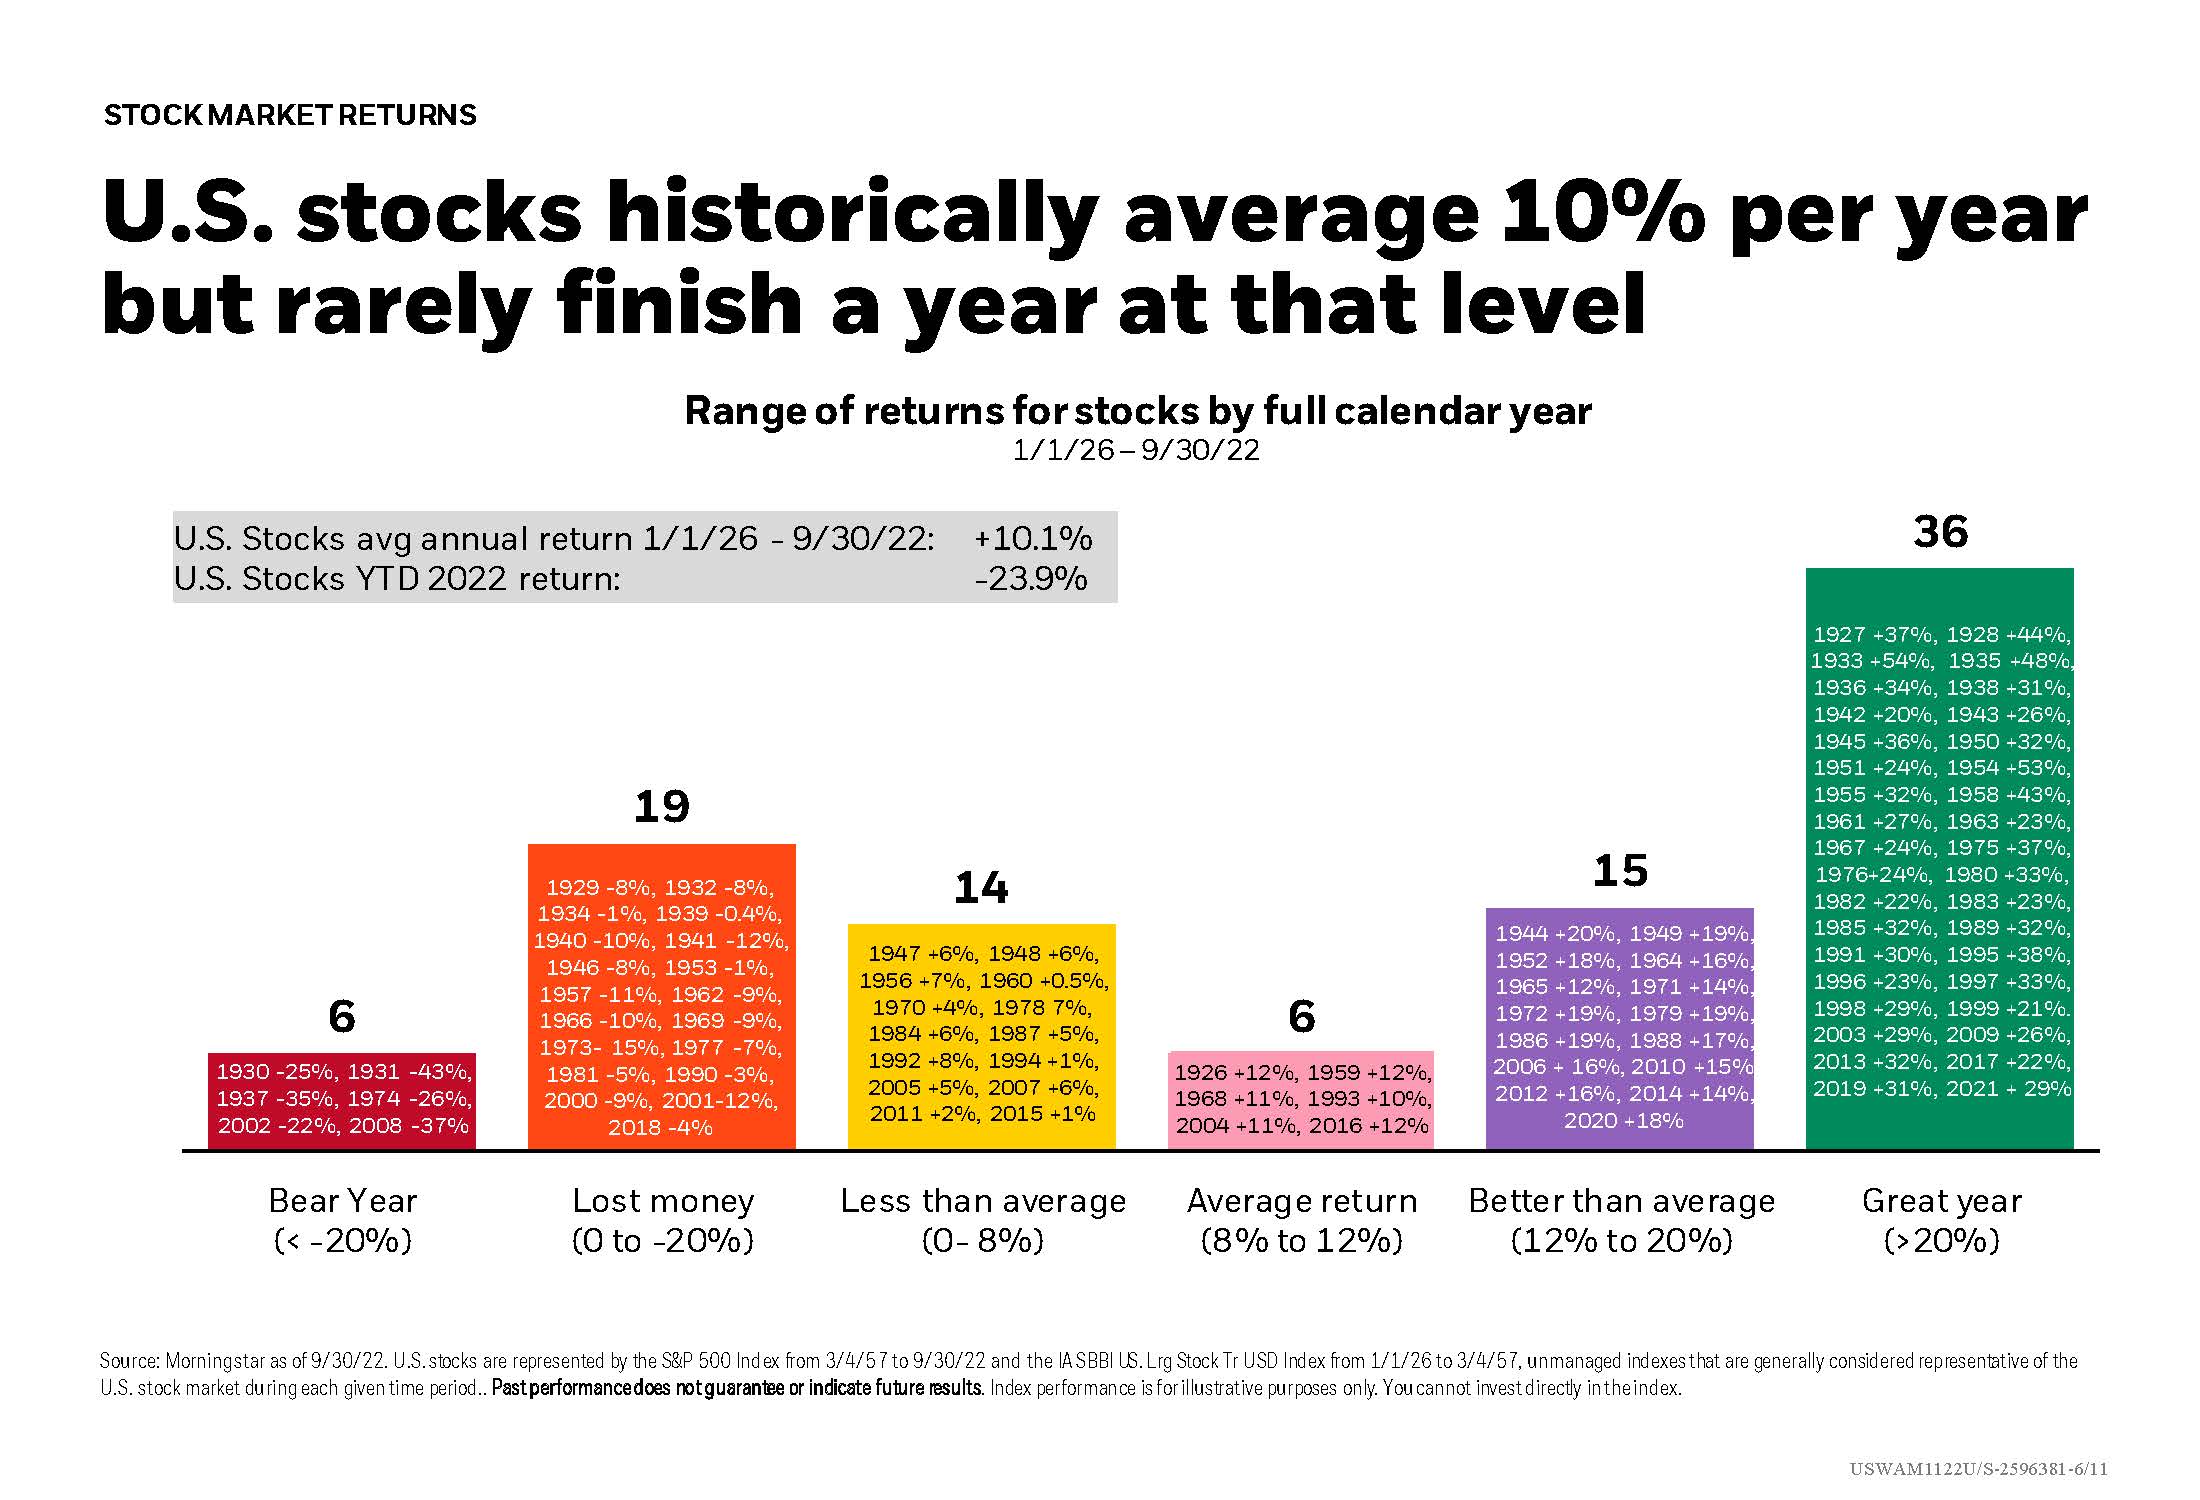
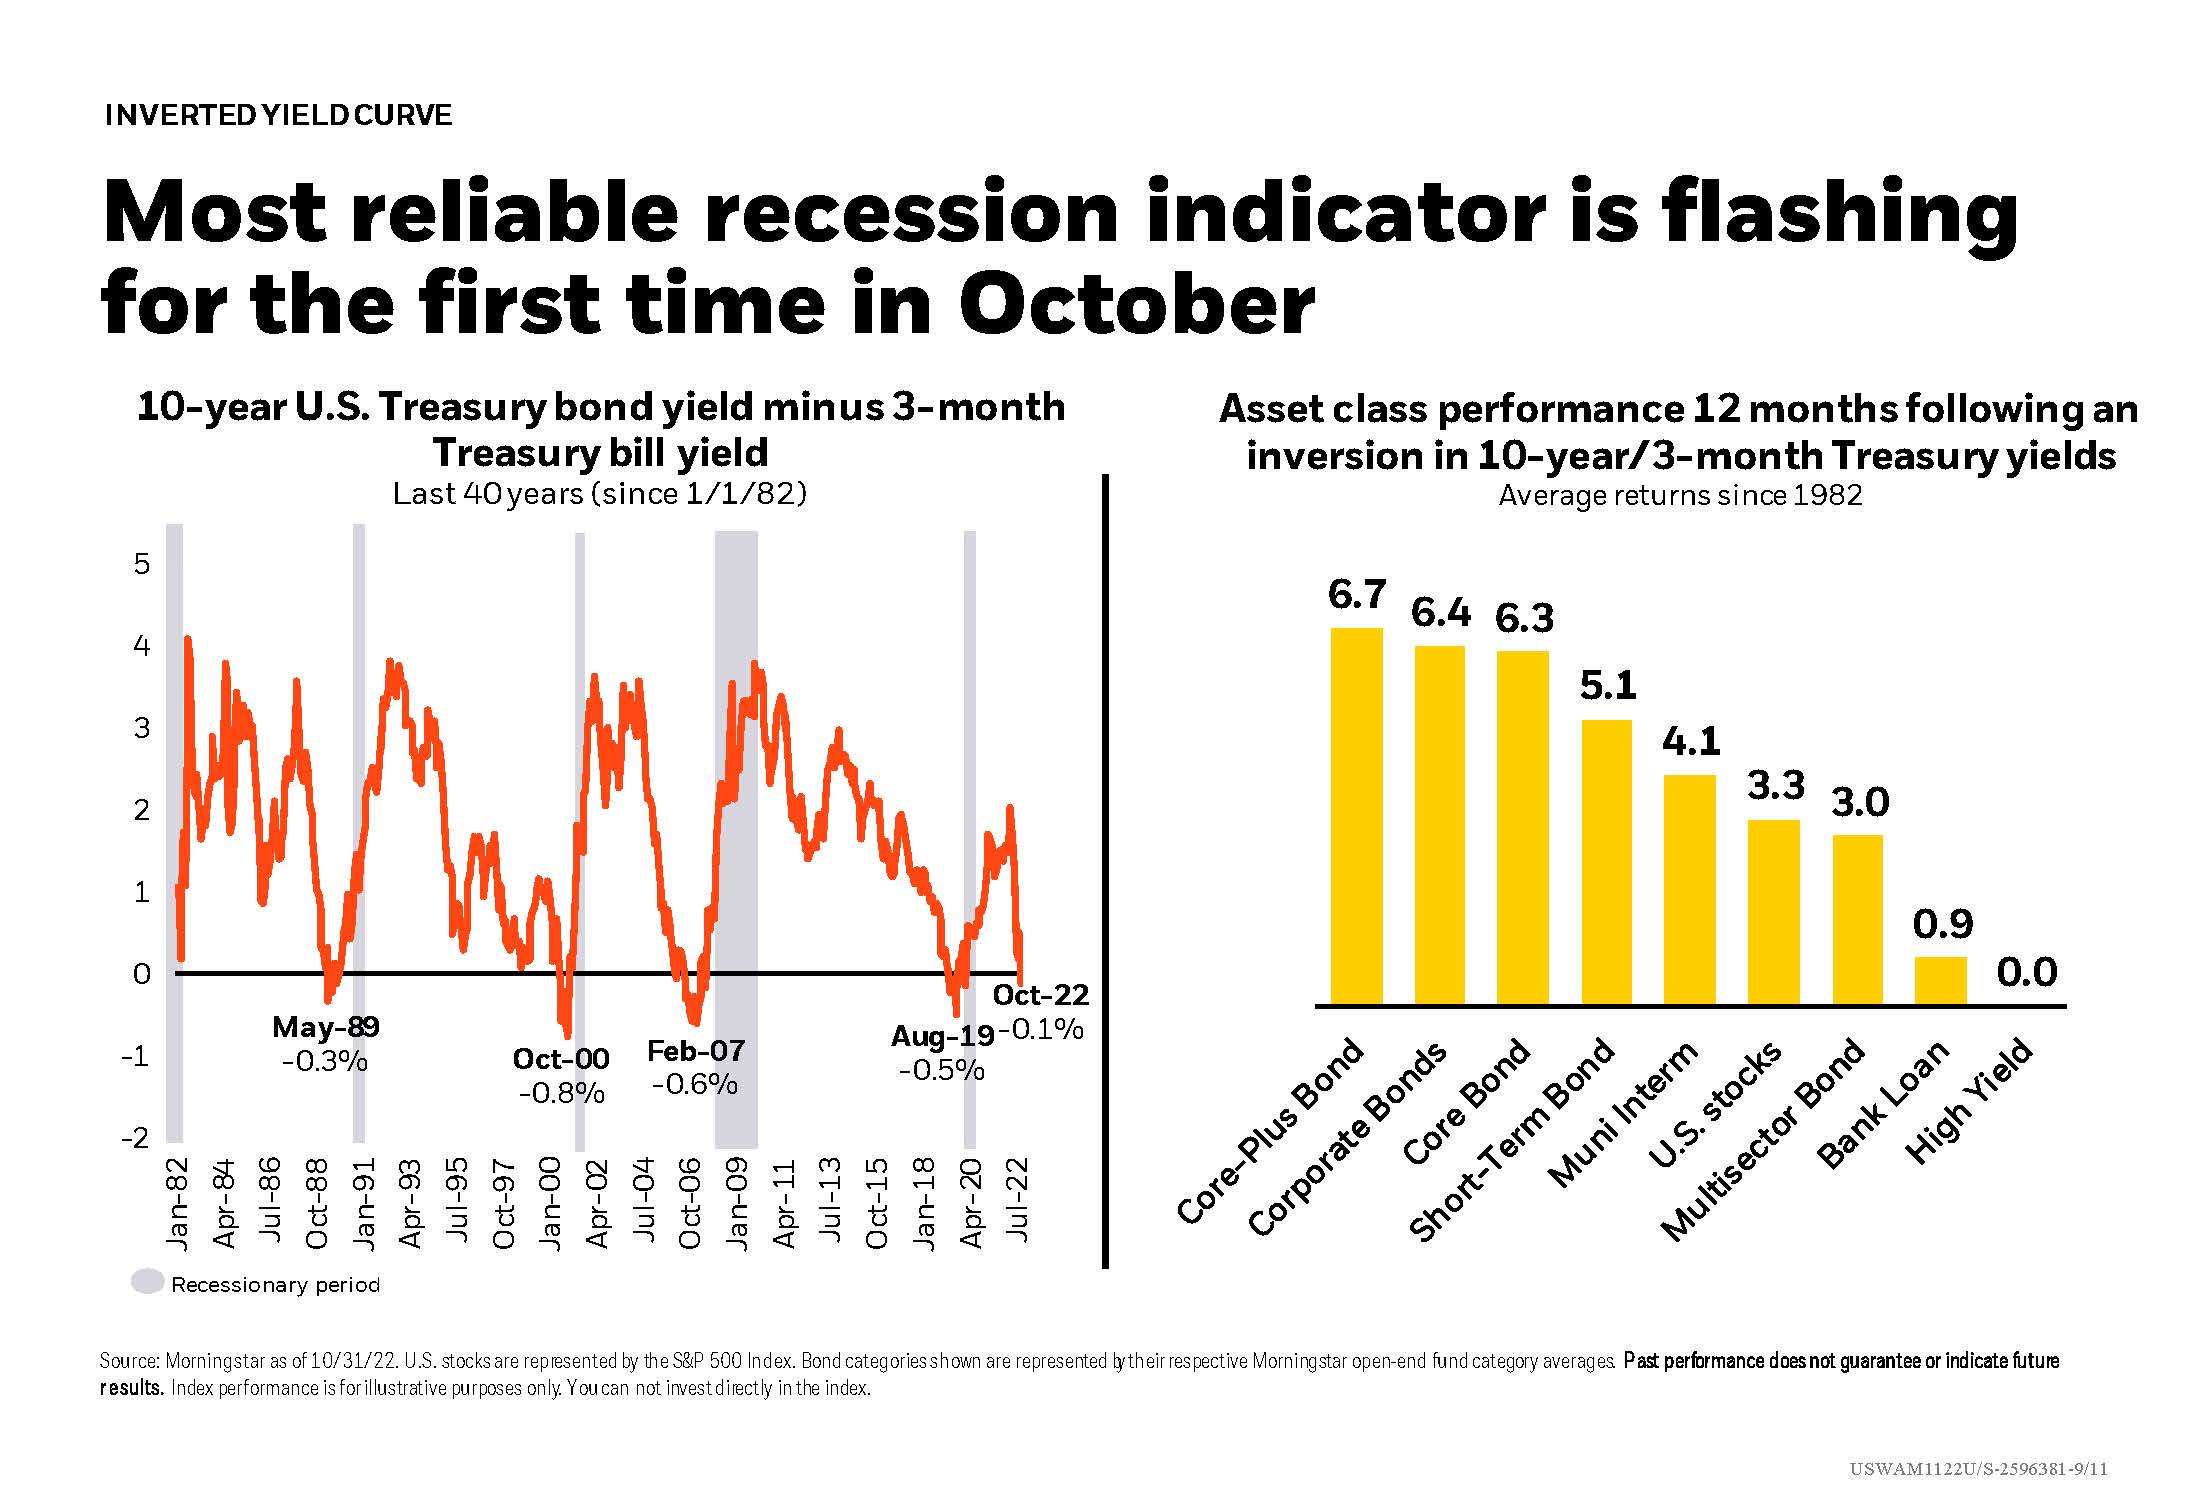
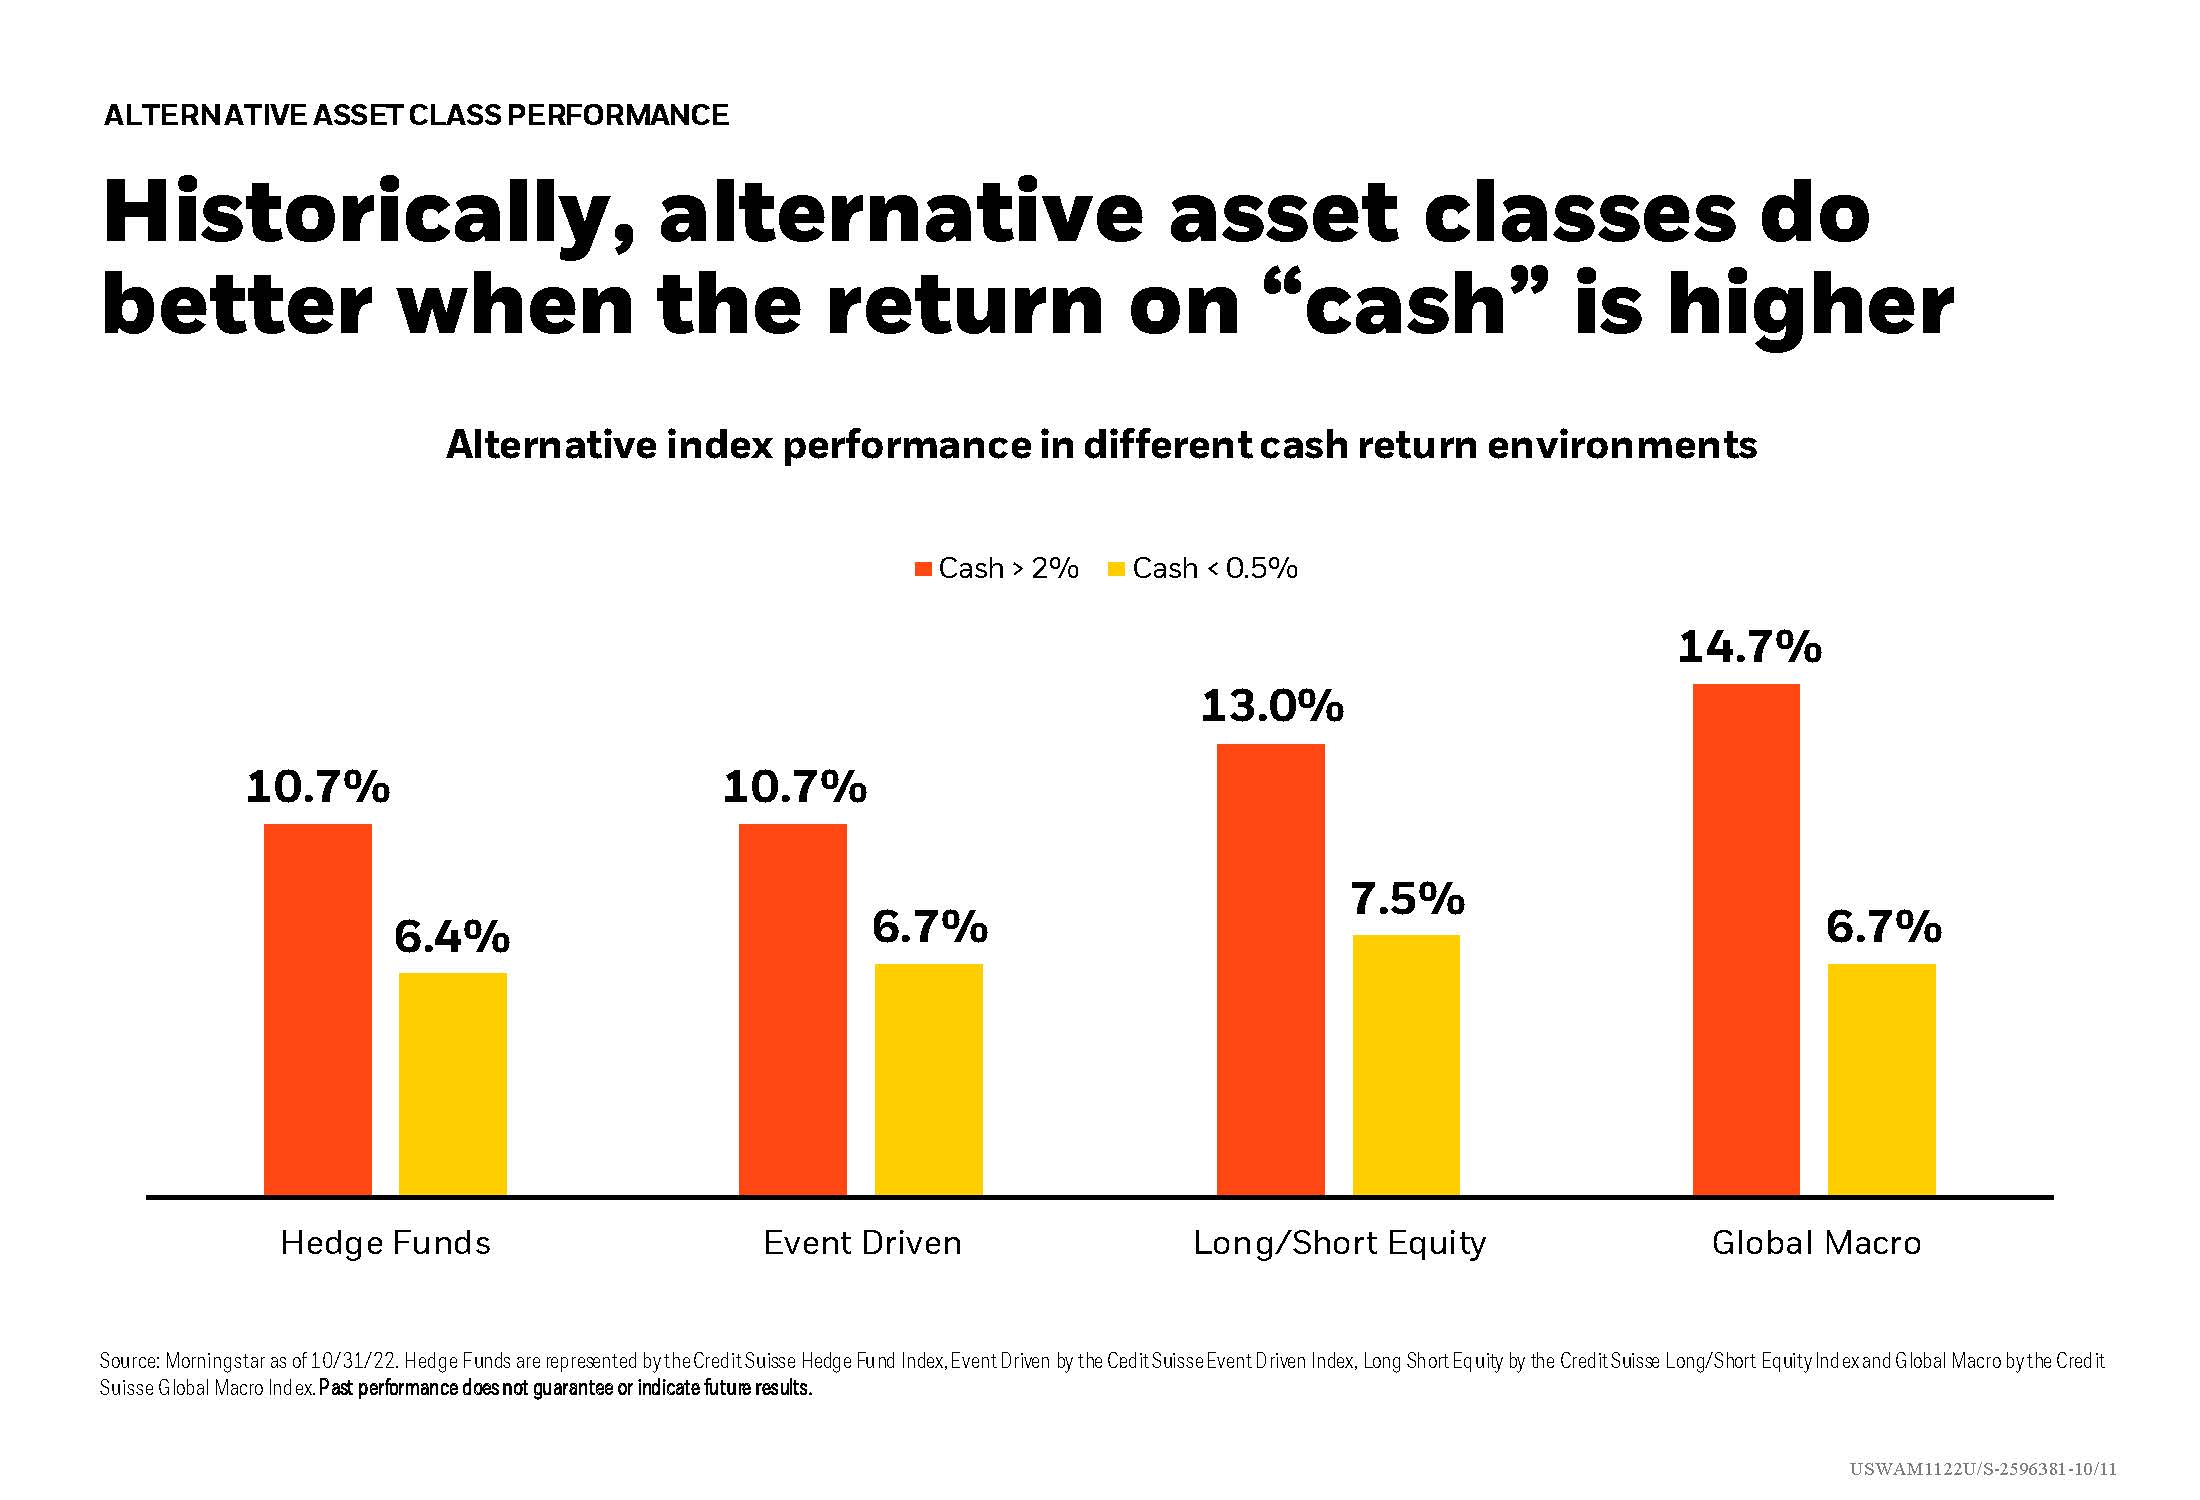
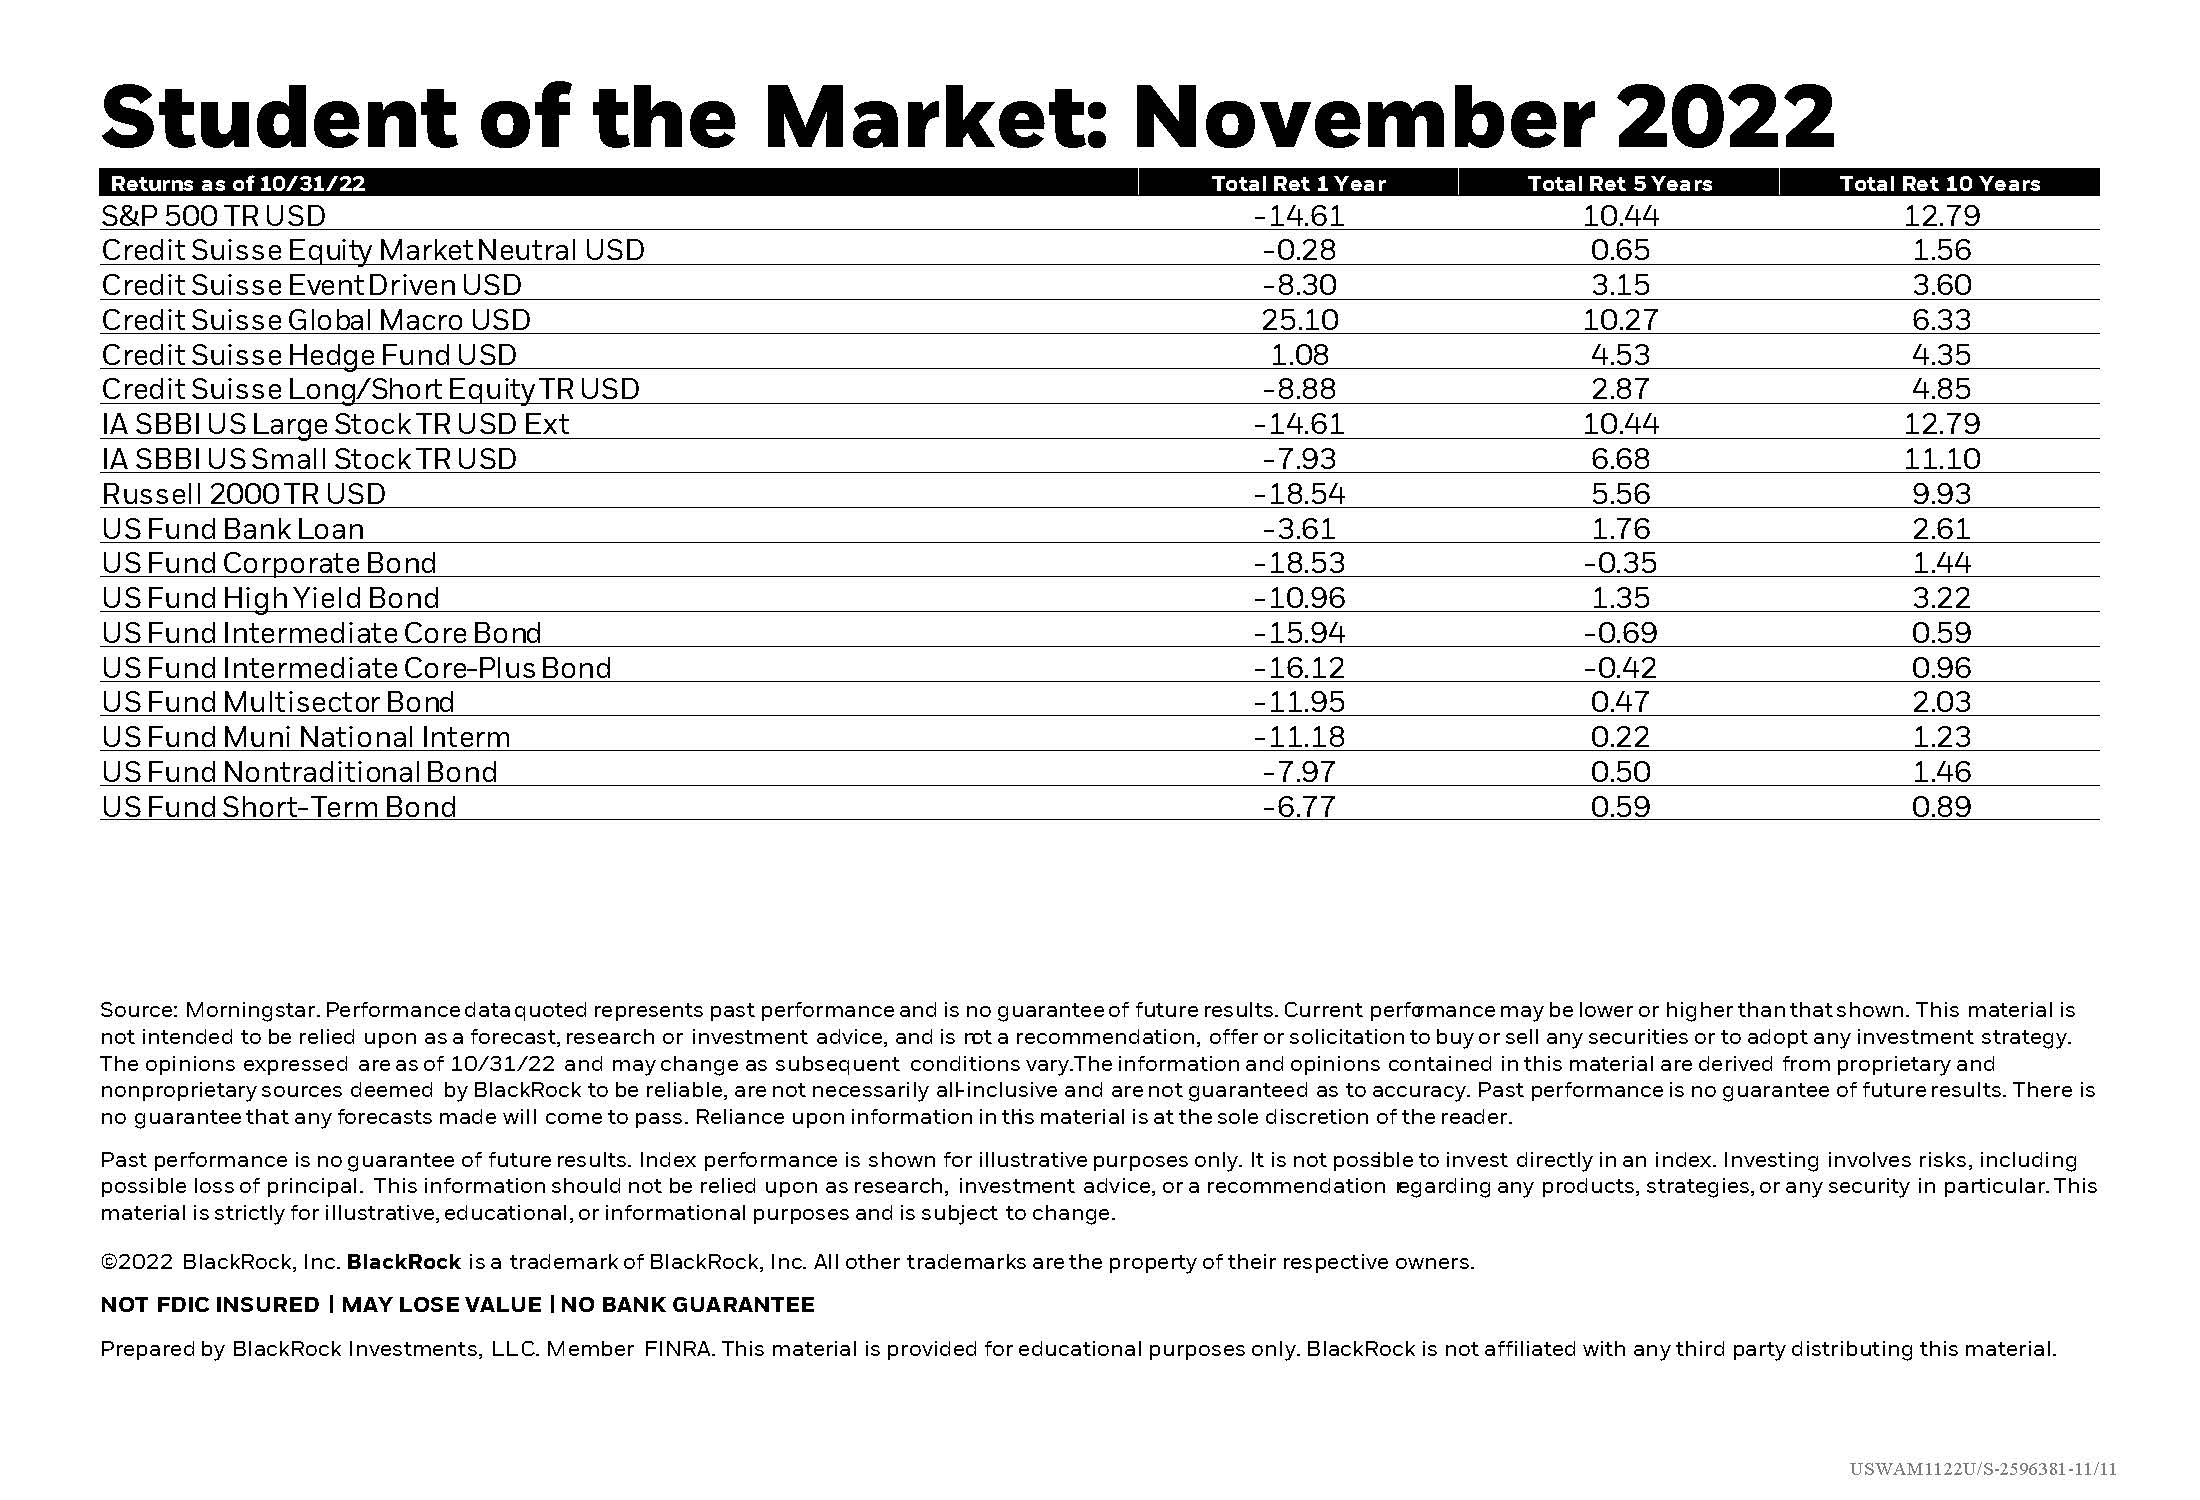
U.S. stocks historically average 10% per year but rarely do they finish a year at that level. See the difference between the average annual return and what happened to stocks YTD in 2022 by looking at the range of returns for stocks by the full calendar year. A quick glance at the most reliable recession indicator and how alternative asset classes do better when the return on “cash” is higher. Plus stats on market performance.