Article

Presidential Election Momentum

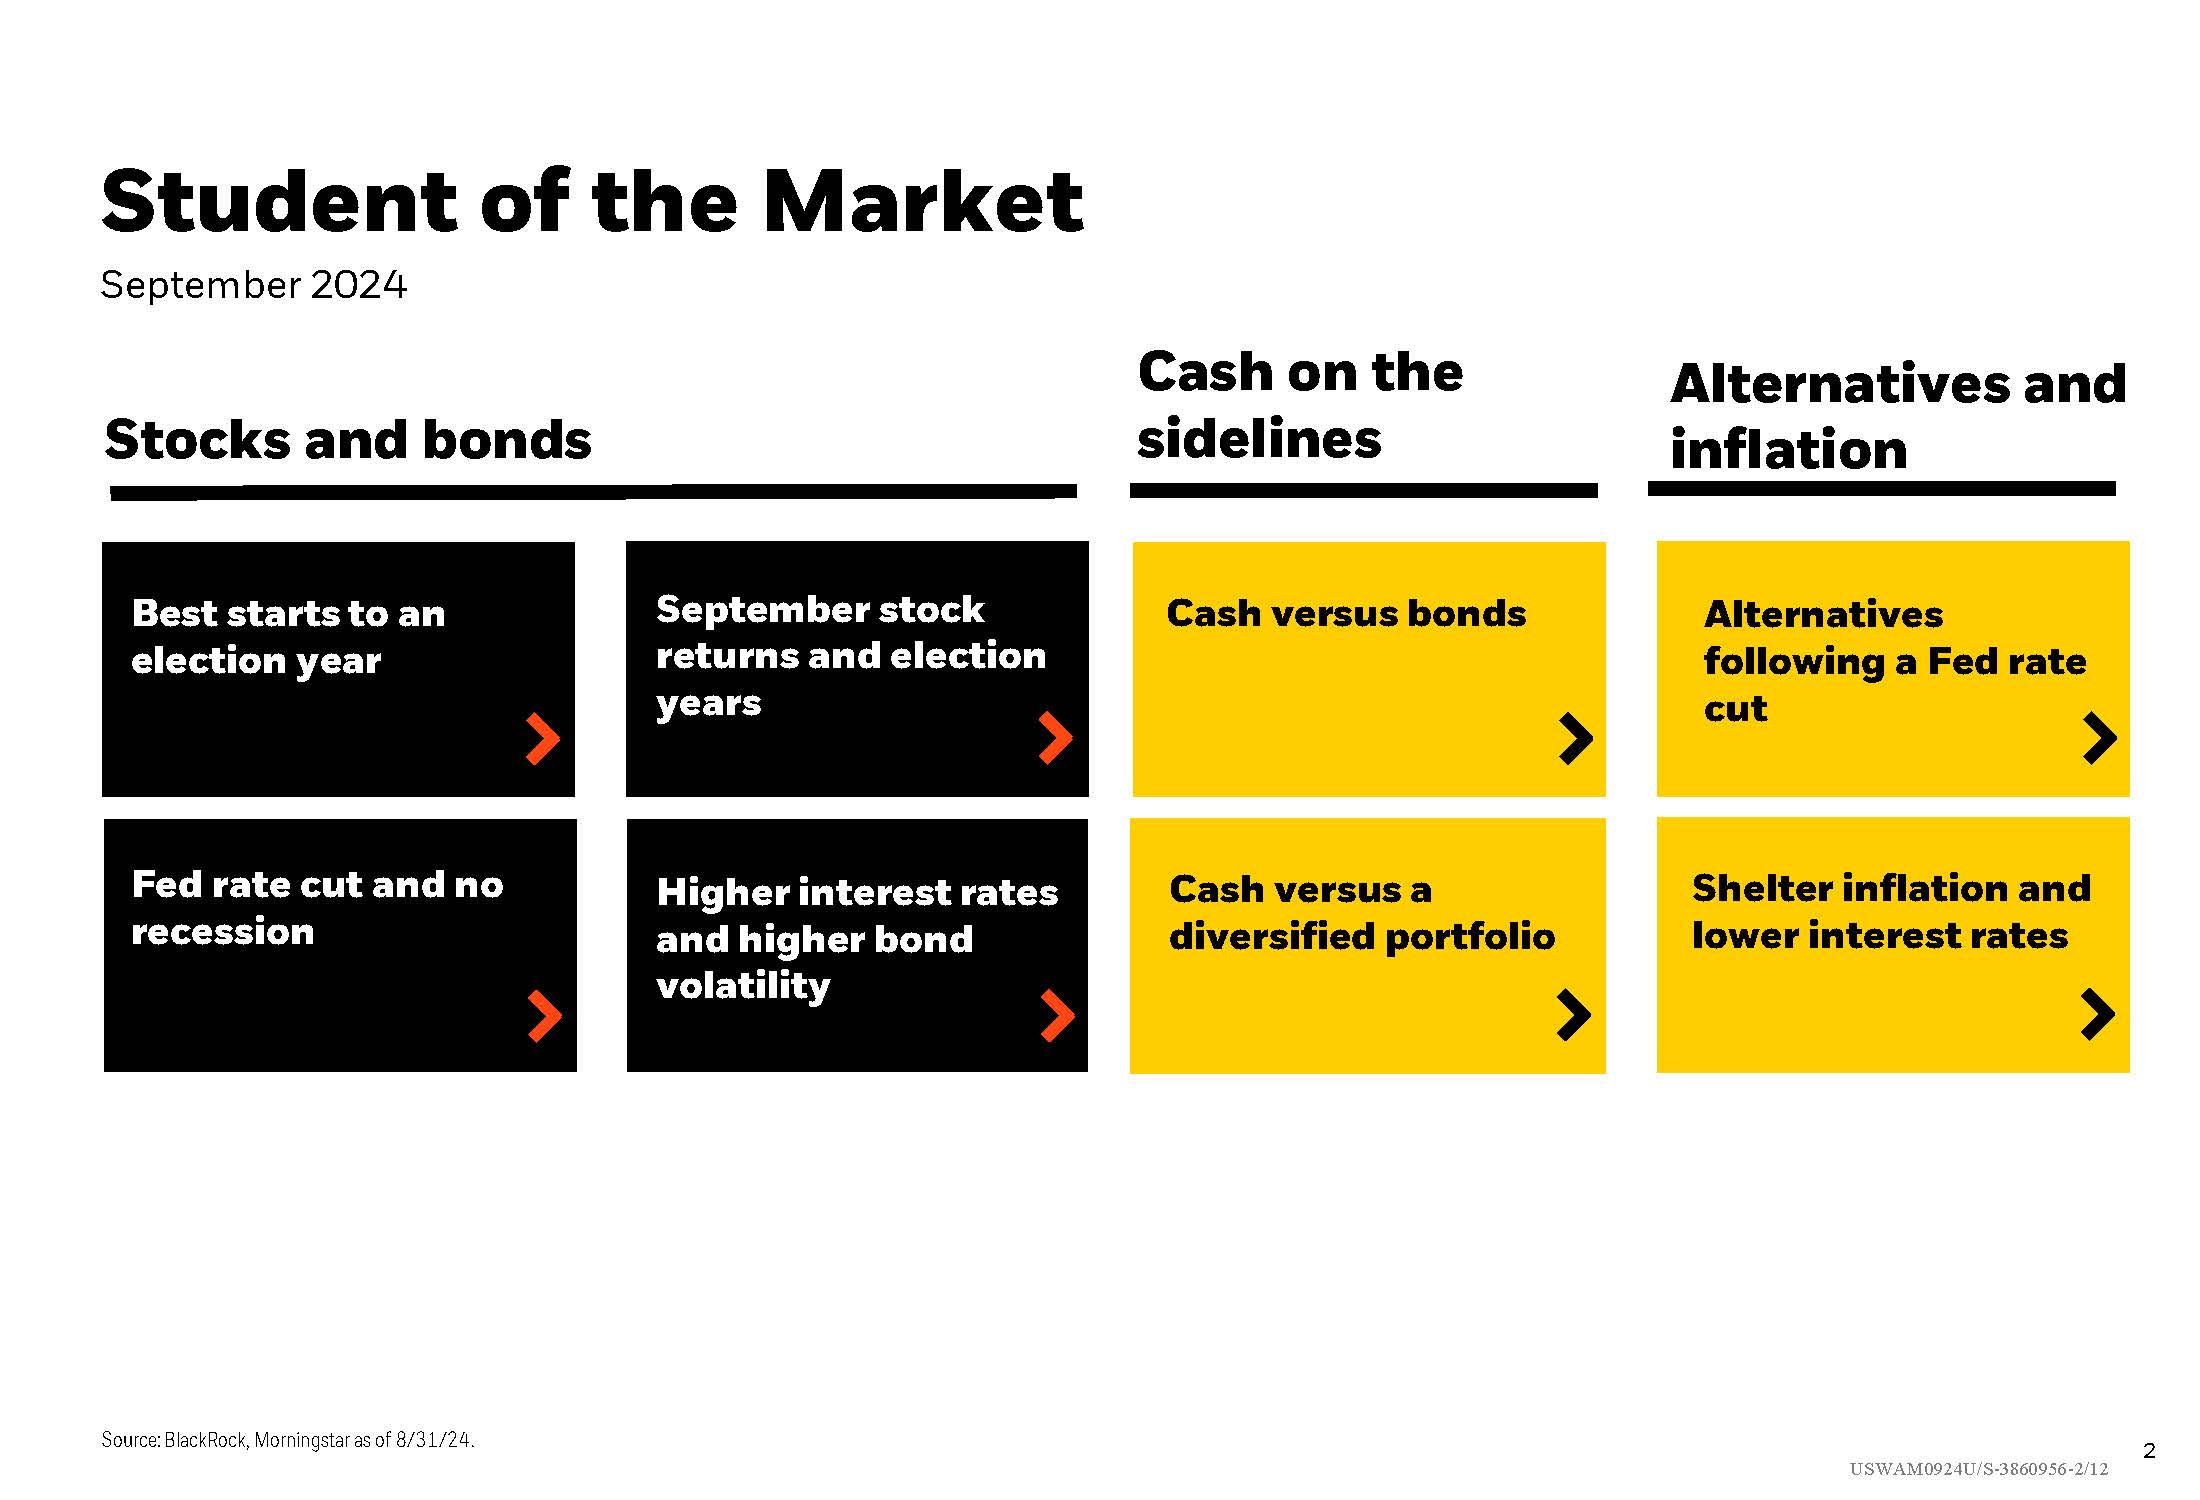
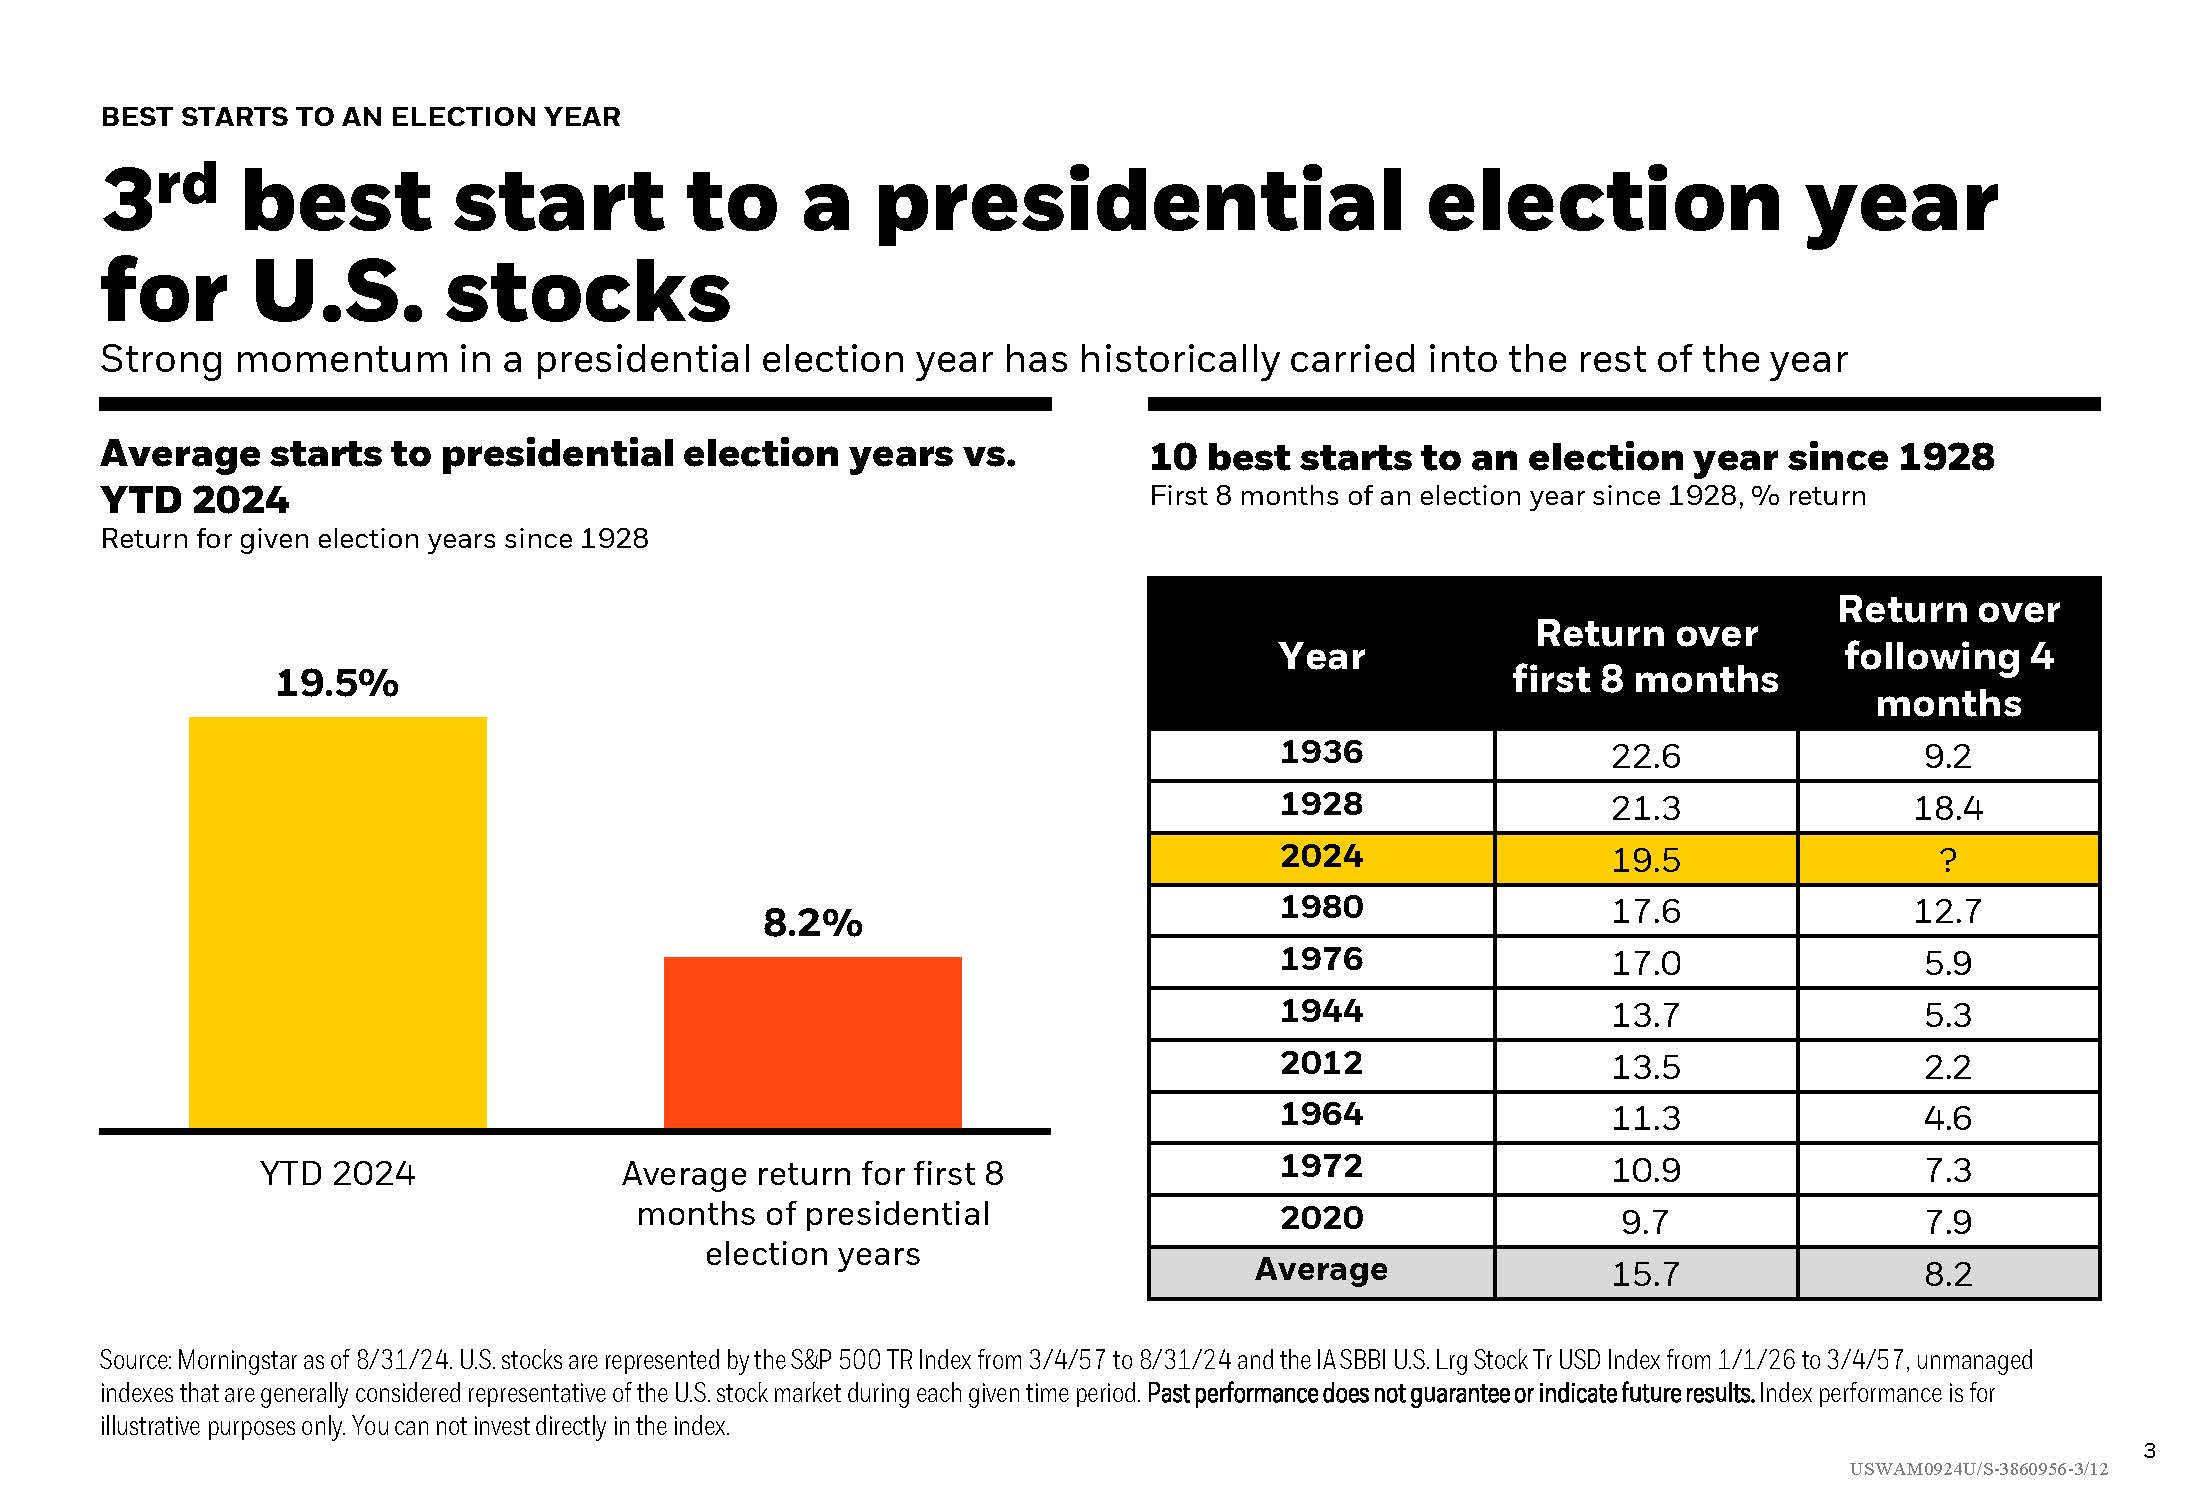
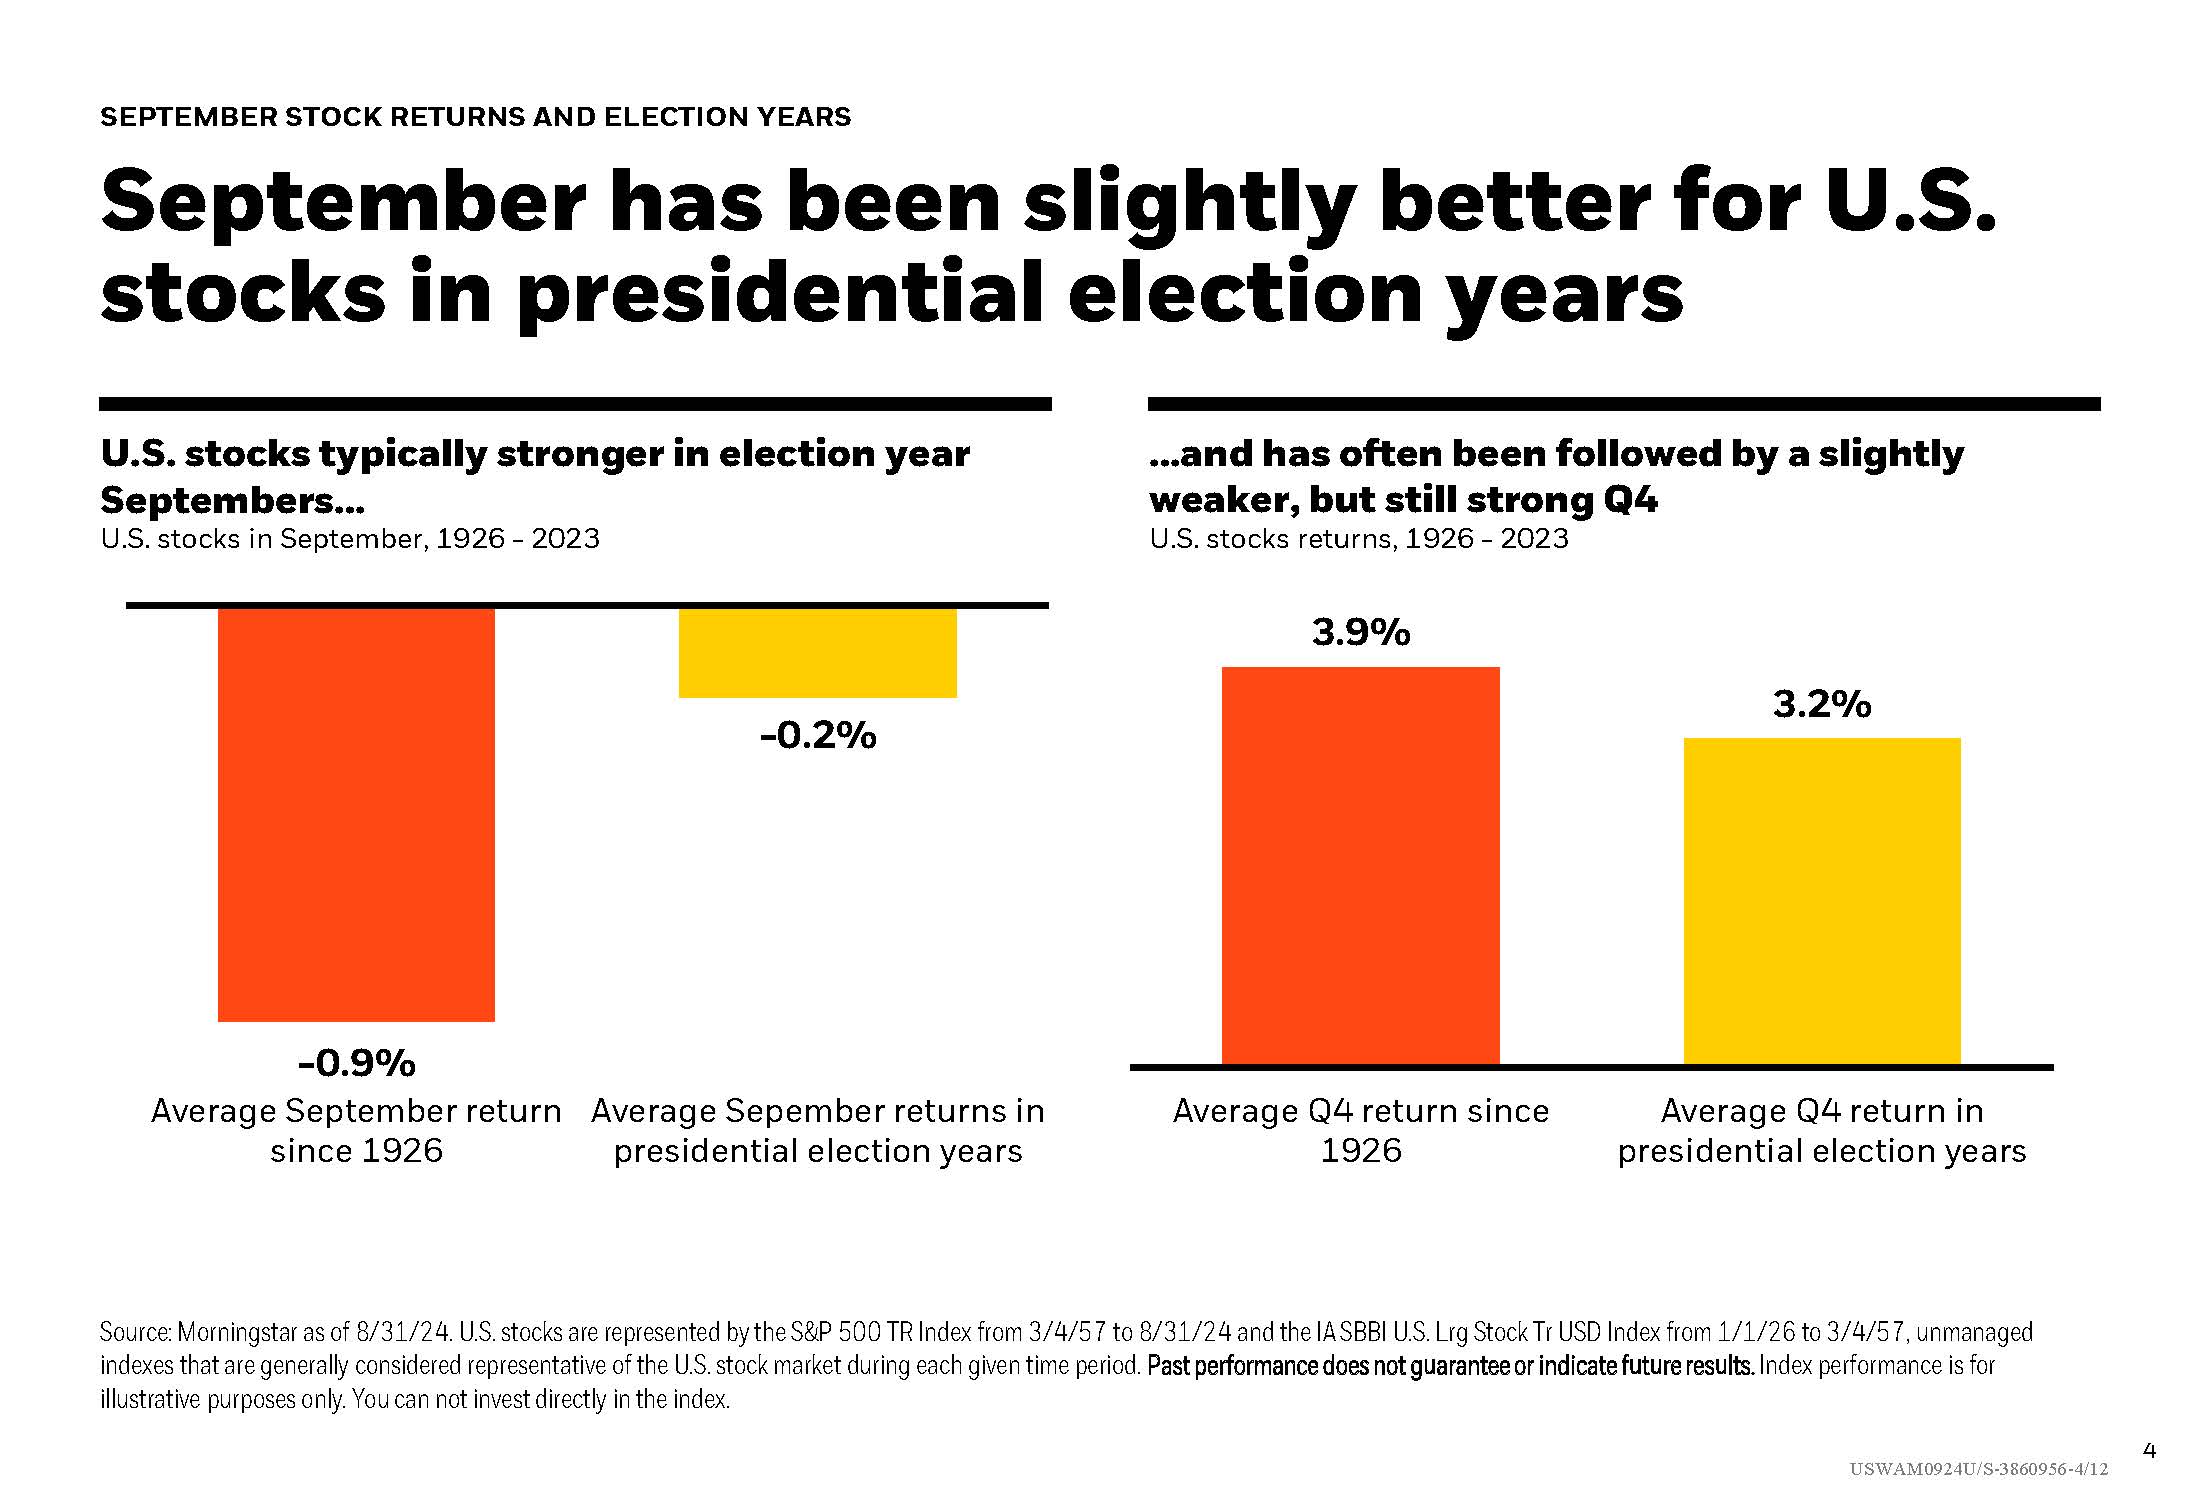
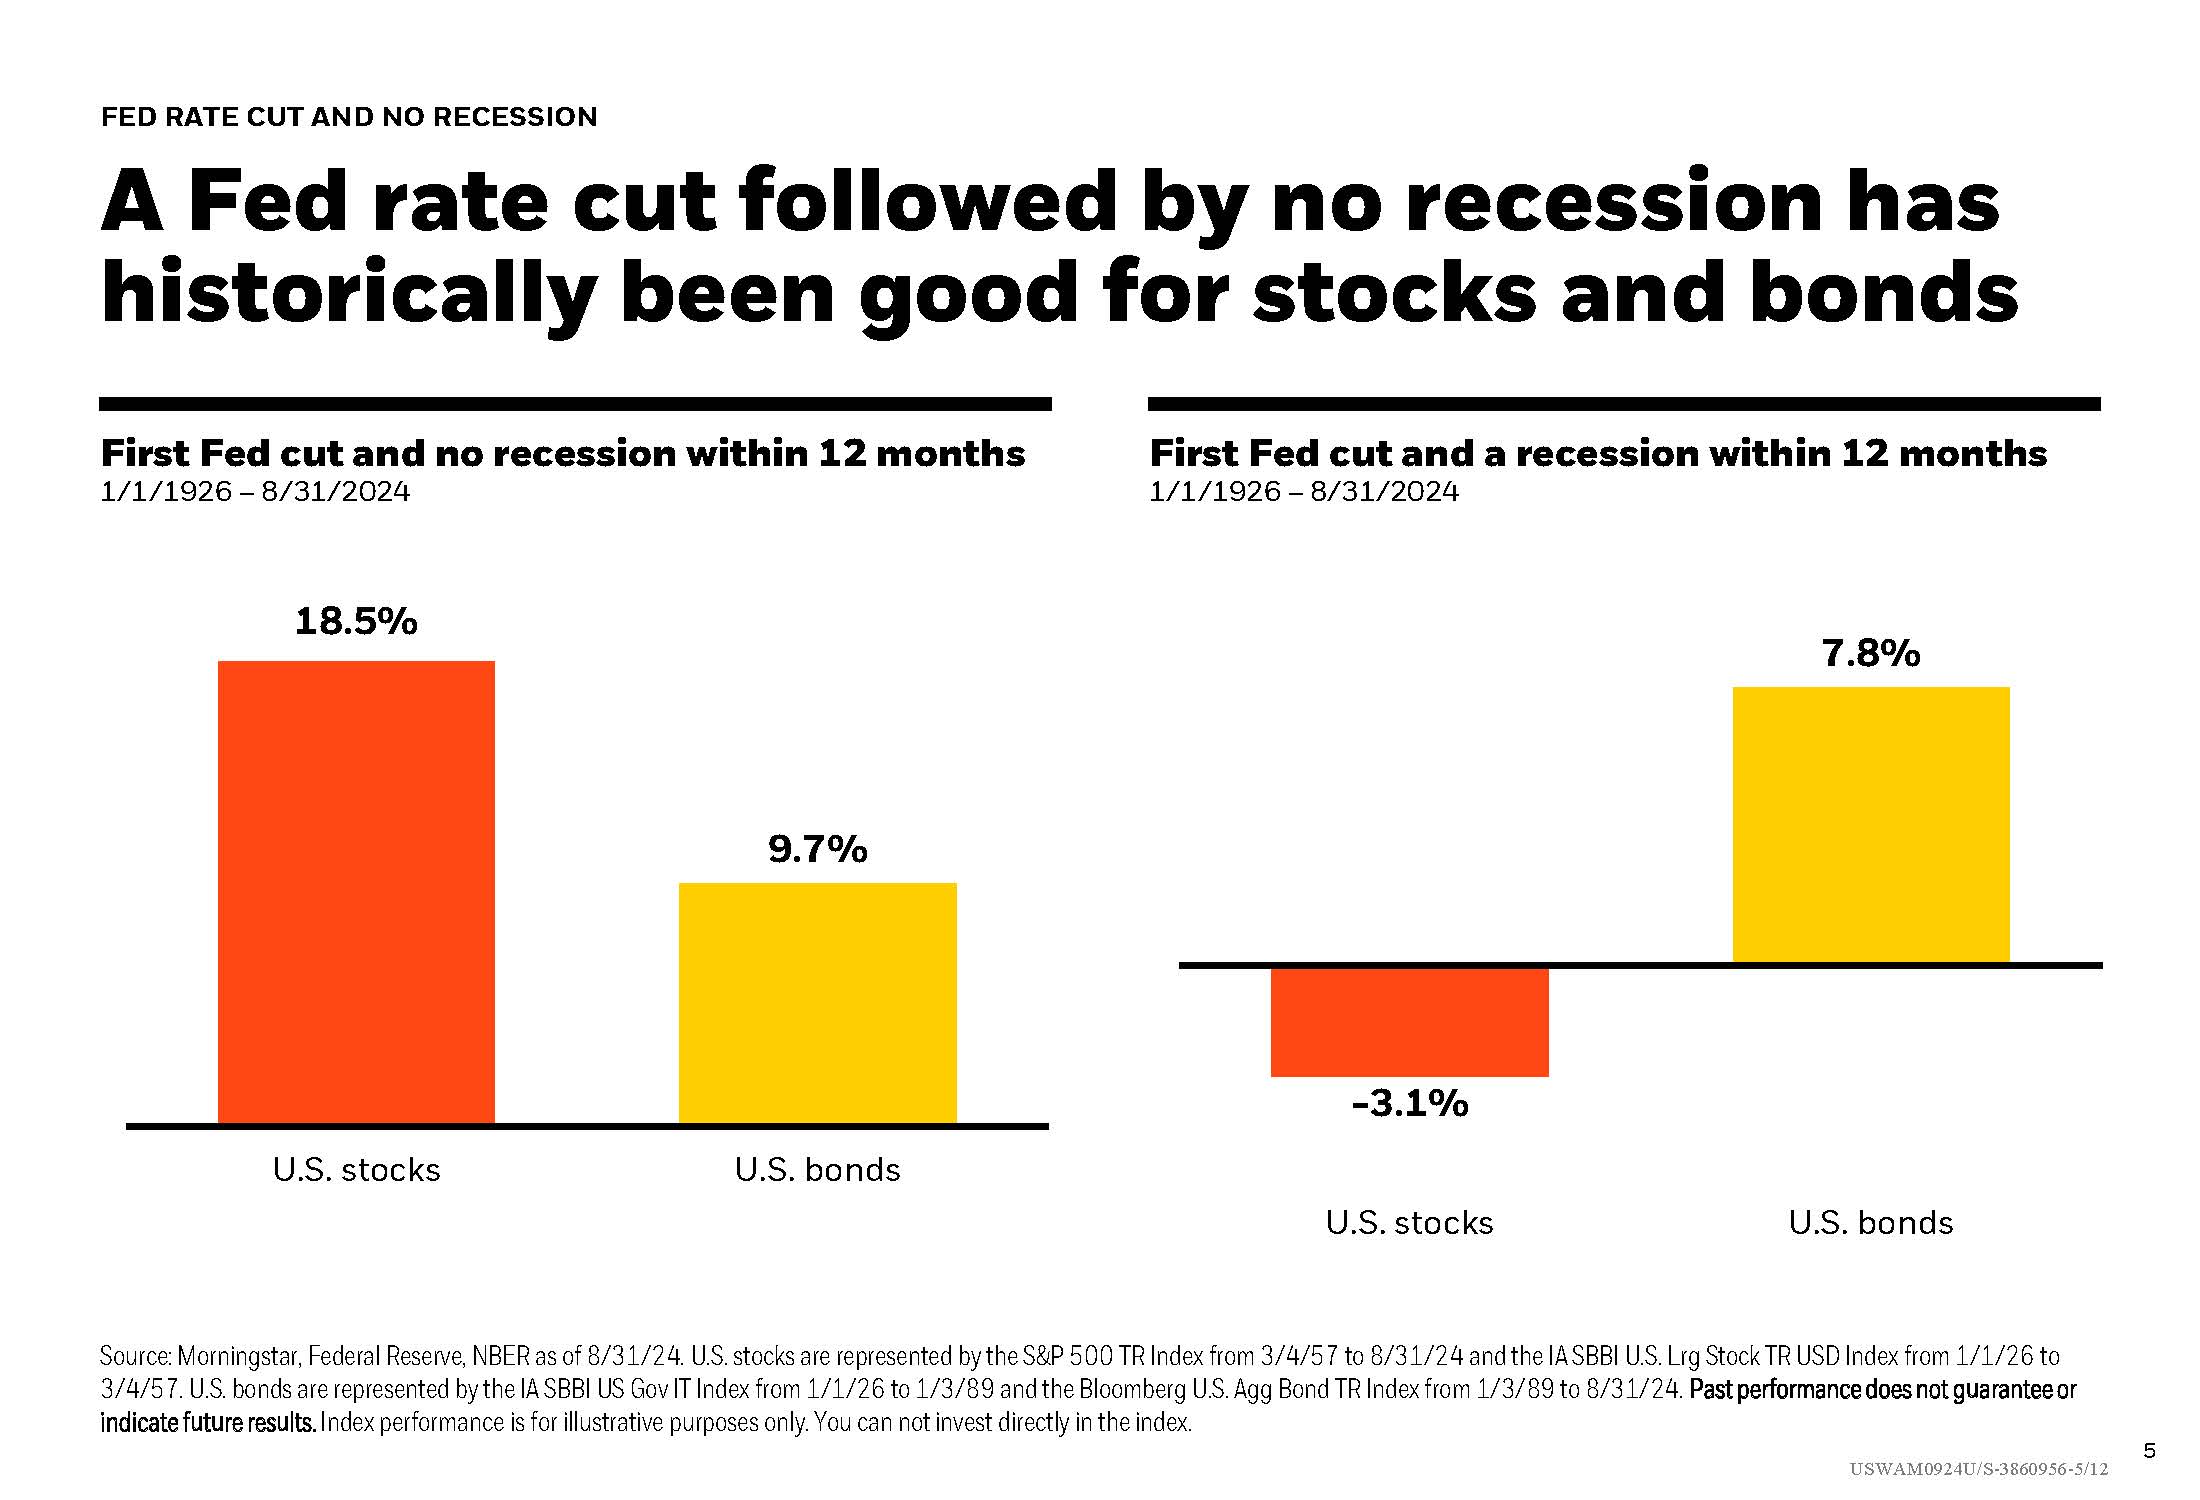
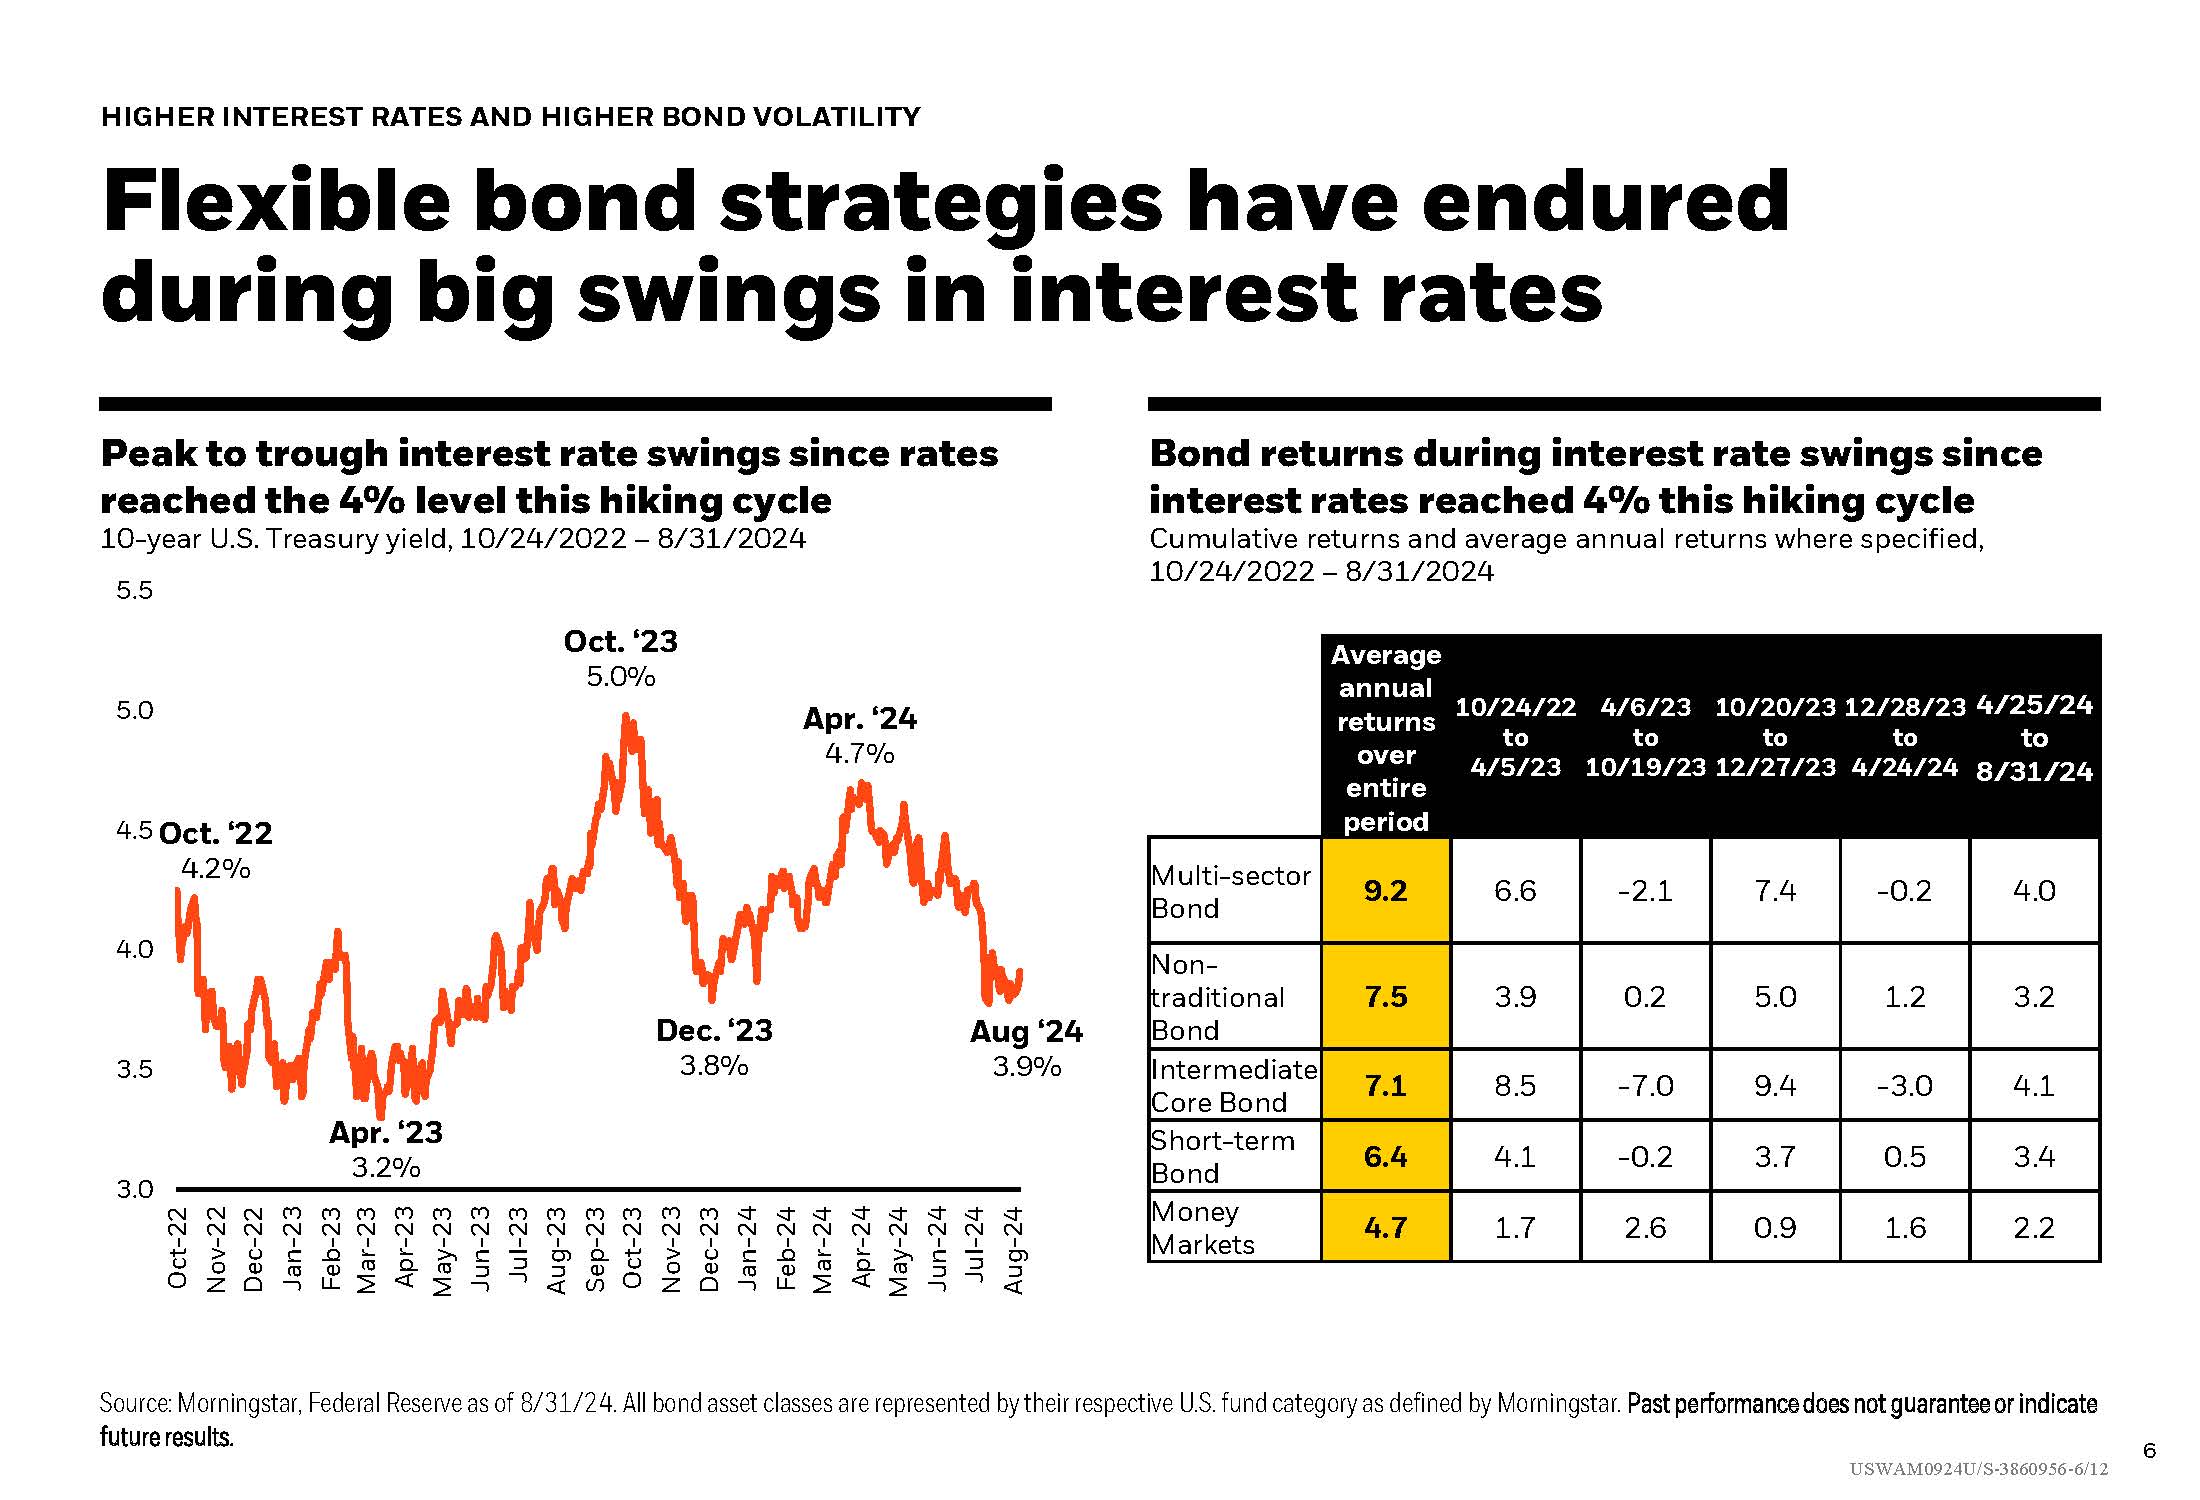
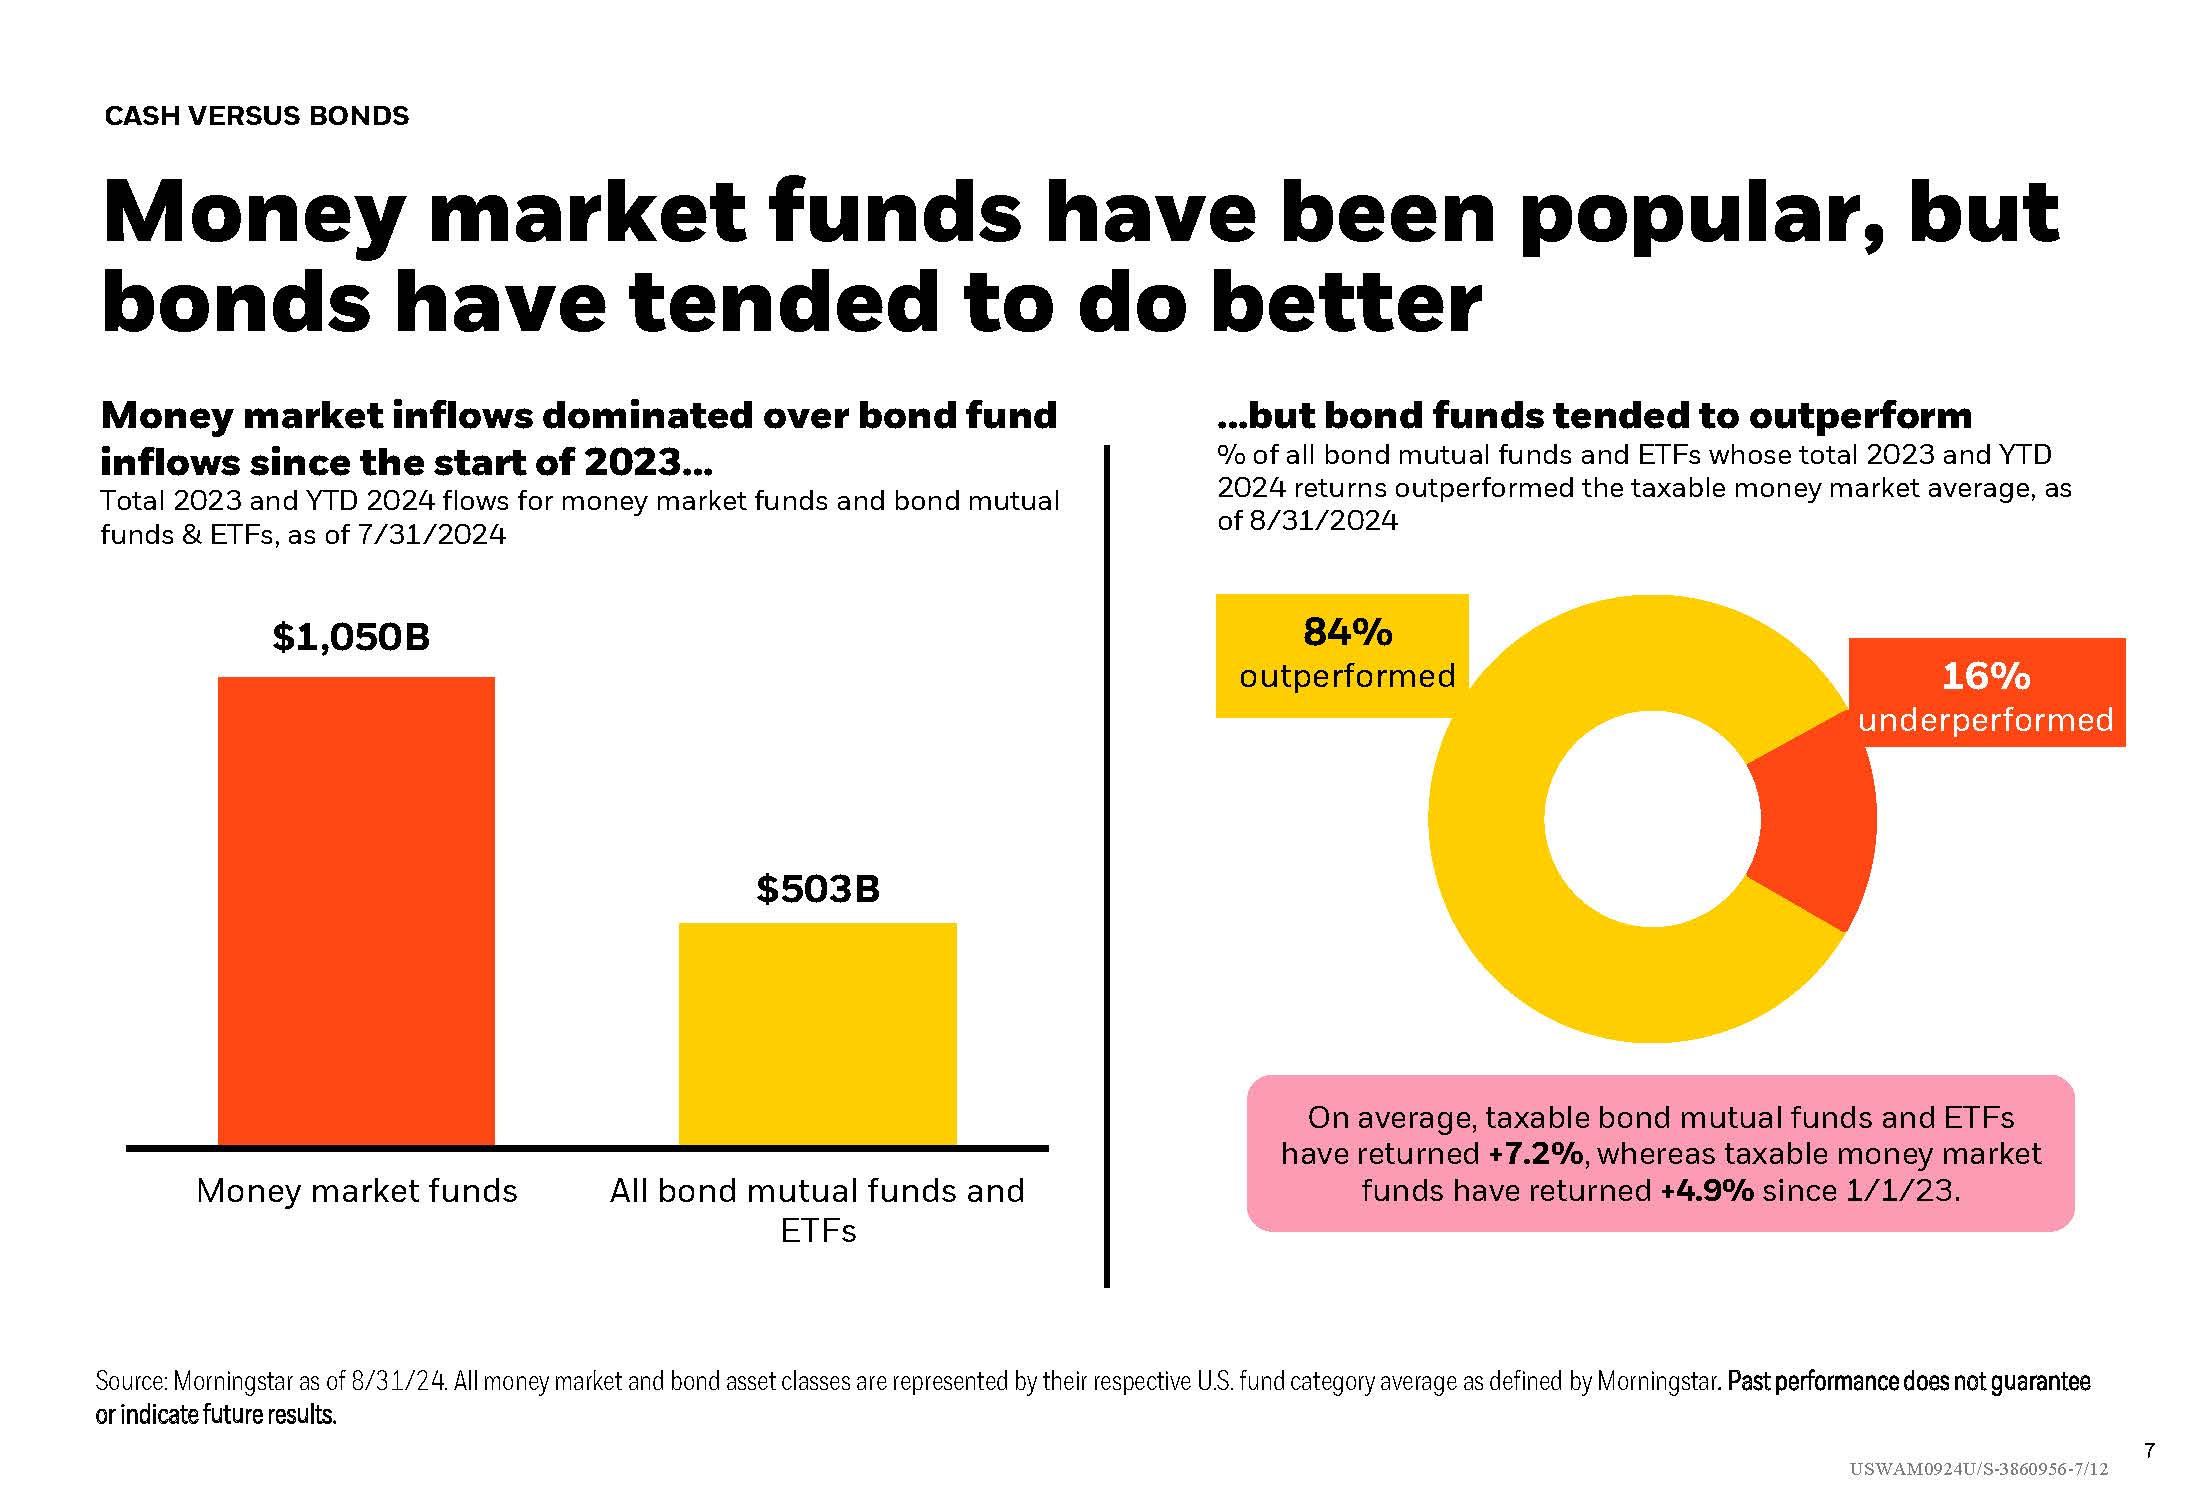
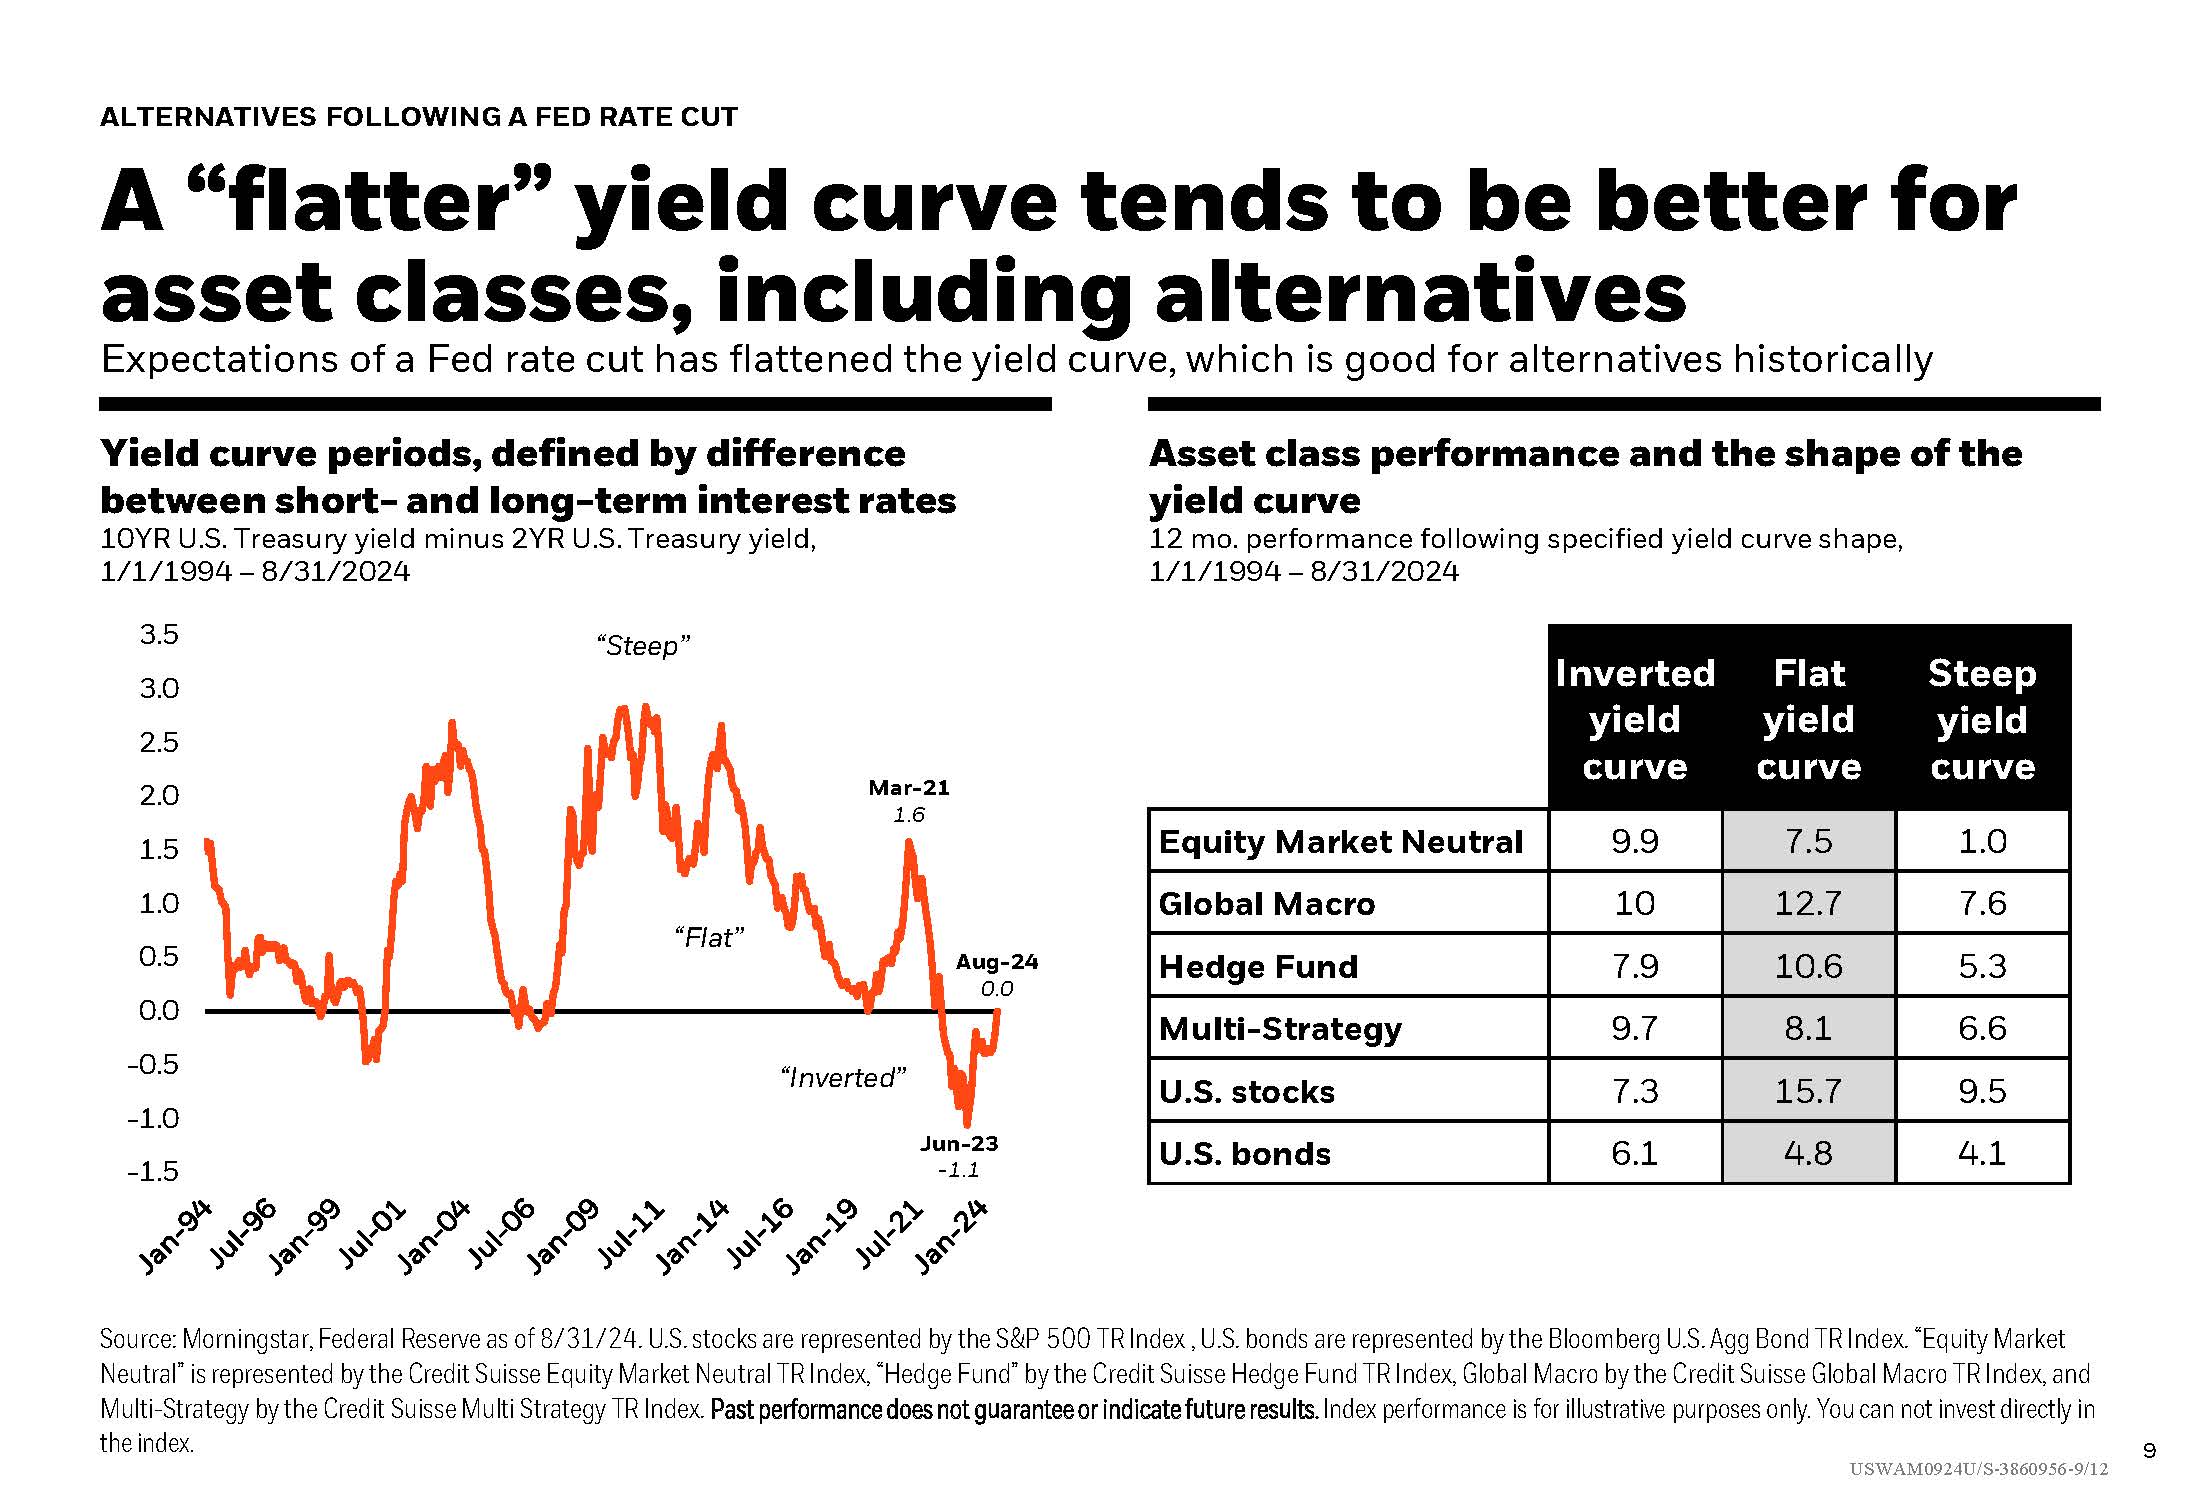
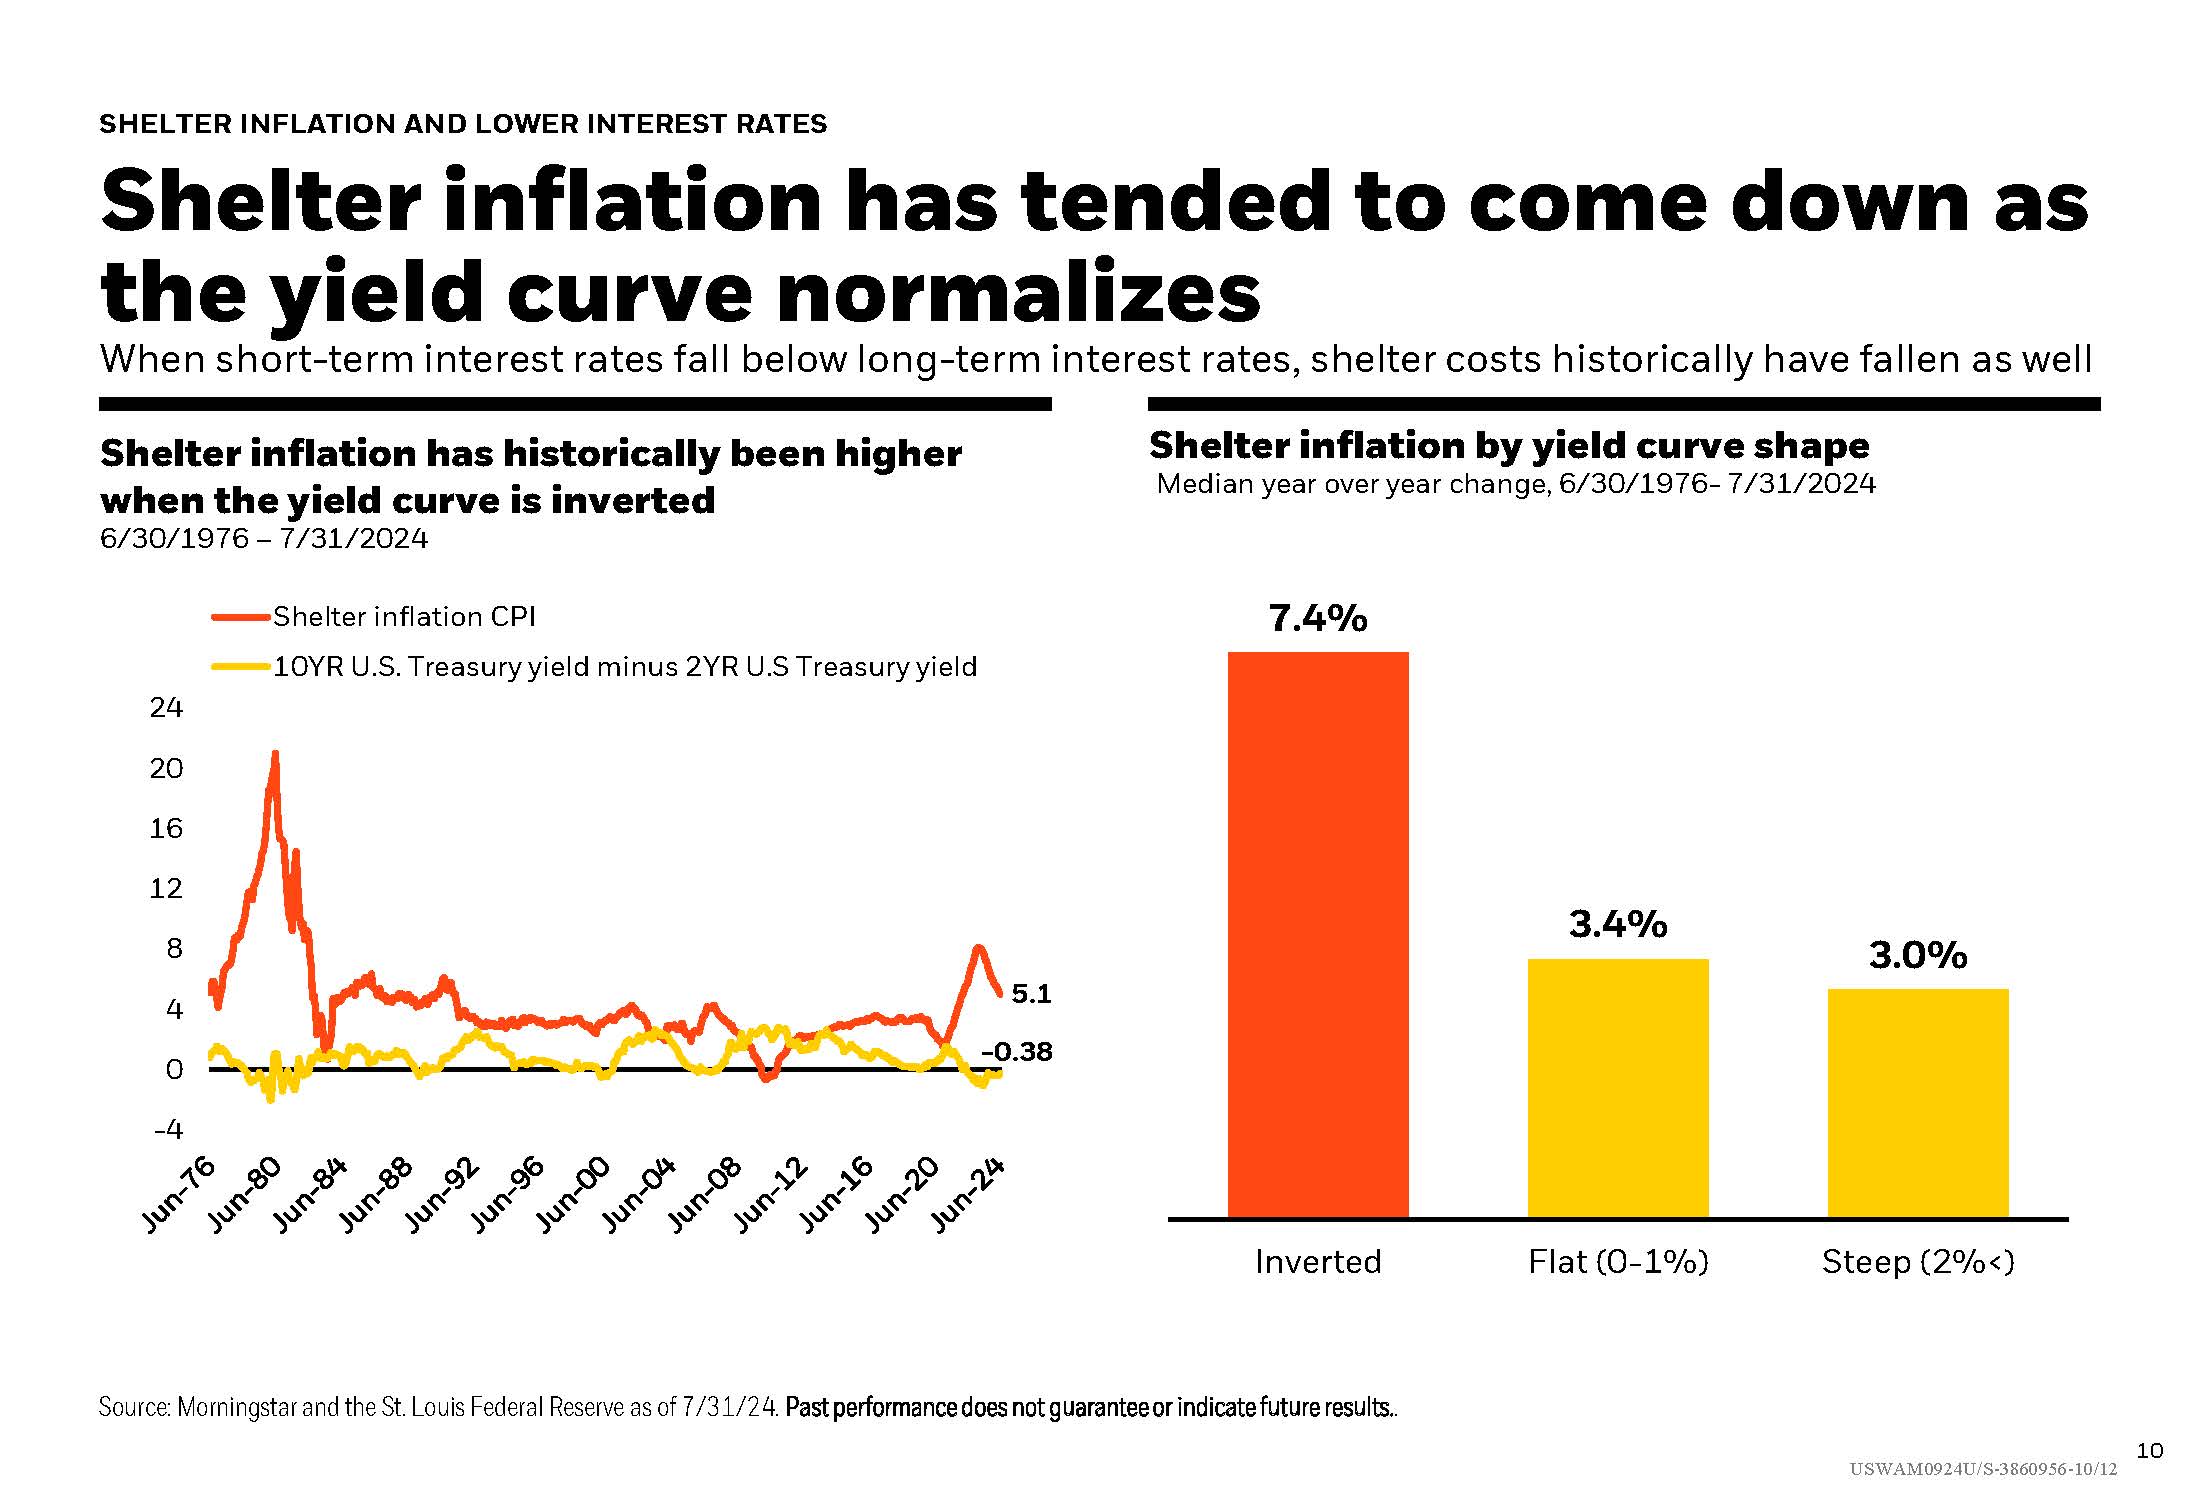
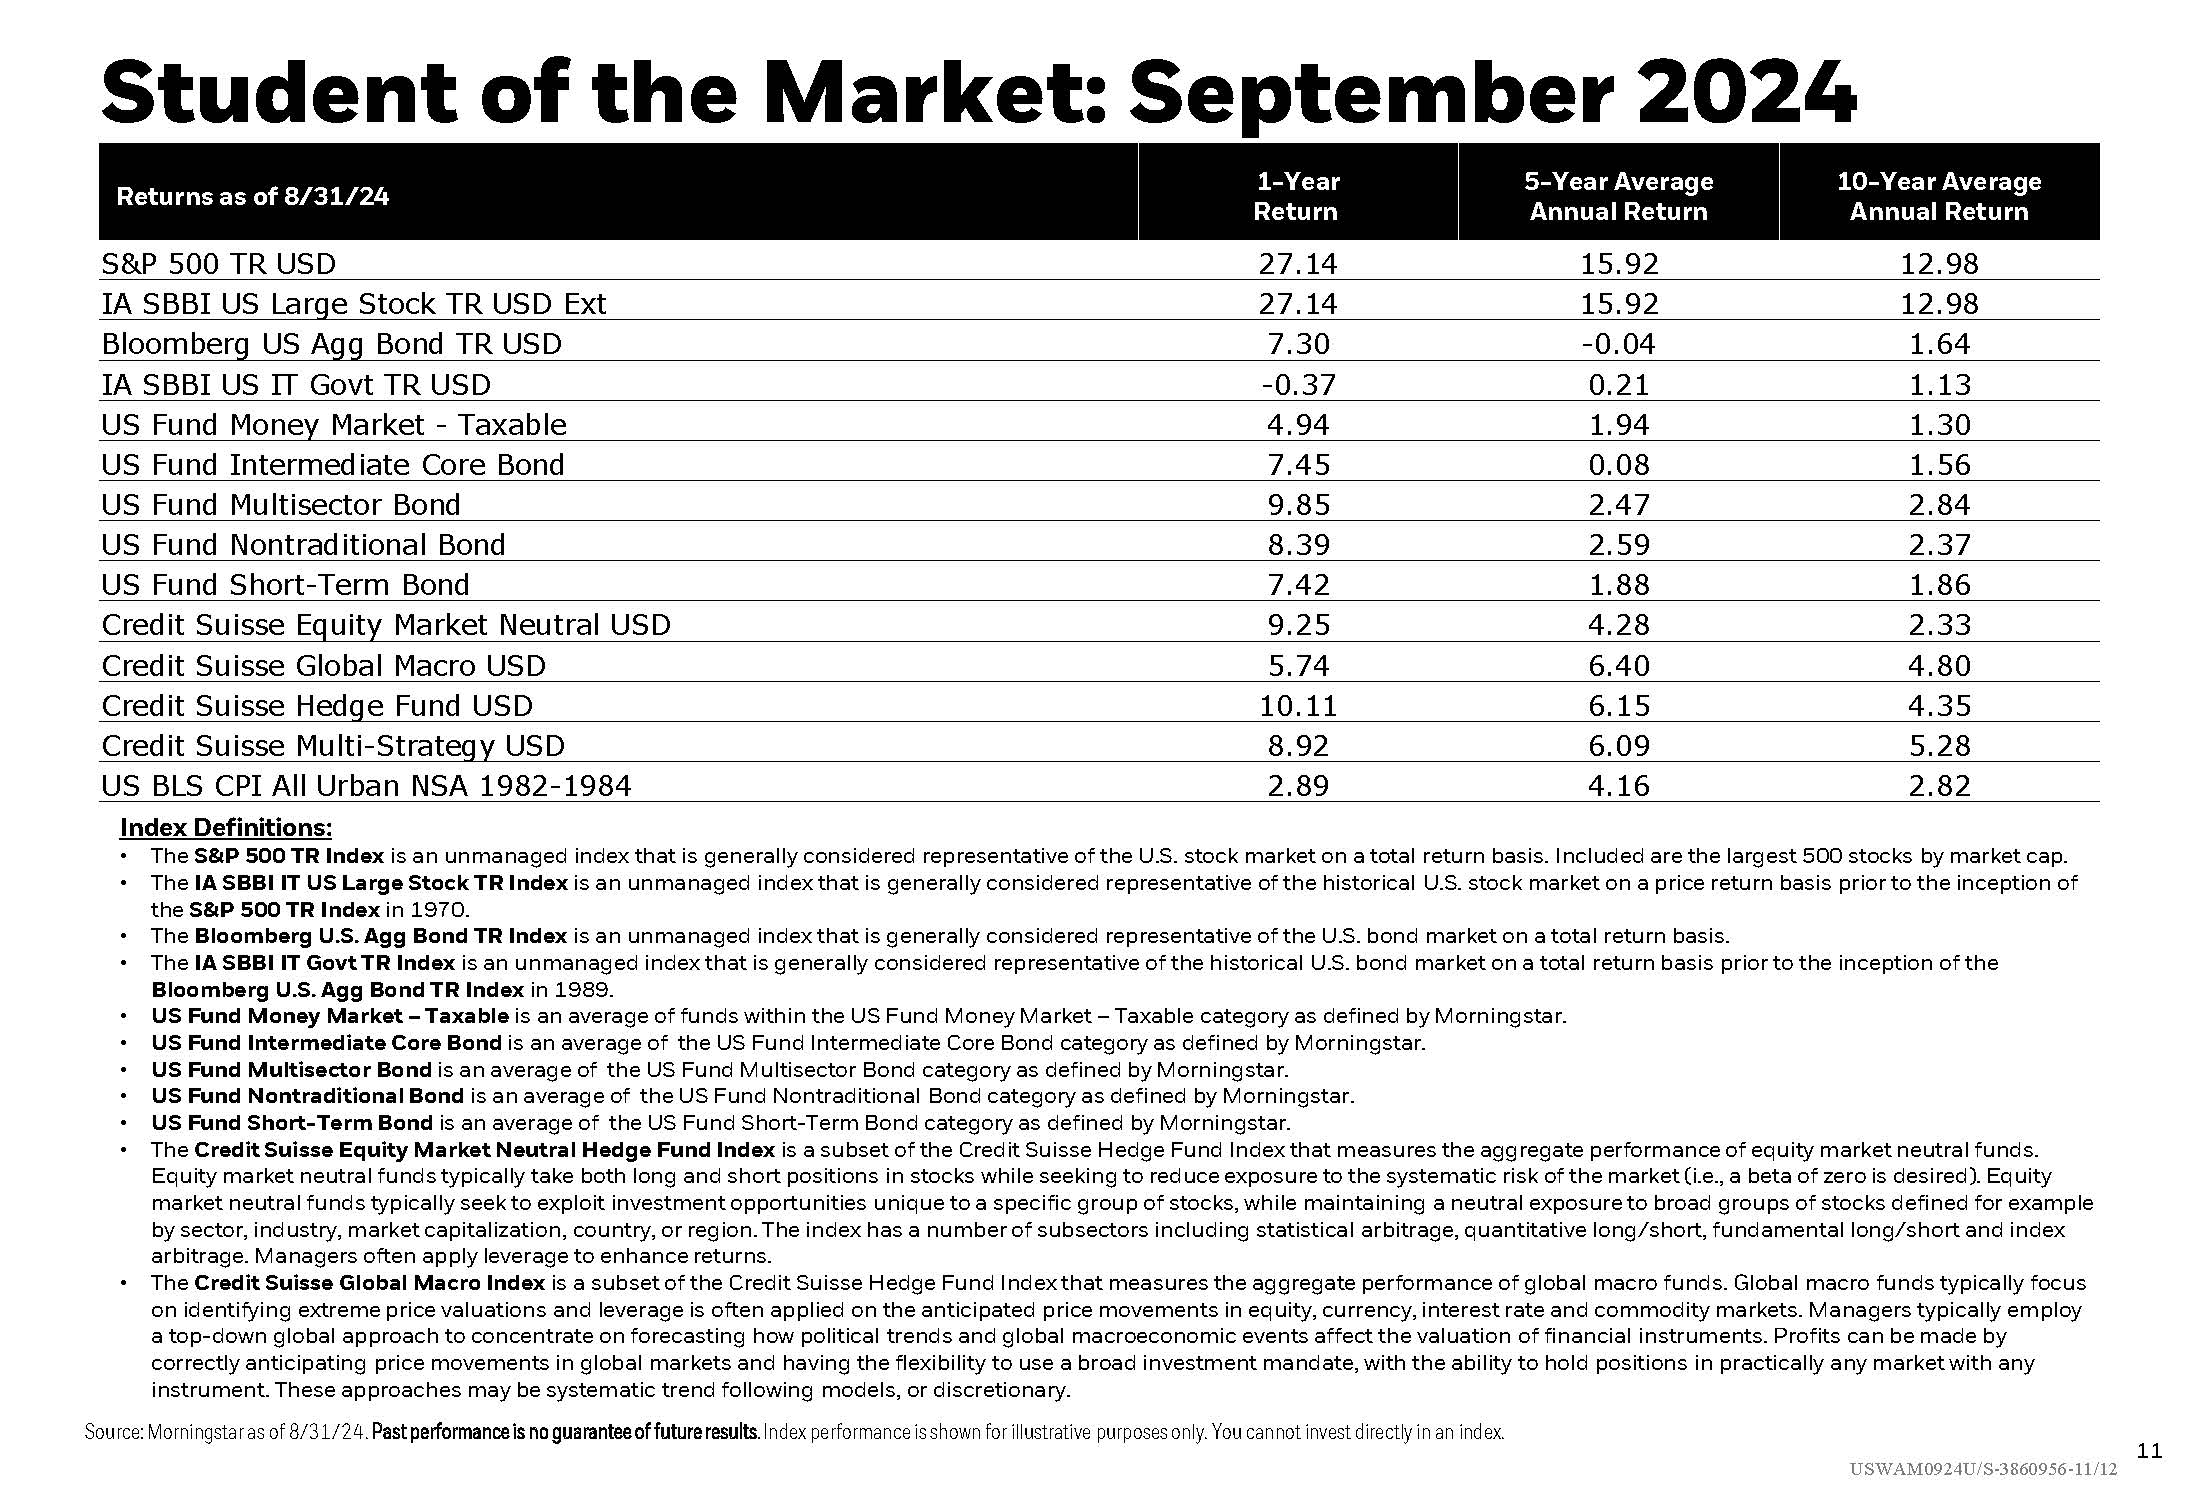
Looking at average starts in U.S. Stocks in an election year, this Student of the Market looks at historical data on how the best starts carry into the rest of the year. Big swings in interest rates are examined in bond returns and compared with money market funds. And stats to indicate a normalization in the yield curve.

September 24, 2024
Important Disclosure: Content on our website and in our newsletters is for informational purposes only. The information provided may (or may not) directly apply to your situation. We recommend that readers work directly with a professional advisor when making decisions in the context of their specific situation.

Other content you may like

  • Investing Can Feel Turbulent

    Investing Can Feel Turbulent

    September 20, 2022
    After a big July for stocks, August was a bit disappointing at -4.1% even though historically the average return after “best months” is 1.1%. This month’s Student of the Market looks at those type of U.S. Stock Market ups and downs from a historical point of view, offering some relief to turbulent feelings by looking at the big picture.
    Read this Article
  • Podcast Highlight - Value vs Growth

    November 28, 2023
    David gives insight into the difference between being a value investor and investing in value as a style.
    Read this Article
  • Redefining Yuppie in Today’s Terms

    Redefining "Yuppie" in Today's Terms

    March 28, 2024
    With inclinations towards self-employment, sustainable living, and health conscious choices, emerging young professionals are often driven by evolving societal values and emerging economic landscapes. Here’s a deeper look at how a financial advisor can help craft a path to success that embraces these important values.
    Read this Article
  • Money Market Assets at Historic Peak

    March 30, 2023
    This month’s Student of the Market looks at U.S. stock performance after peaks in Money Market fund assets and performance following peaks in inflation. The big question in many minds is “how long will this inflation last?” An answer might be found in these stats on prior inflation cycles. Plus a chart on a possible downside with risky income asset classes and more market insights.
    Read this Article
  • The link you have selected is located on another server. The linked site contains information that has been created, published, maintained, or otherwise posted by institutions or organizations independent of this organization. We do not endorse, approve, certify, or control any linked websites, their sponsors, or any of their policies, activities, products, or services. We do not assume responsibility for the accuracy, completeness, or timeliness of the information contained therein. Visitors to any linked websites should not use or rely on the information contained therein until they have consulted with an independent financial professional. Please click “Continue to Link” to leave this website and proceed to the selected site.
    phone-handset