Article

Stock Volatility by Presidential Election Year

Stock Volatility by Presidential Election Year

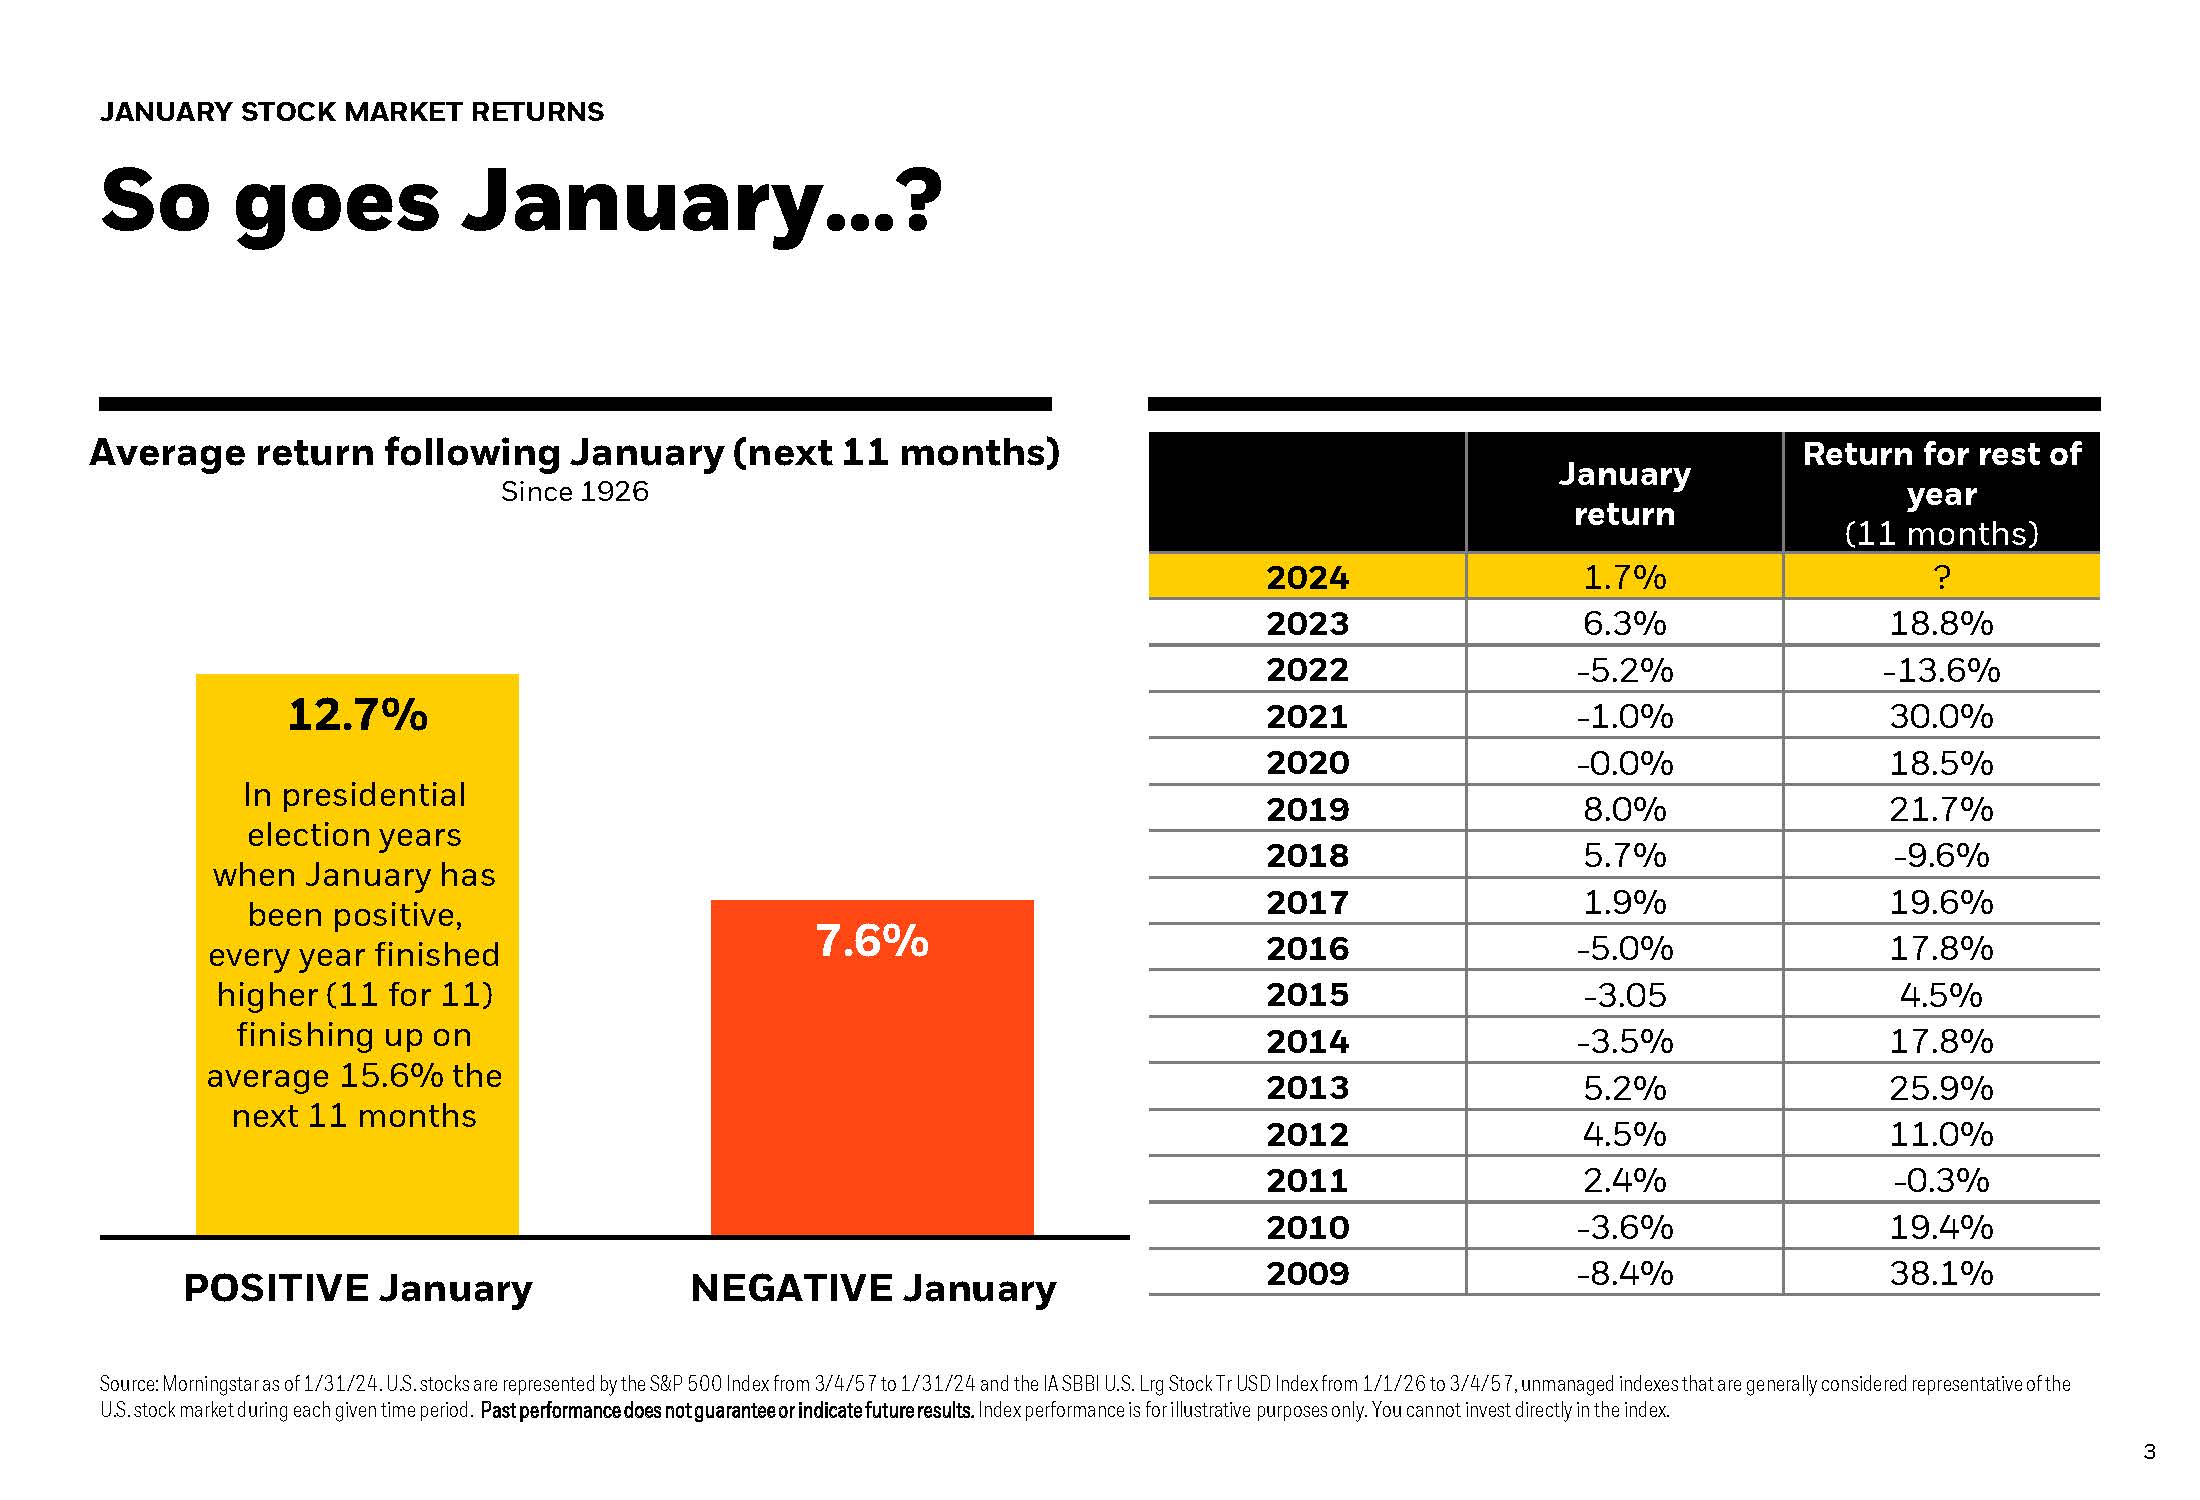
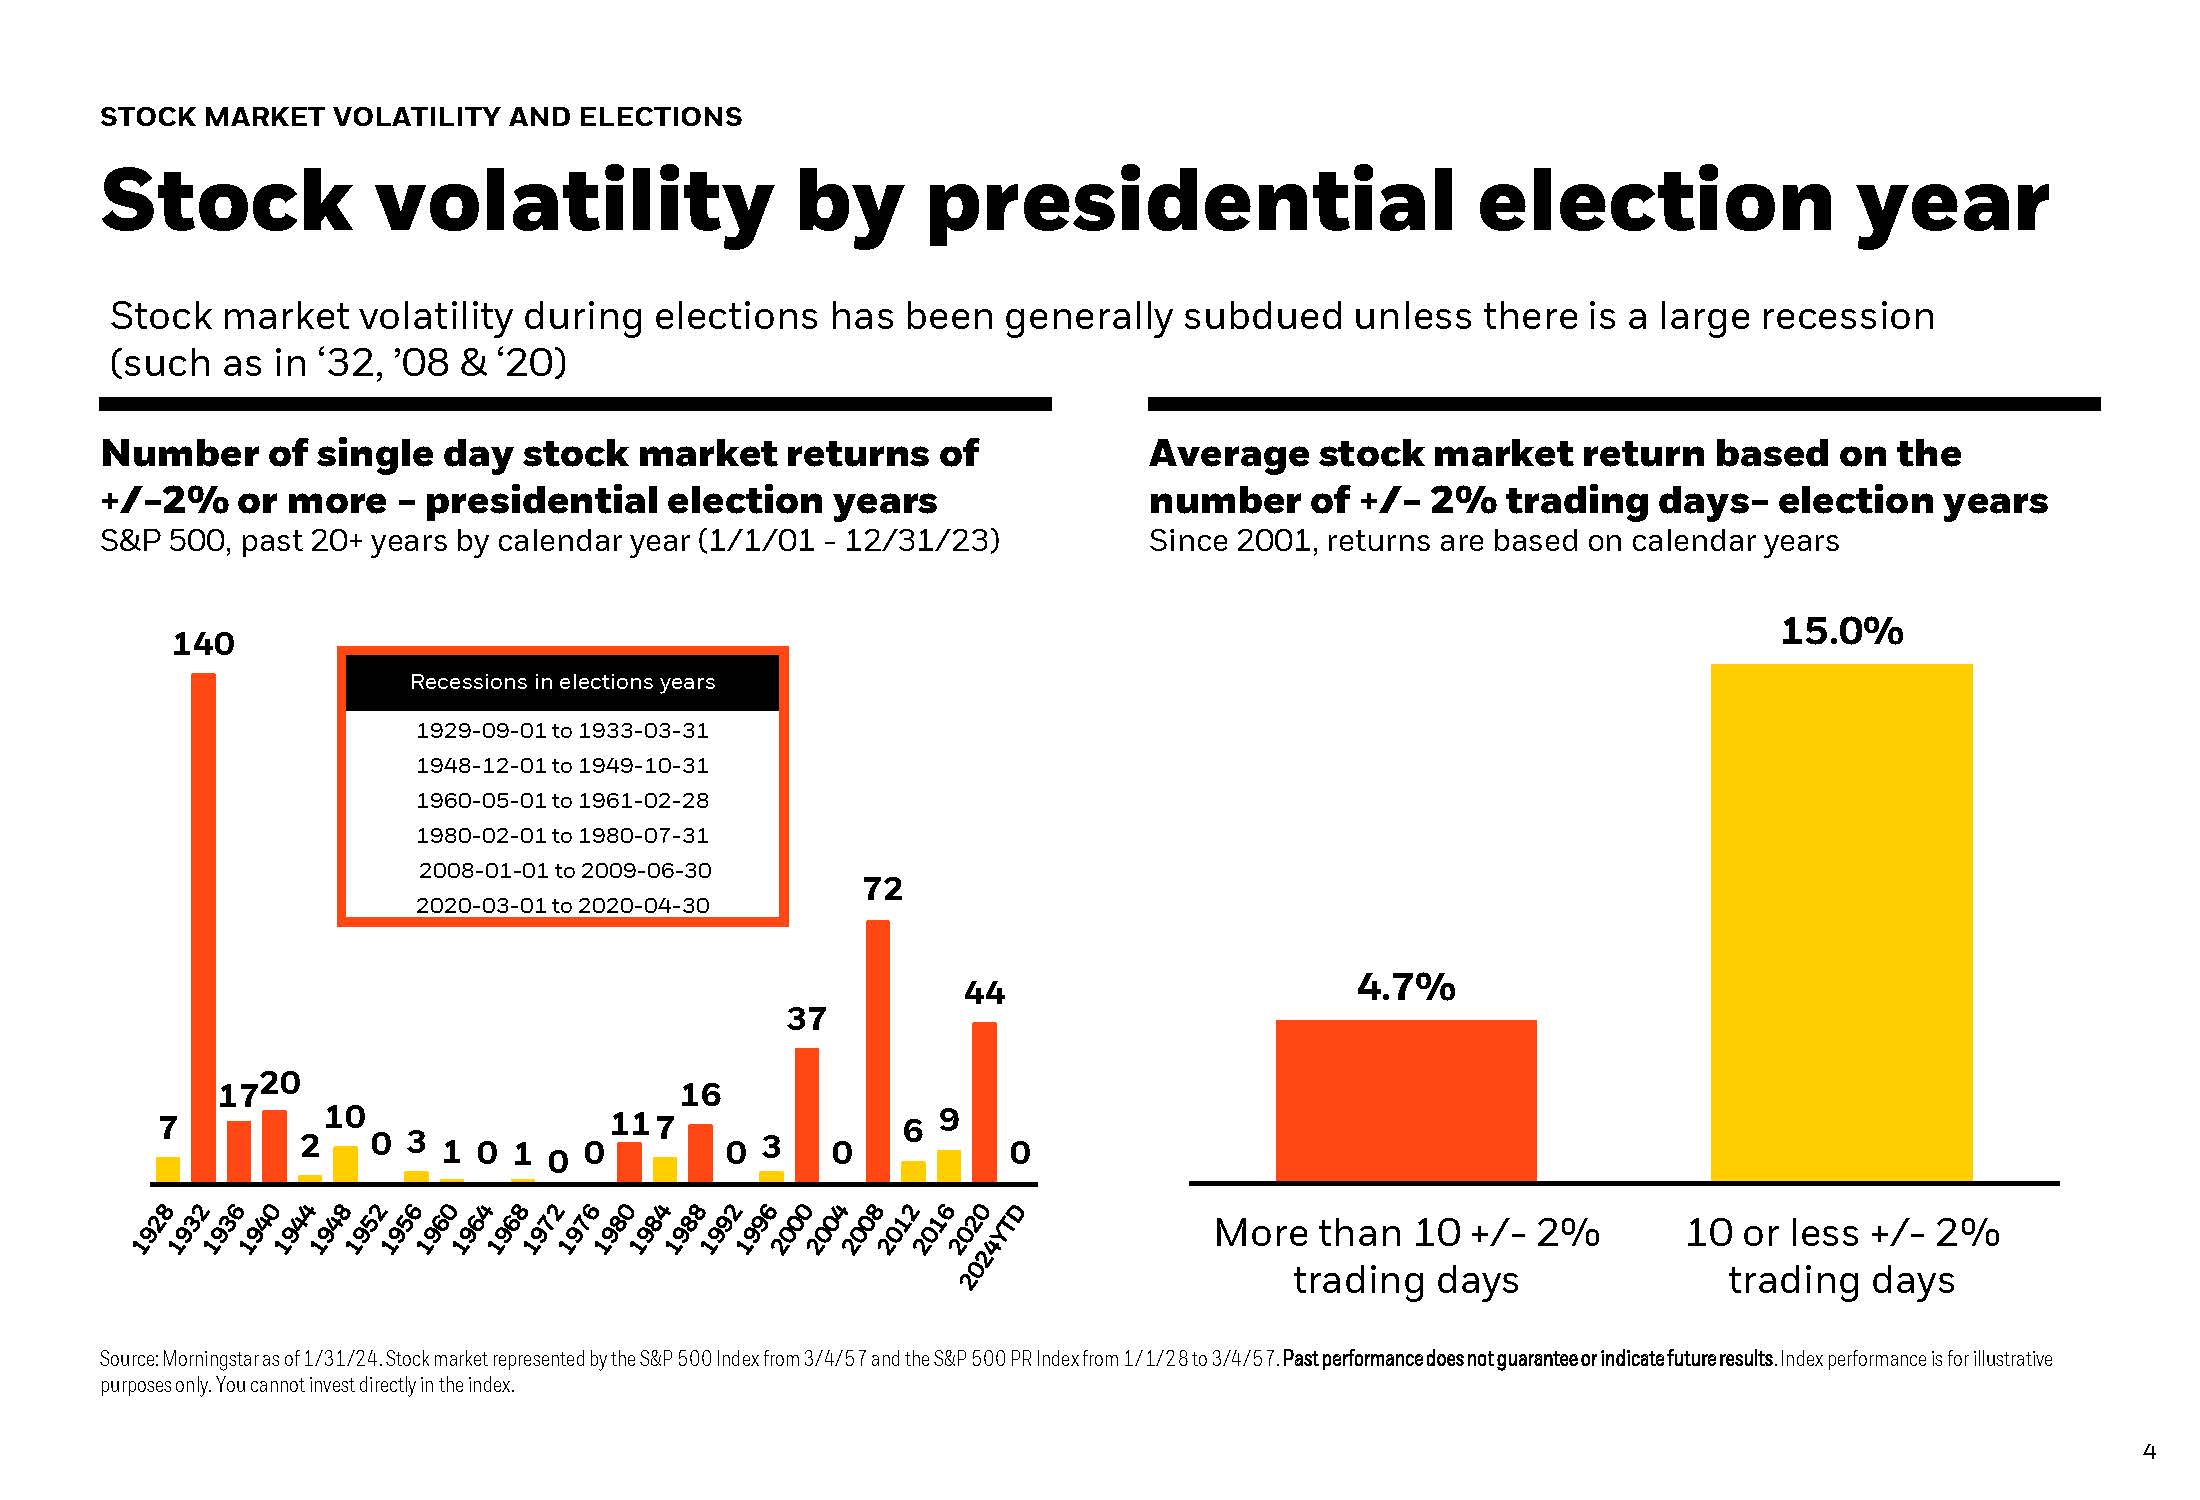
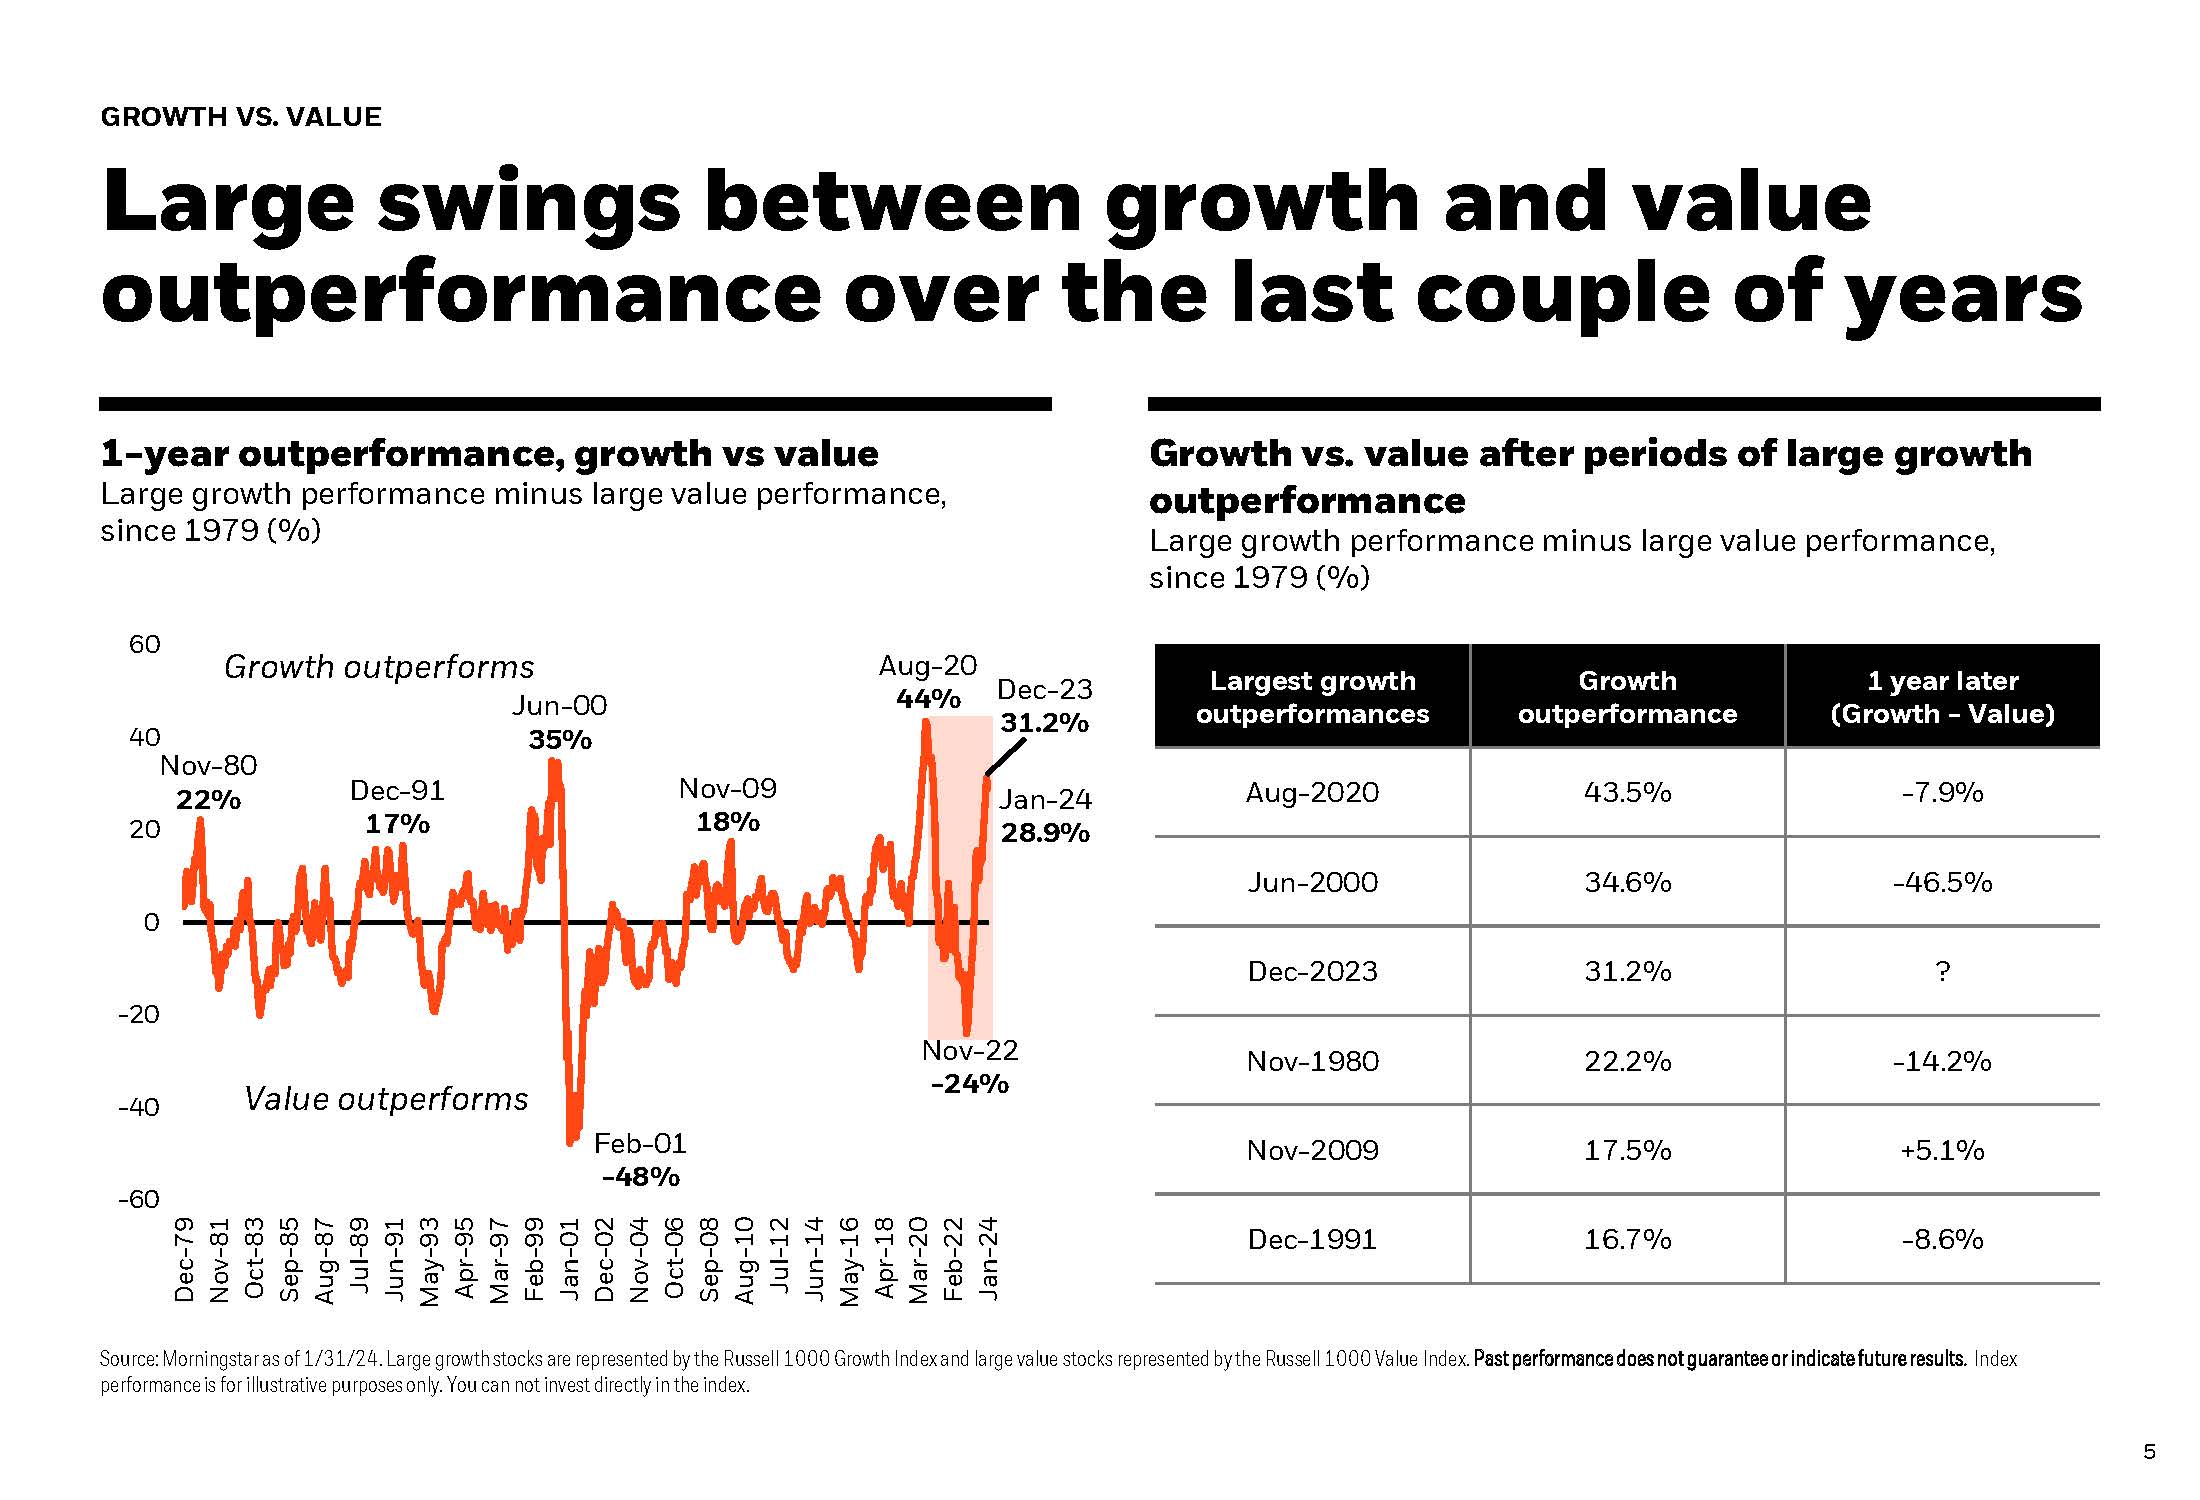
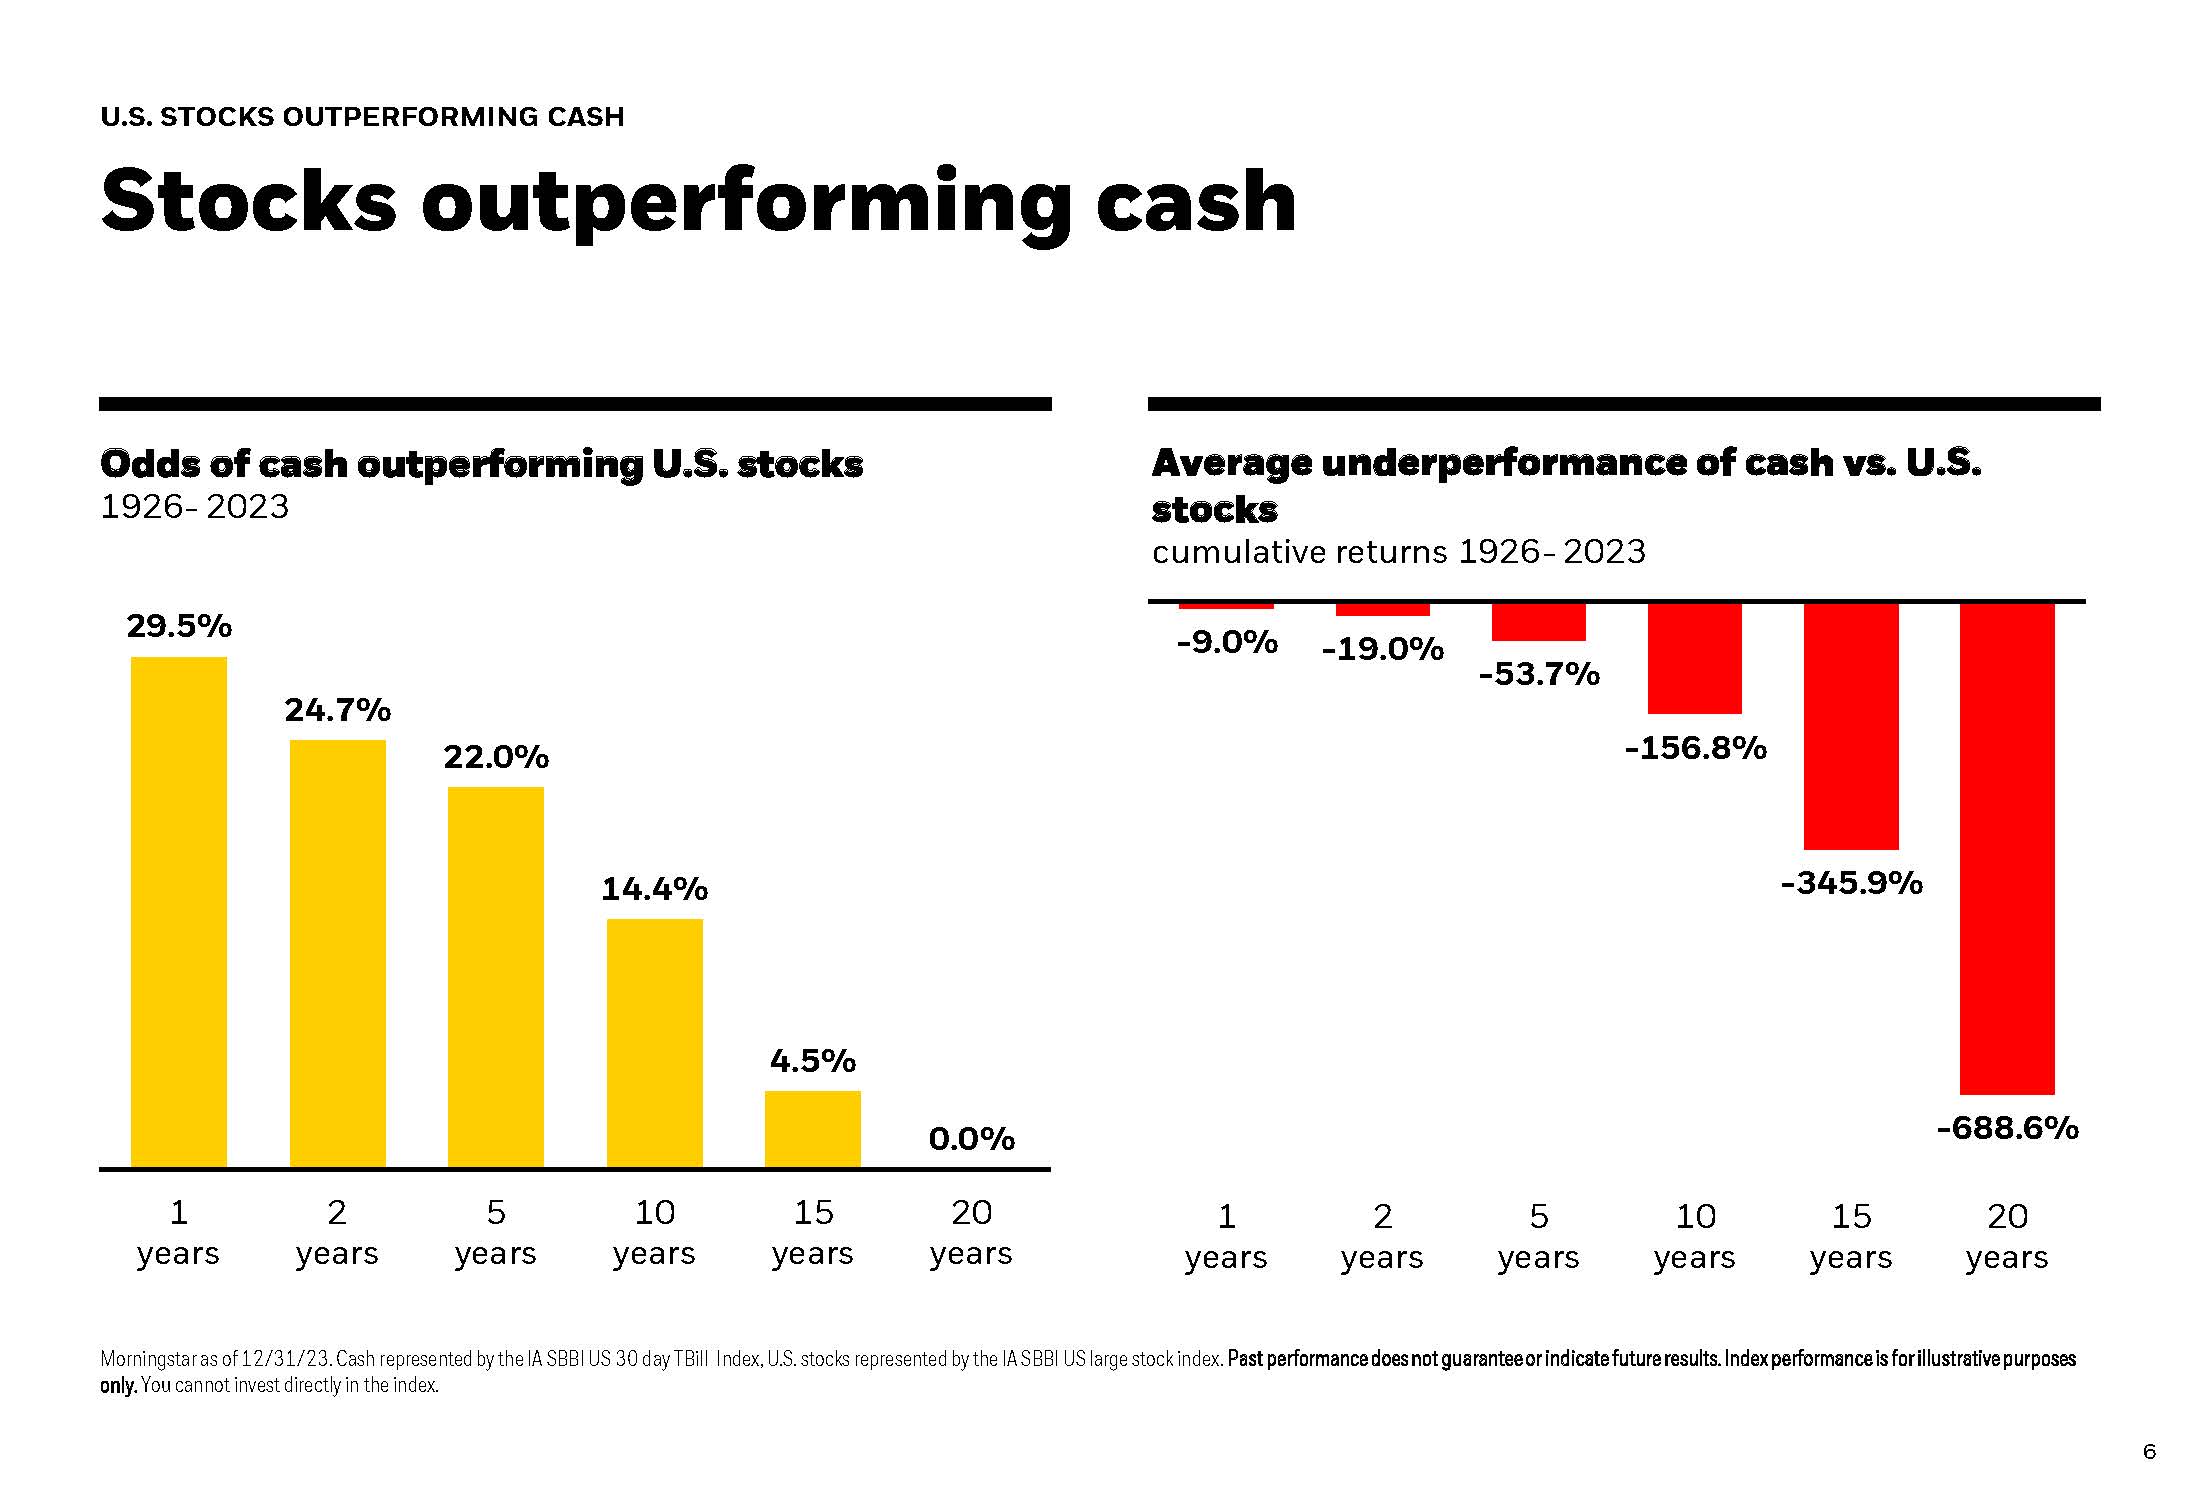
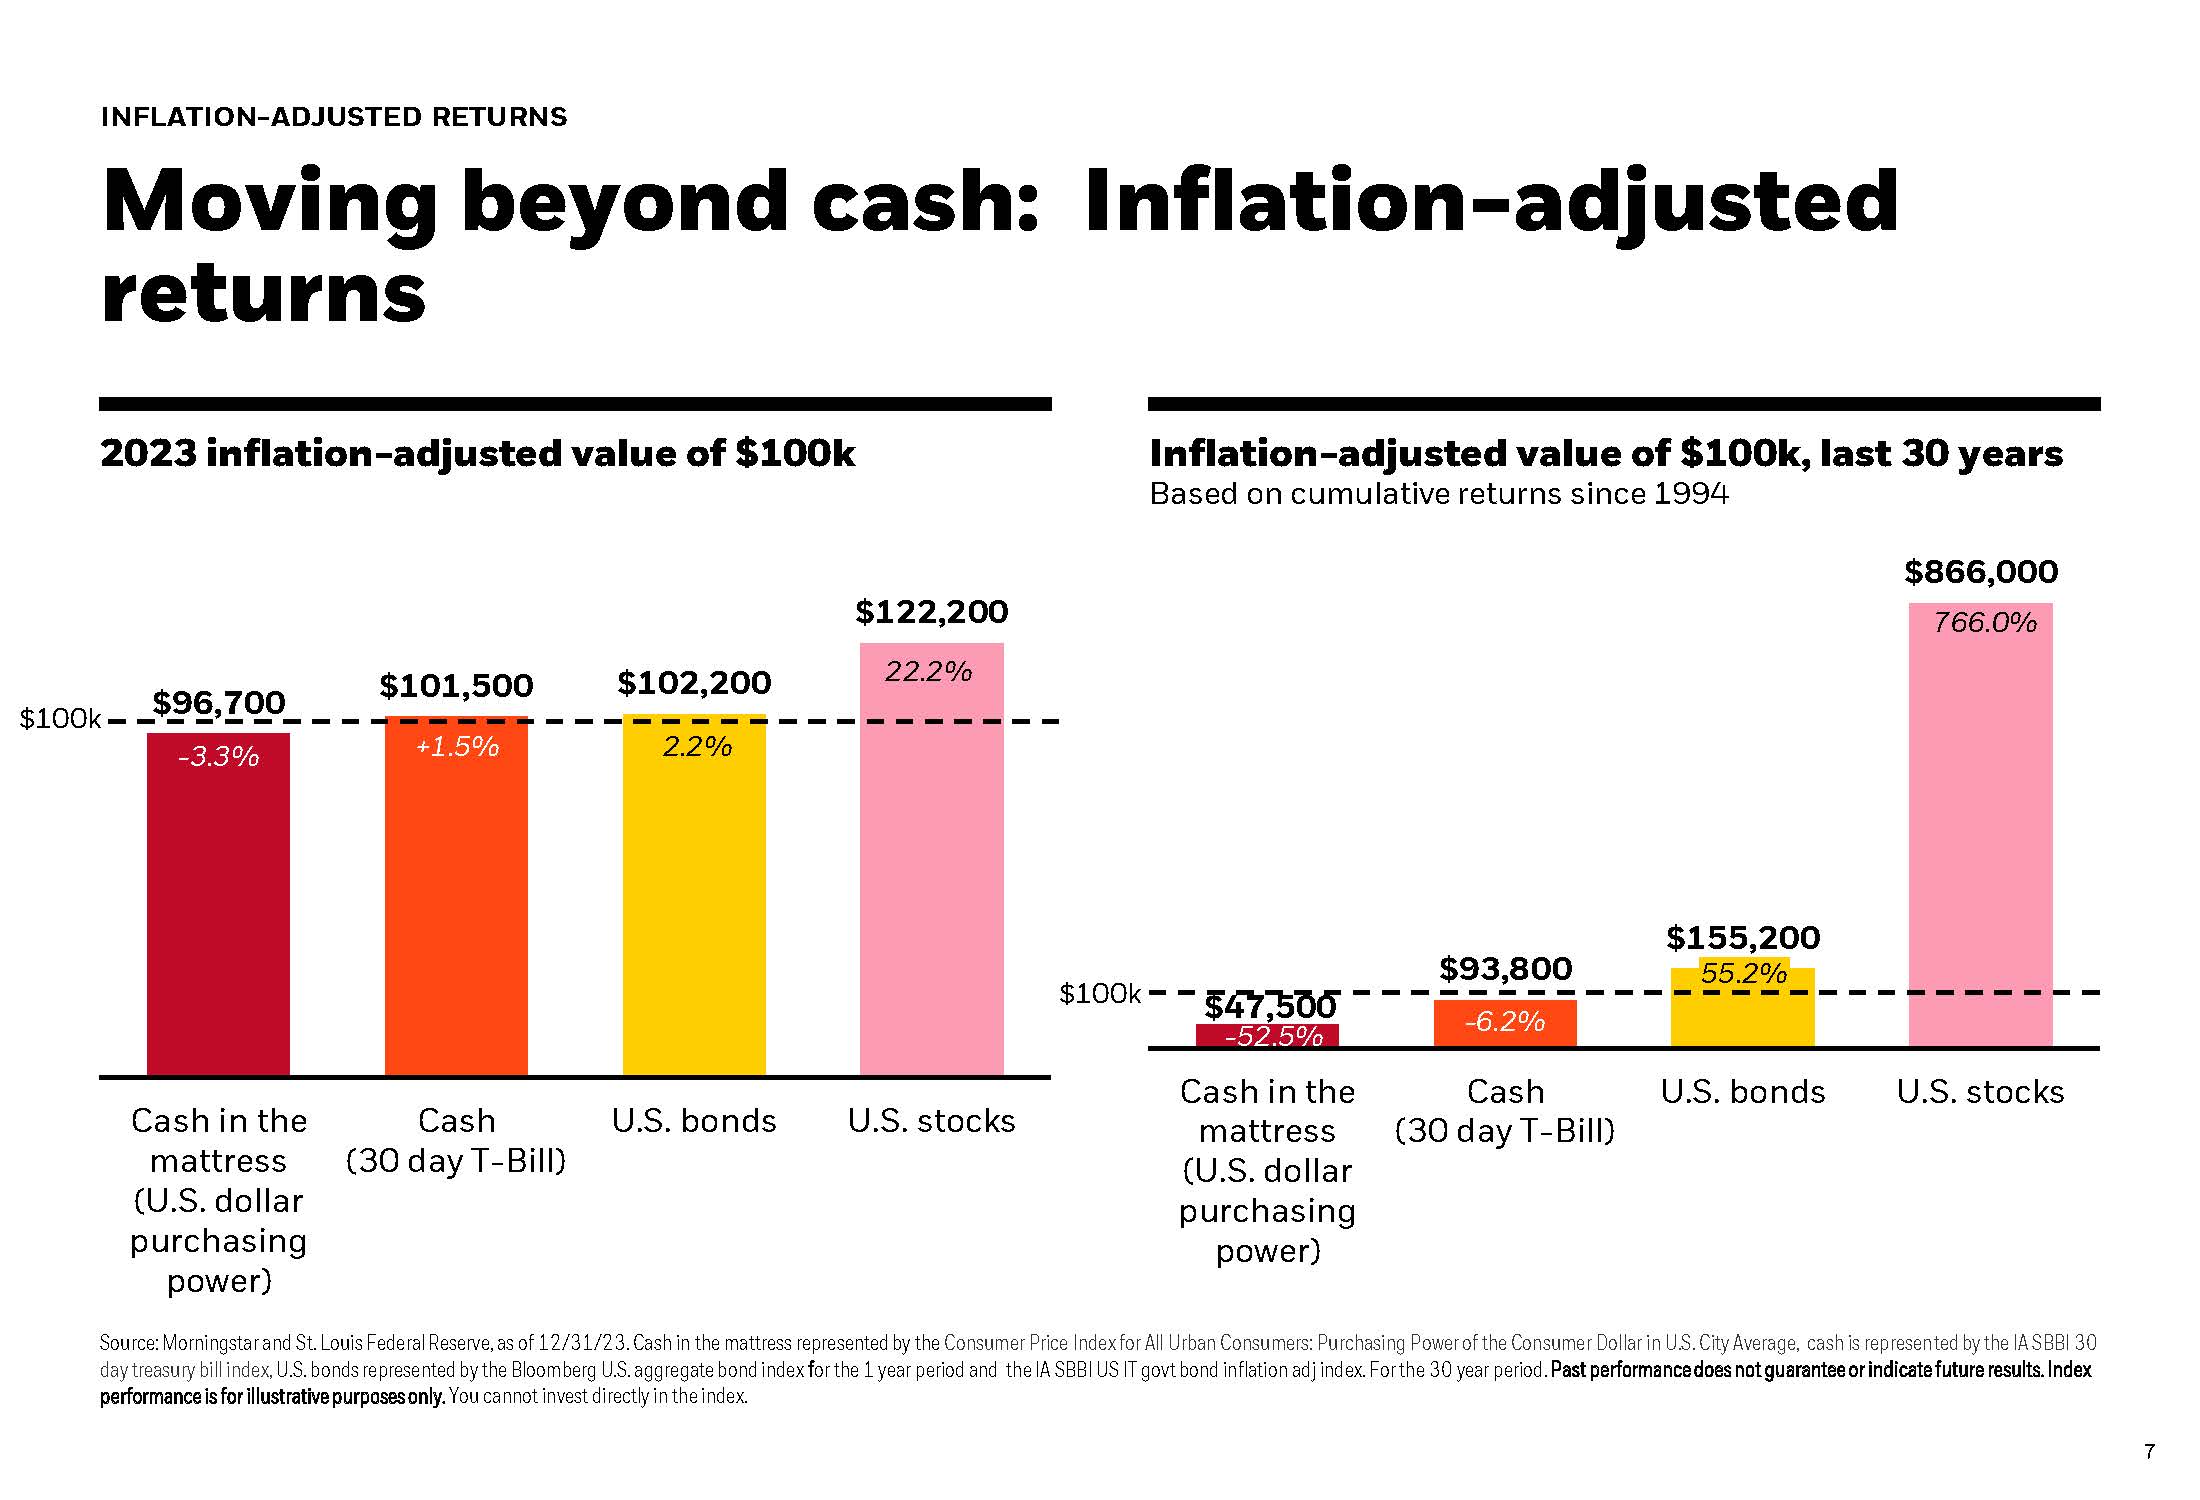
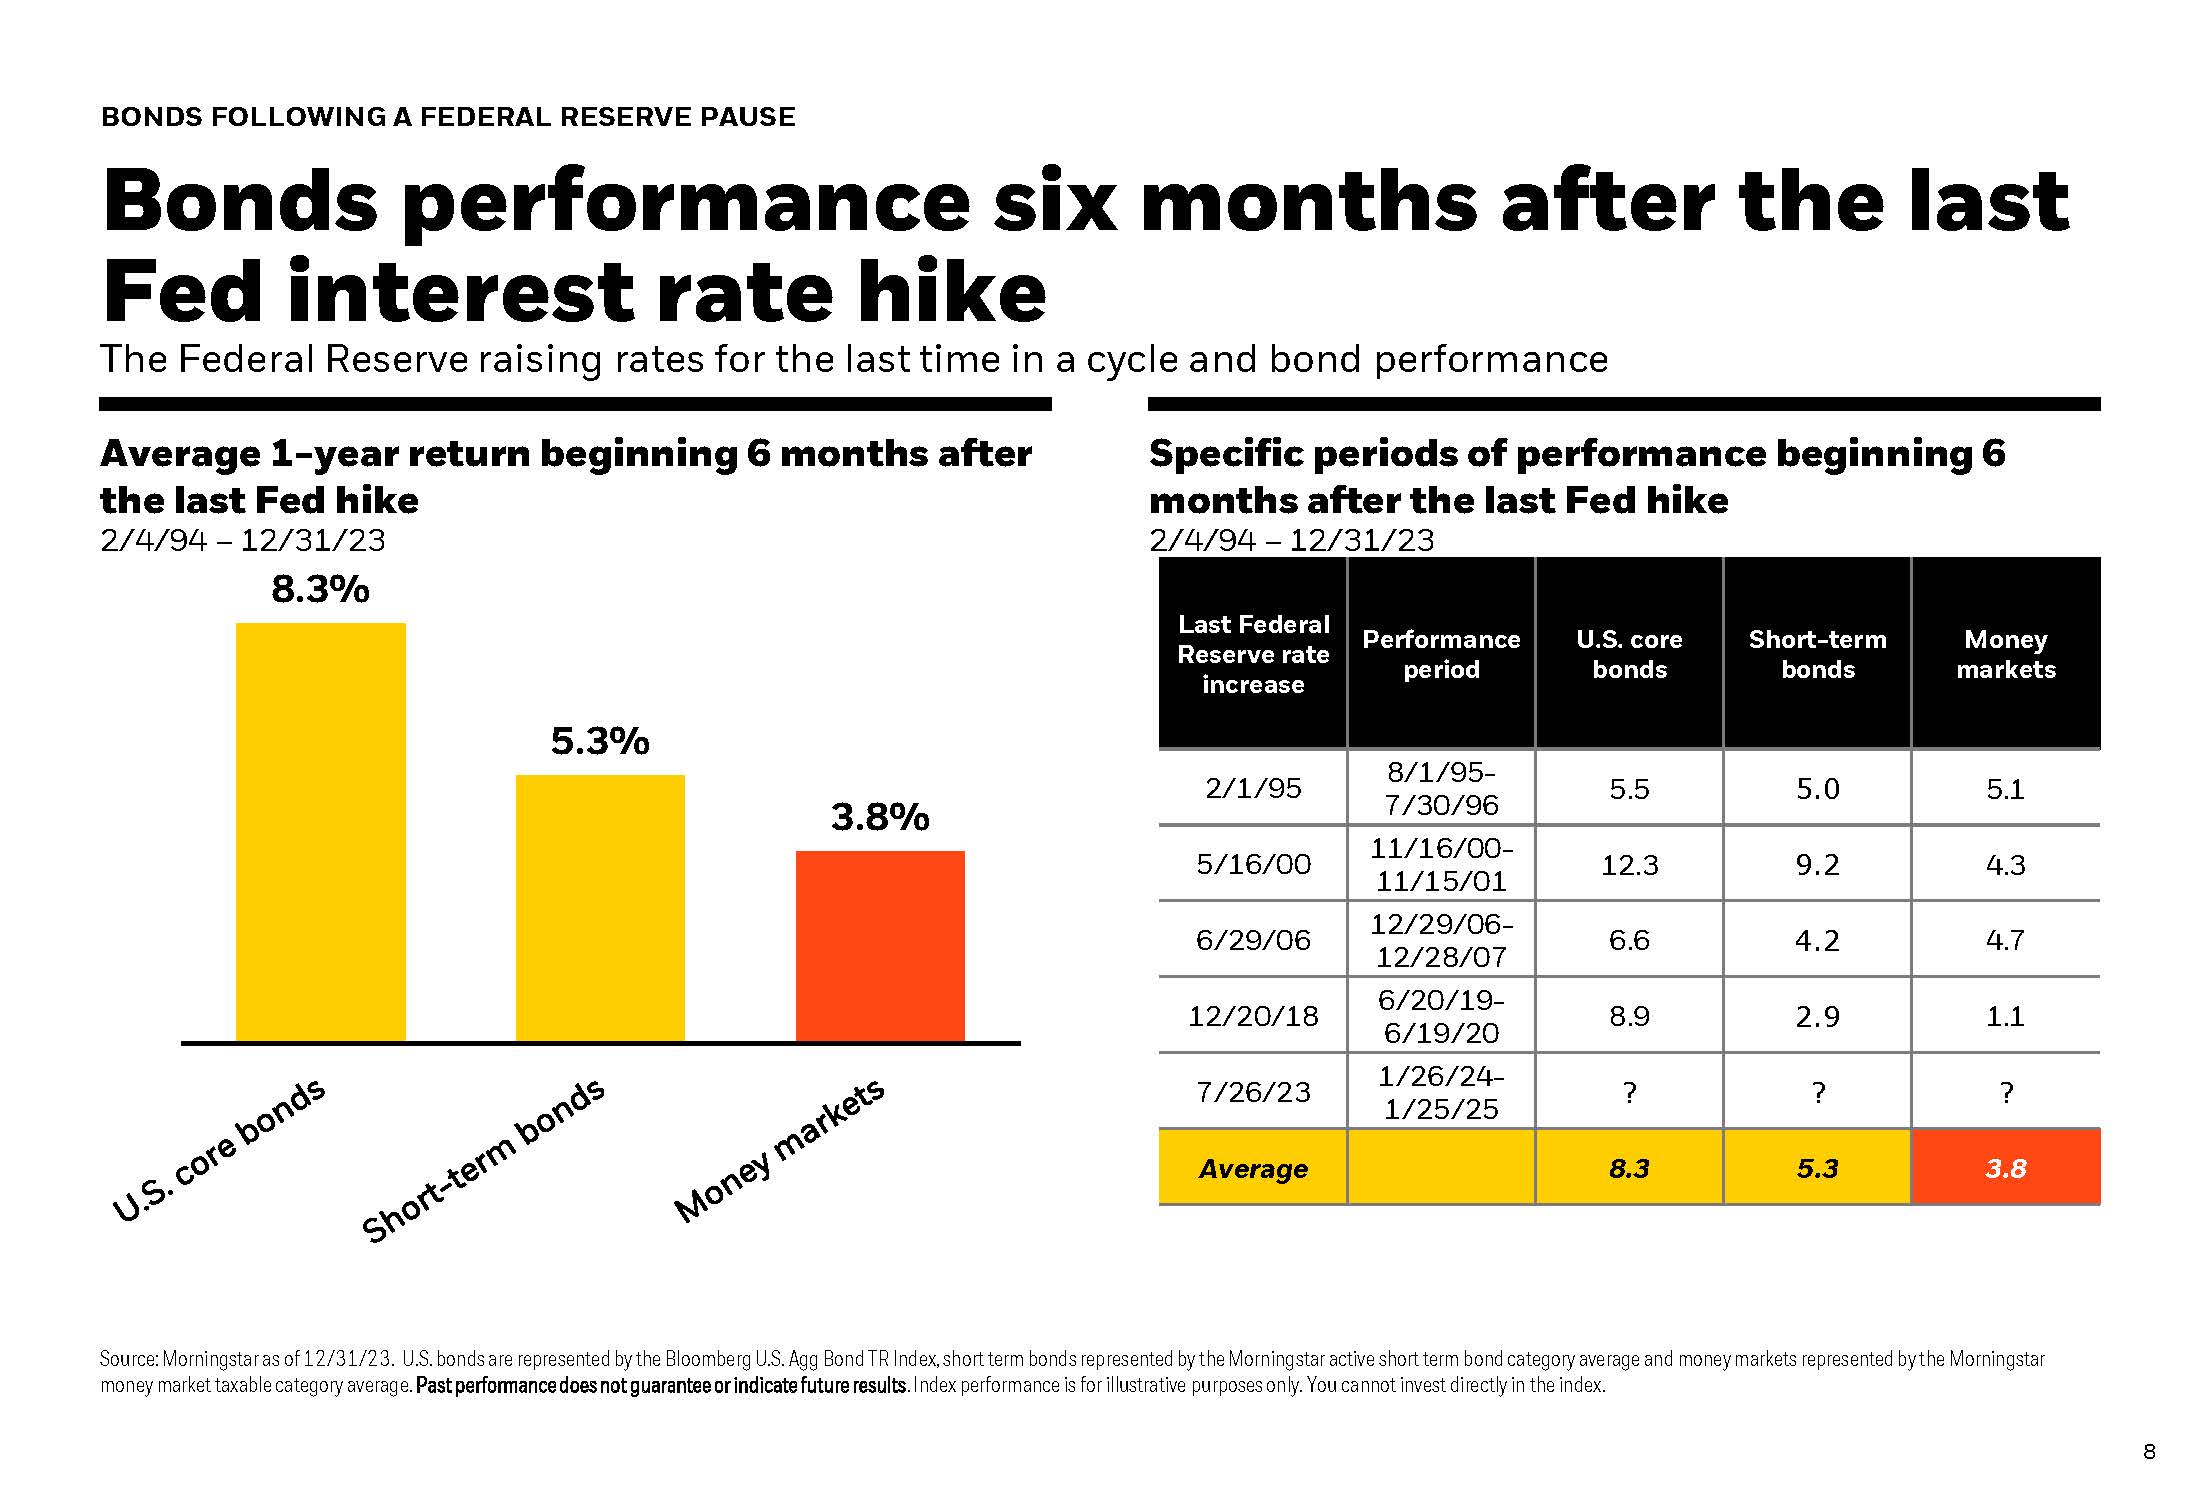
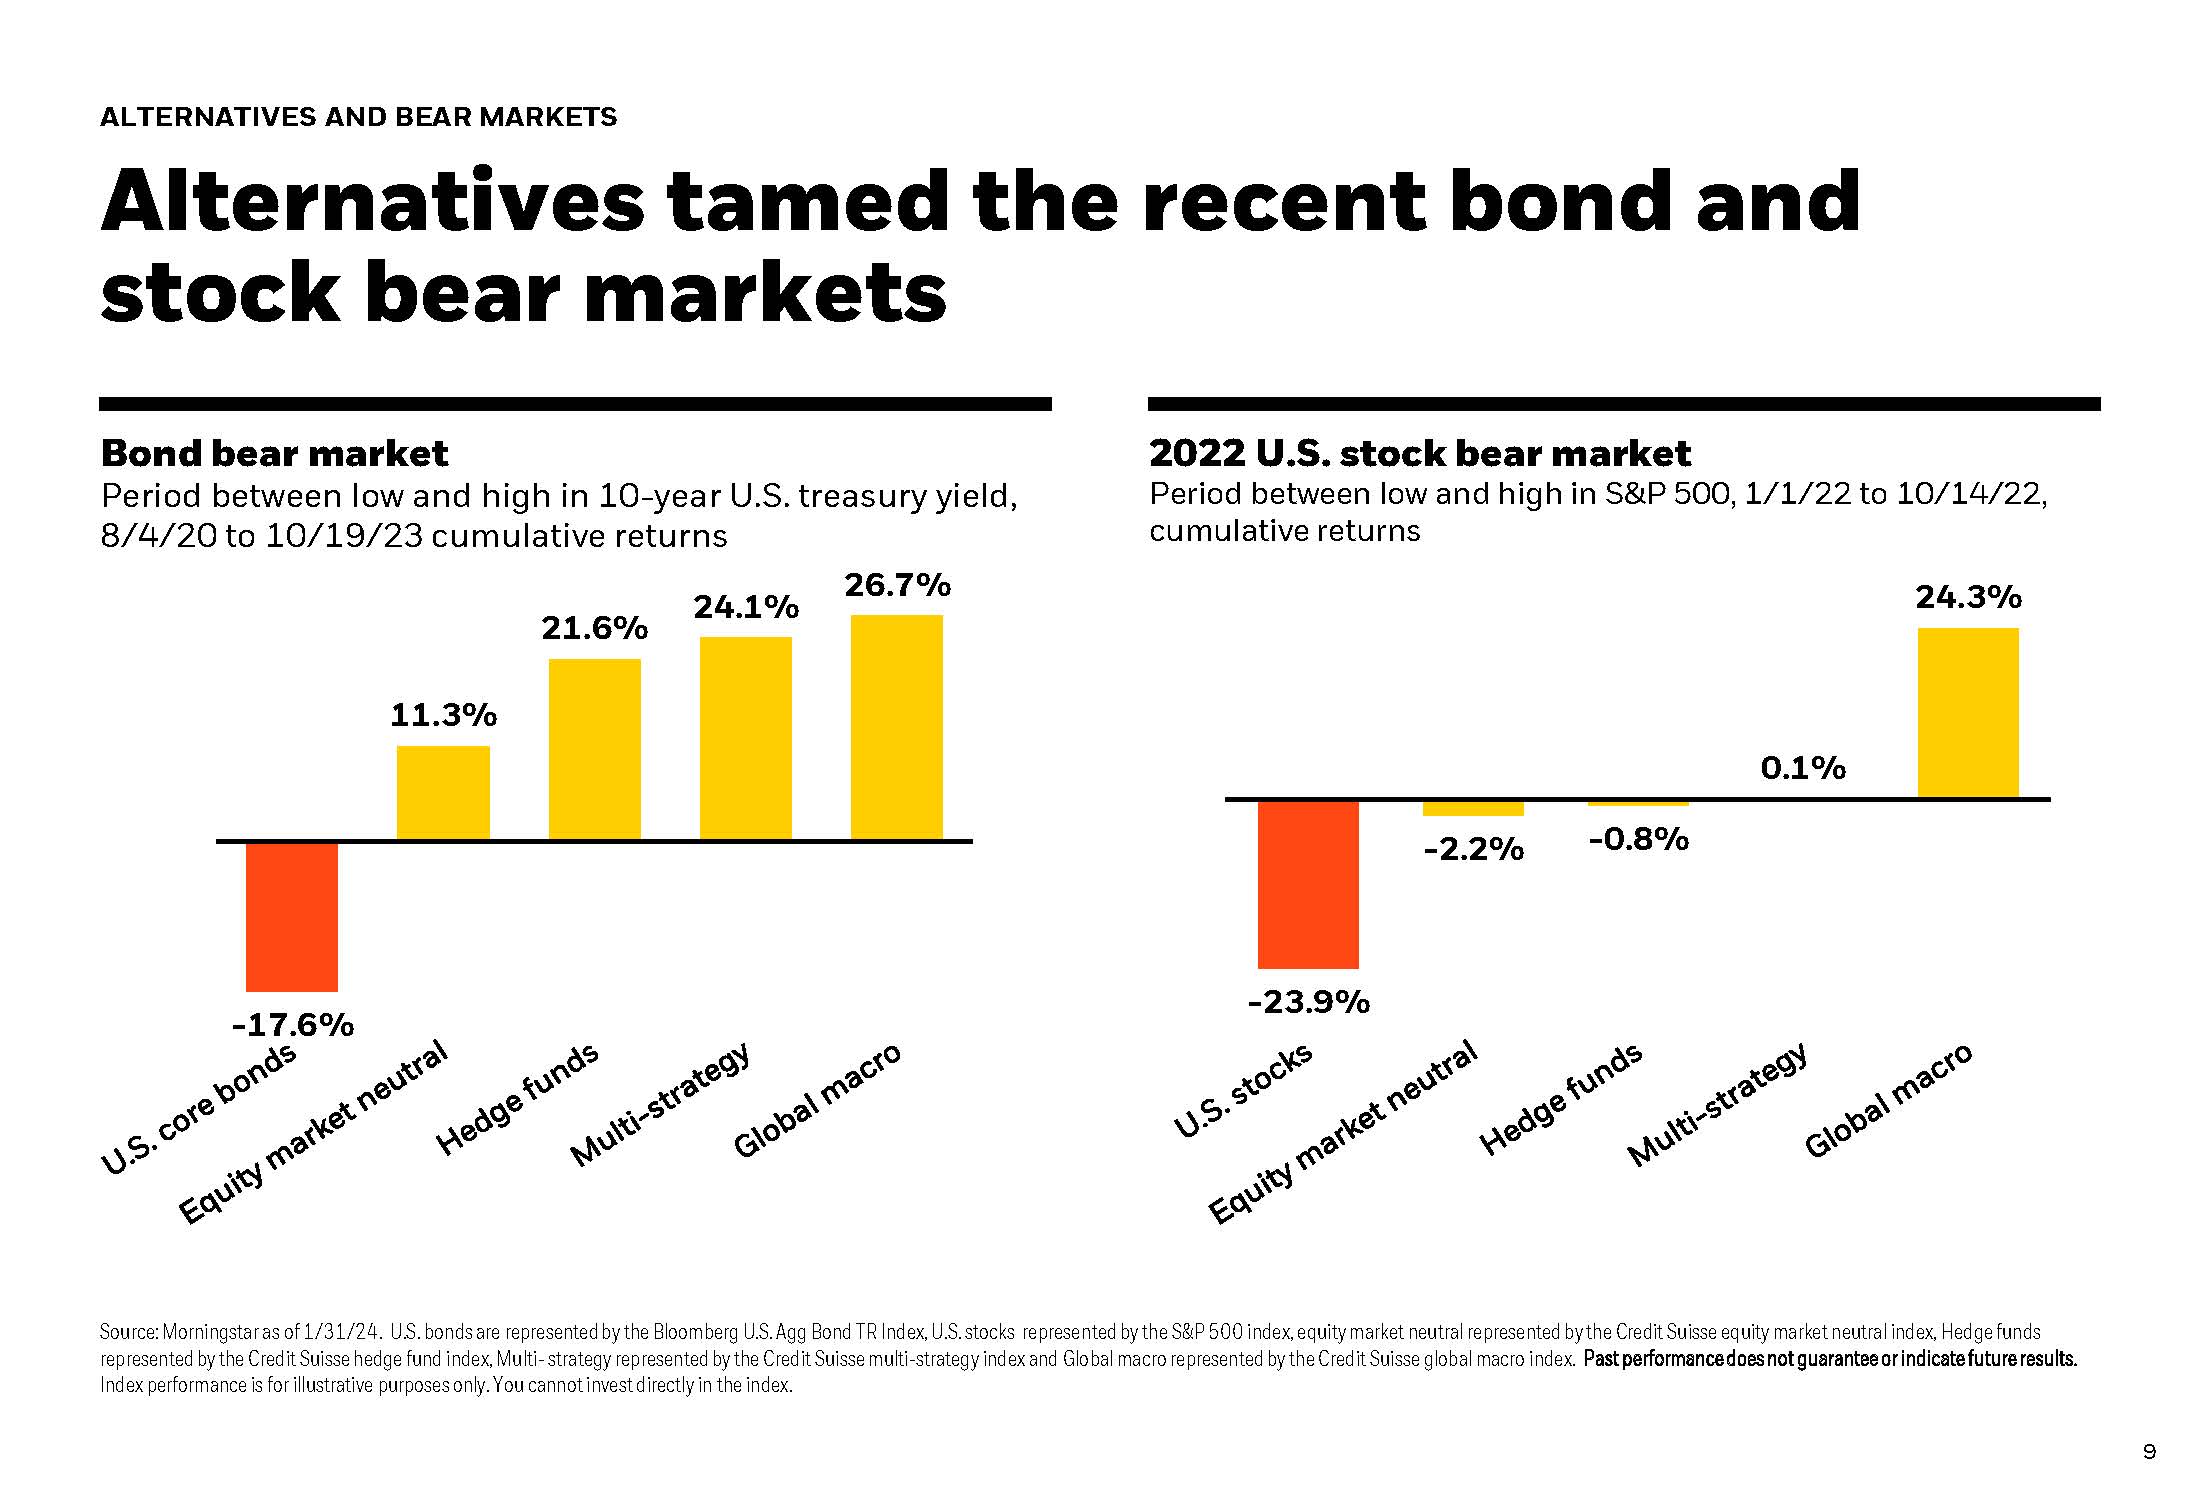
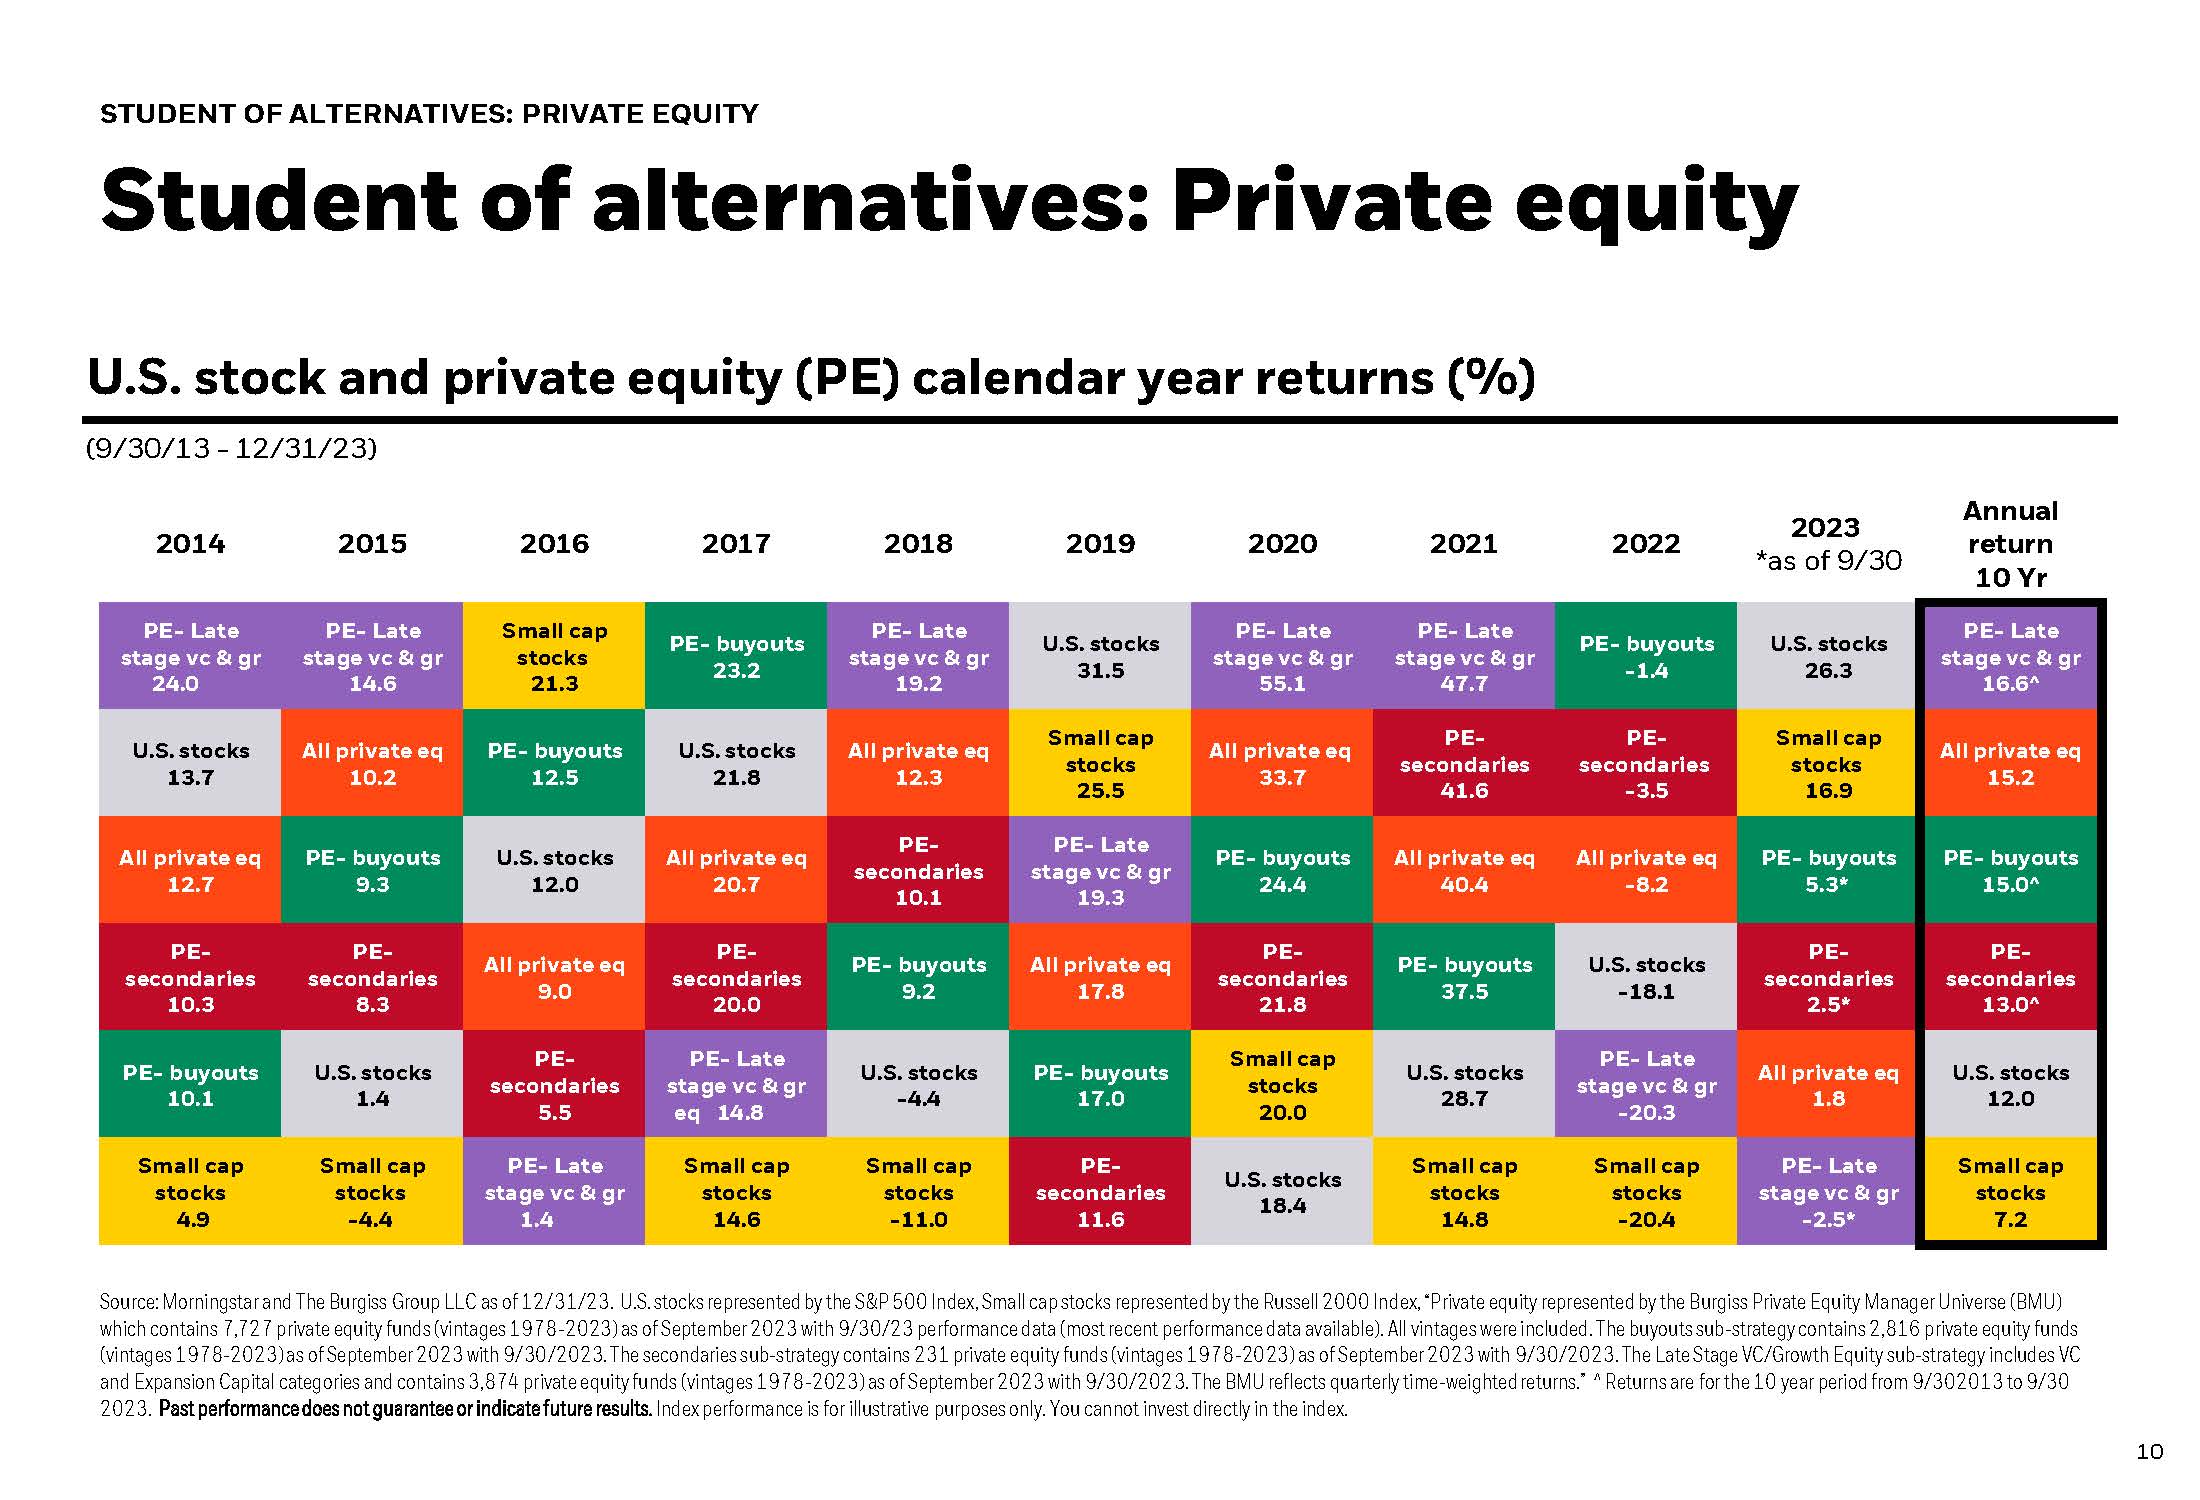
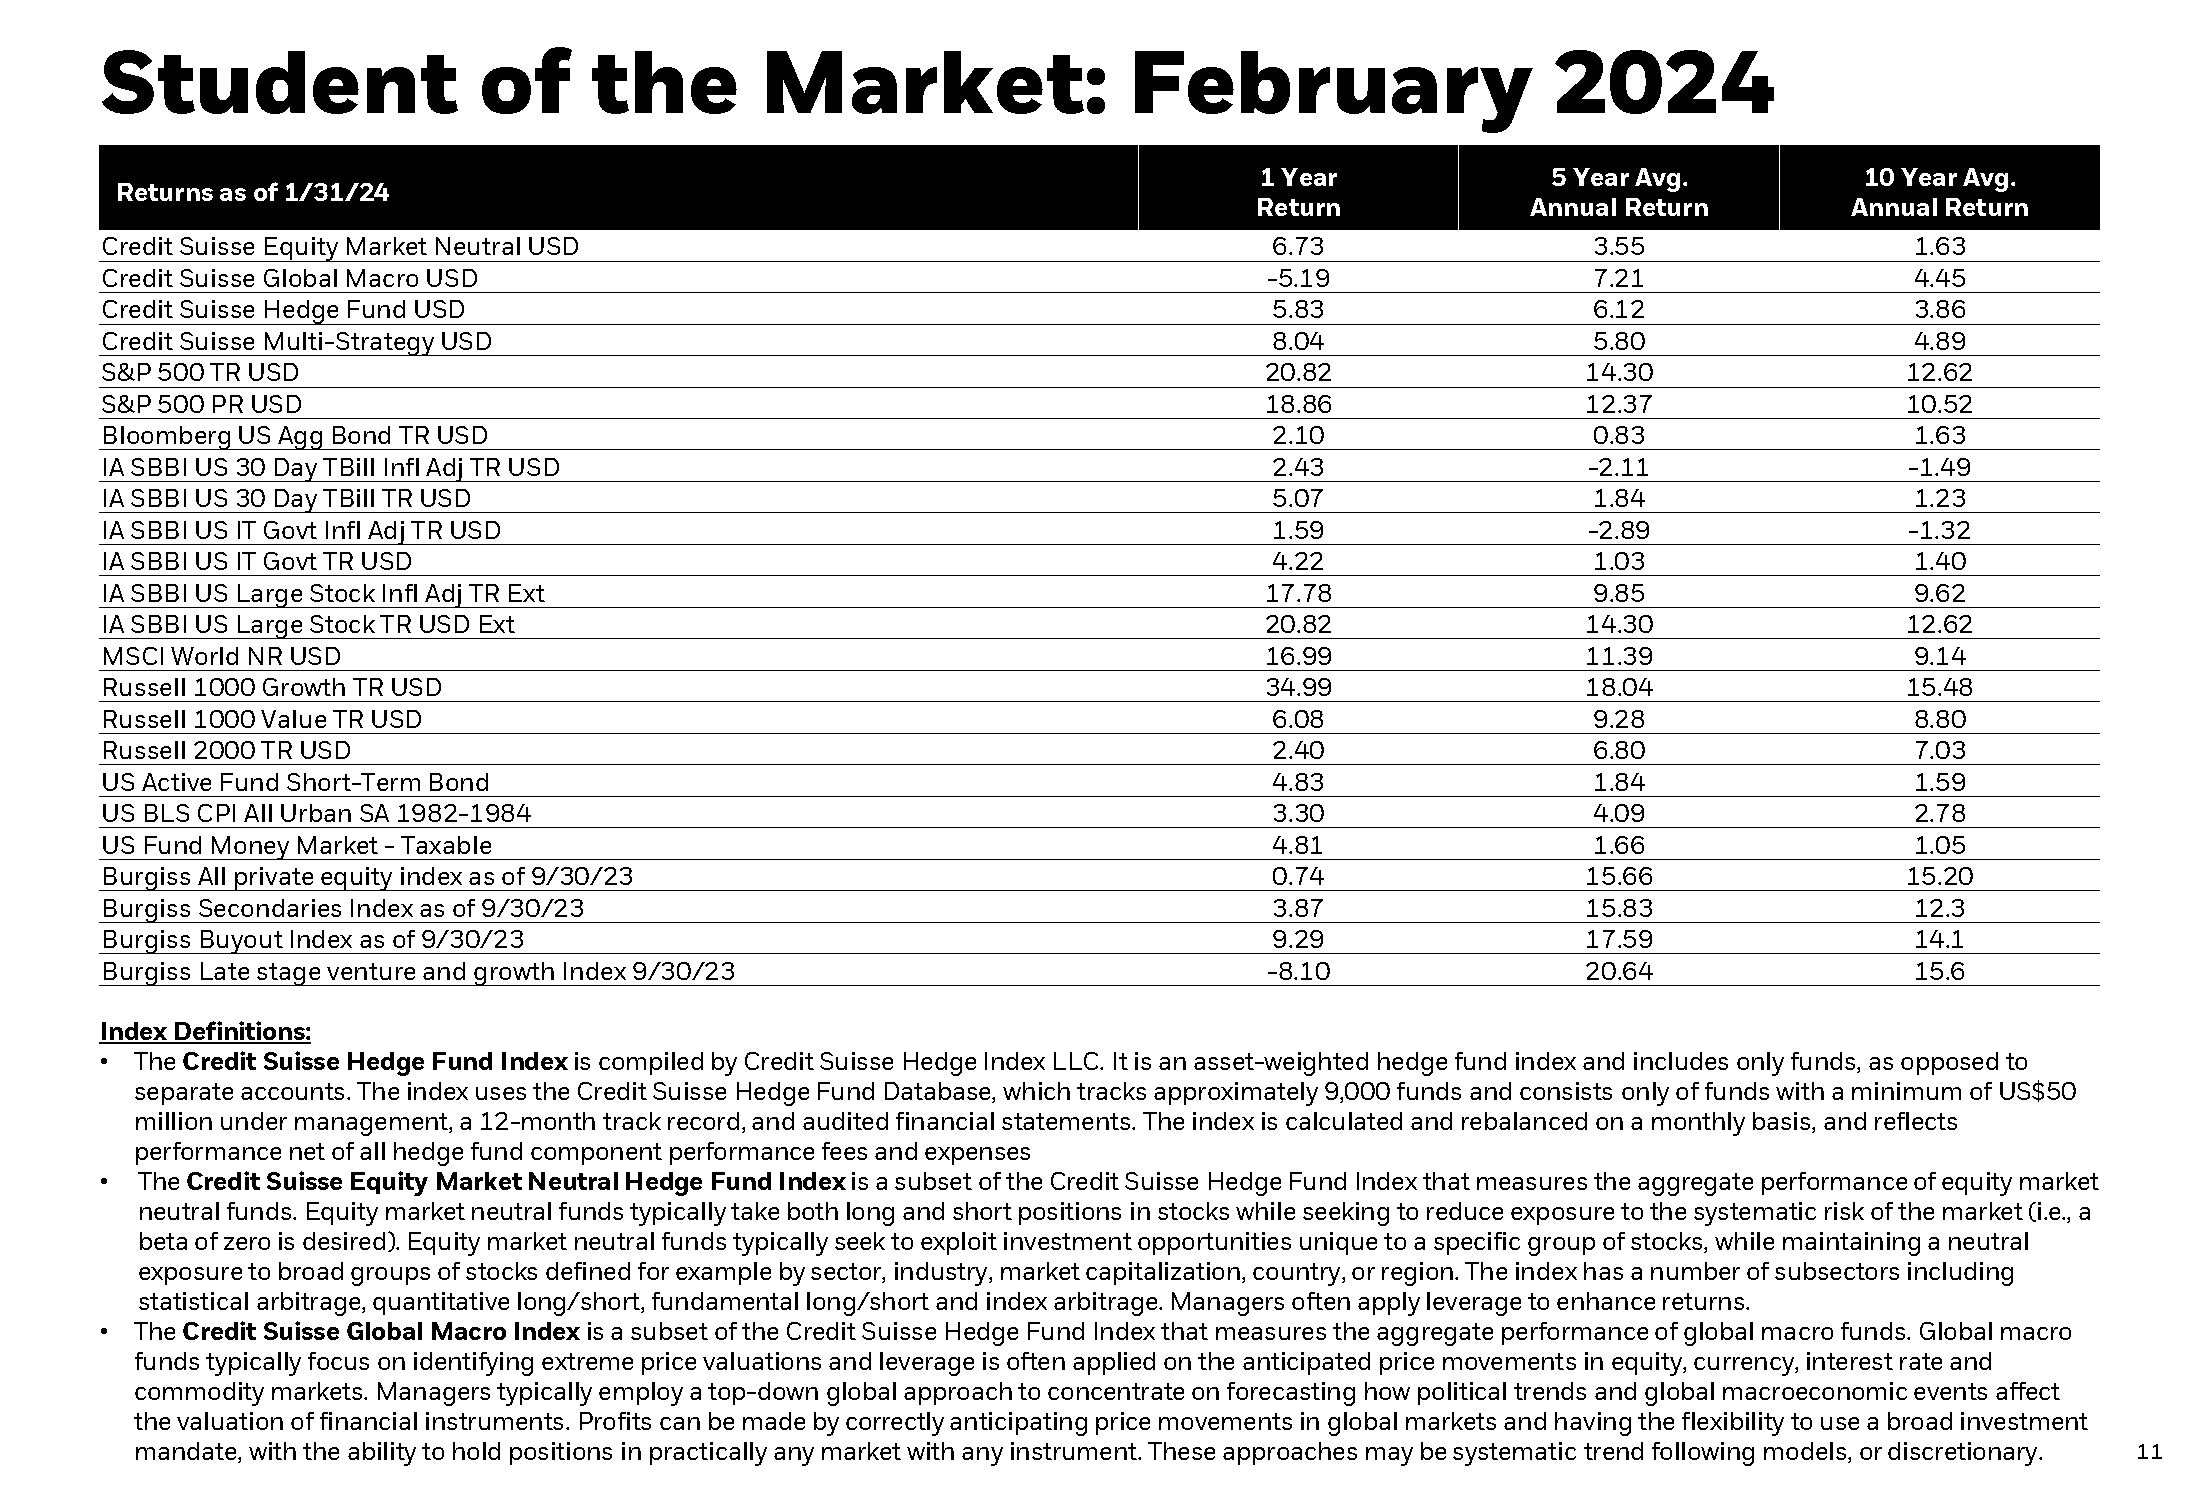
Can something be learned from studying the past? Historical data showing that stock market volatility during election years has been generally subdued unless there is a large recession, such as in ’32, ’08 and ’20. A brief look at the large swings between growth and value, stocks vs cash, data gives a glimpse of the average stock market return following January since 1926, and how the bear market was recently tamed.

February 27, 2024
Stock Volatility by Presidential Election Year
Important Disclosure: Content on our website and in our newsletters is for informational purposes only. The information provided may (or may not) directly apply to your situation. We recommend that readers work directly with a professional advisor when making decisions in the context of their specific situation.

Other content you may like

  • Podcast Highlight 1 - Market Recap

    Podcast Highlight 3 - Price to Sales Ratio and AI

    June 3, 2024
    The Strong Valley advisor team talks about how stocks make their way to becoming fully valued and a simplified look at the basic formula used to identify value, which is an important aspect of the current AI frenzy.
    Read this Article
  • Black and blue cover slide for a presentation

    July Student of the Market

    July 29, 2025
    This has been the best May and June for U.S. Stocks since 1950! Even so, international stocks are still leading this year. How does geopolitical turmoil impact the market? Take a look at that answer, as well as cash performance, bonds and the 60/40 portfolio performance.
    Read this Article
  • Is Value Poised for a Big Bounce?

    Is Value Poised for a Big Bounce?

    October 19, 2021
    This Student of the Market looks at what happened in September with stock market returns and an overview of 2021 for bond market returns. Growth versus Value is charted along with Long-Term Bond returns, and alternative fund flows. A helpful chart illustrates a broad category and specific category breakdown of what goes into Headline inflation.
    Read this Article
  • The 8th Best August Stock Performance since 1926

    September 7, 2020
    This special report looks at the historical market returns in the context of presidential elections, which parties are in control of Congress, and various government election outcomes. While nobody can predict the future, and past results don't guarantee future outcomes, this report gives some insights as to what the financial landscape might look like after the 2020 elections.
    Read this Article
  • The link you have selected is located on another server. The linked site contains information that has been created, published, maintained, or otherwise posted by institutions or organizations independent of this organization. We do not endorse, approve, certify, or control any linked websites, their sponsors, or any of their policies, activities, products, or services. We do not assume responsibility for the accuracy, completeness, or timeliness of the information contained therein. Visitors to any linked websites should not use or rely on the information contained therein until they have consulted with an independent financial professional. Please click “Continue to Link” to leave this website and proceed to the selected site.
    phone-handset