Article

Stock Market History for Your Future

April Student of the Market

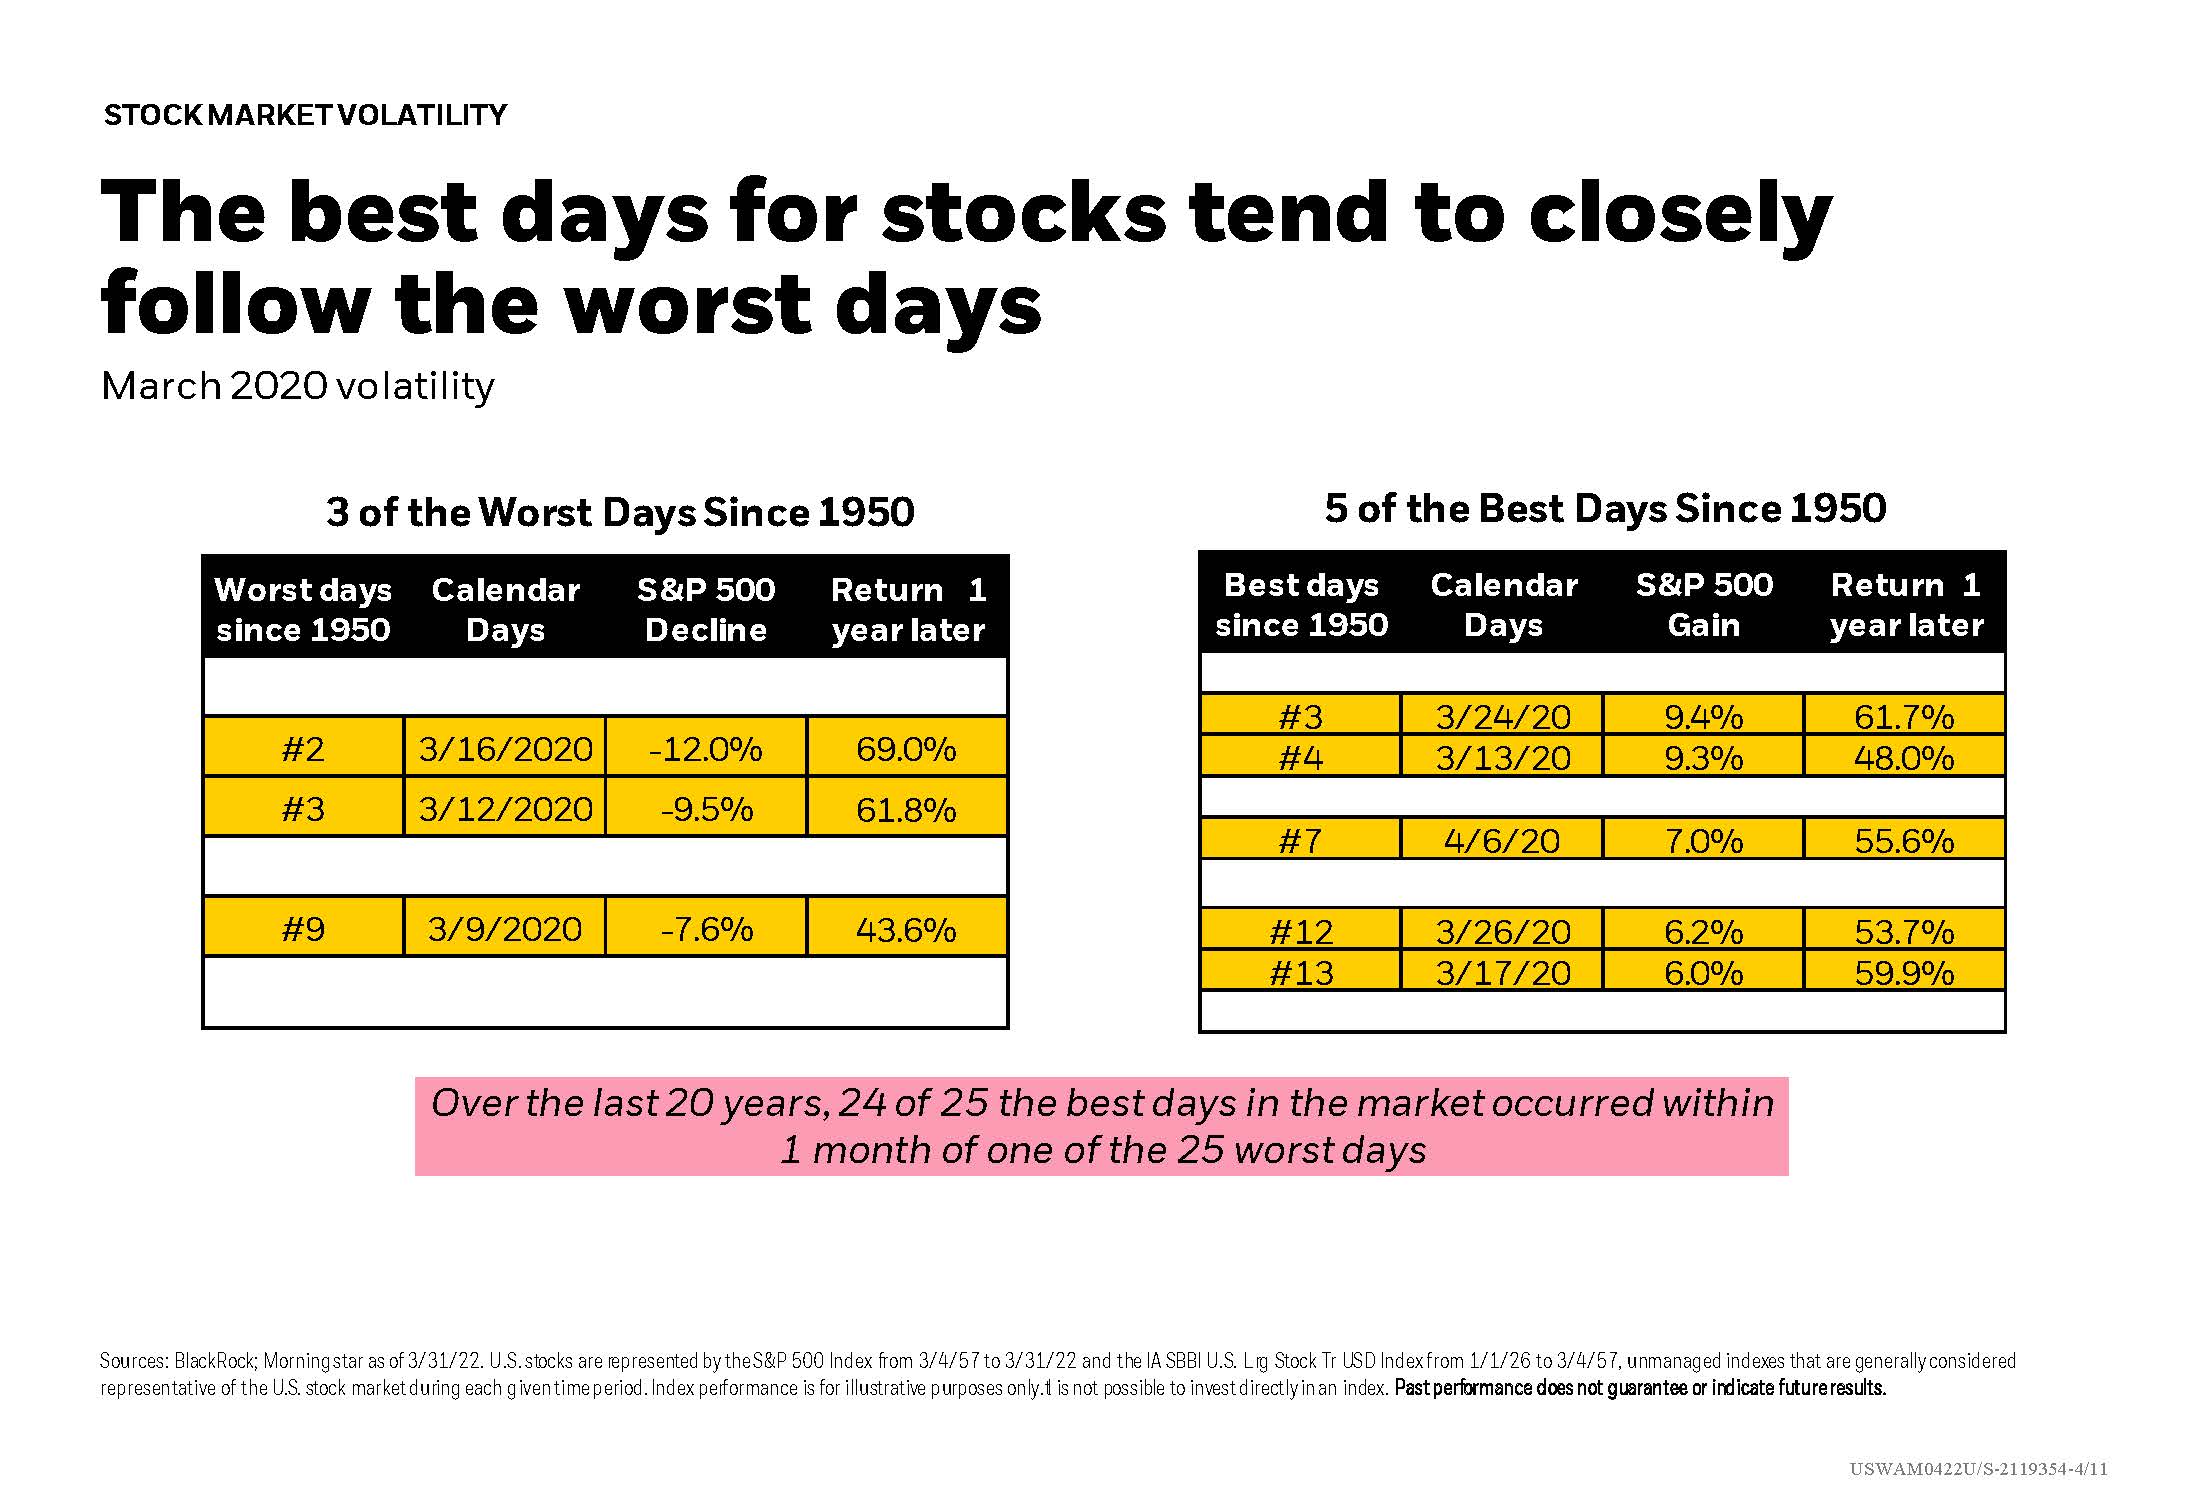
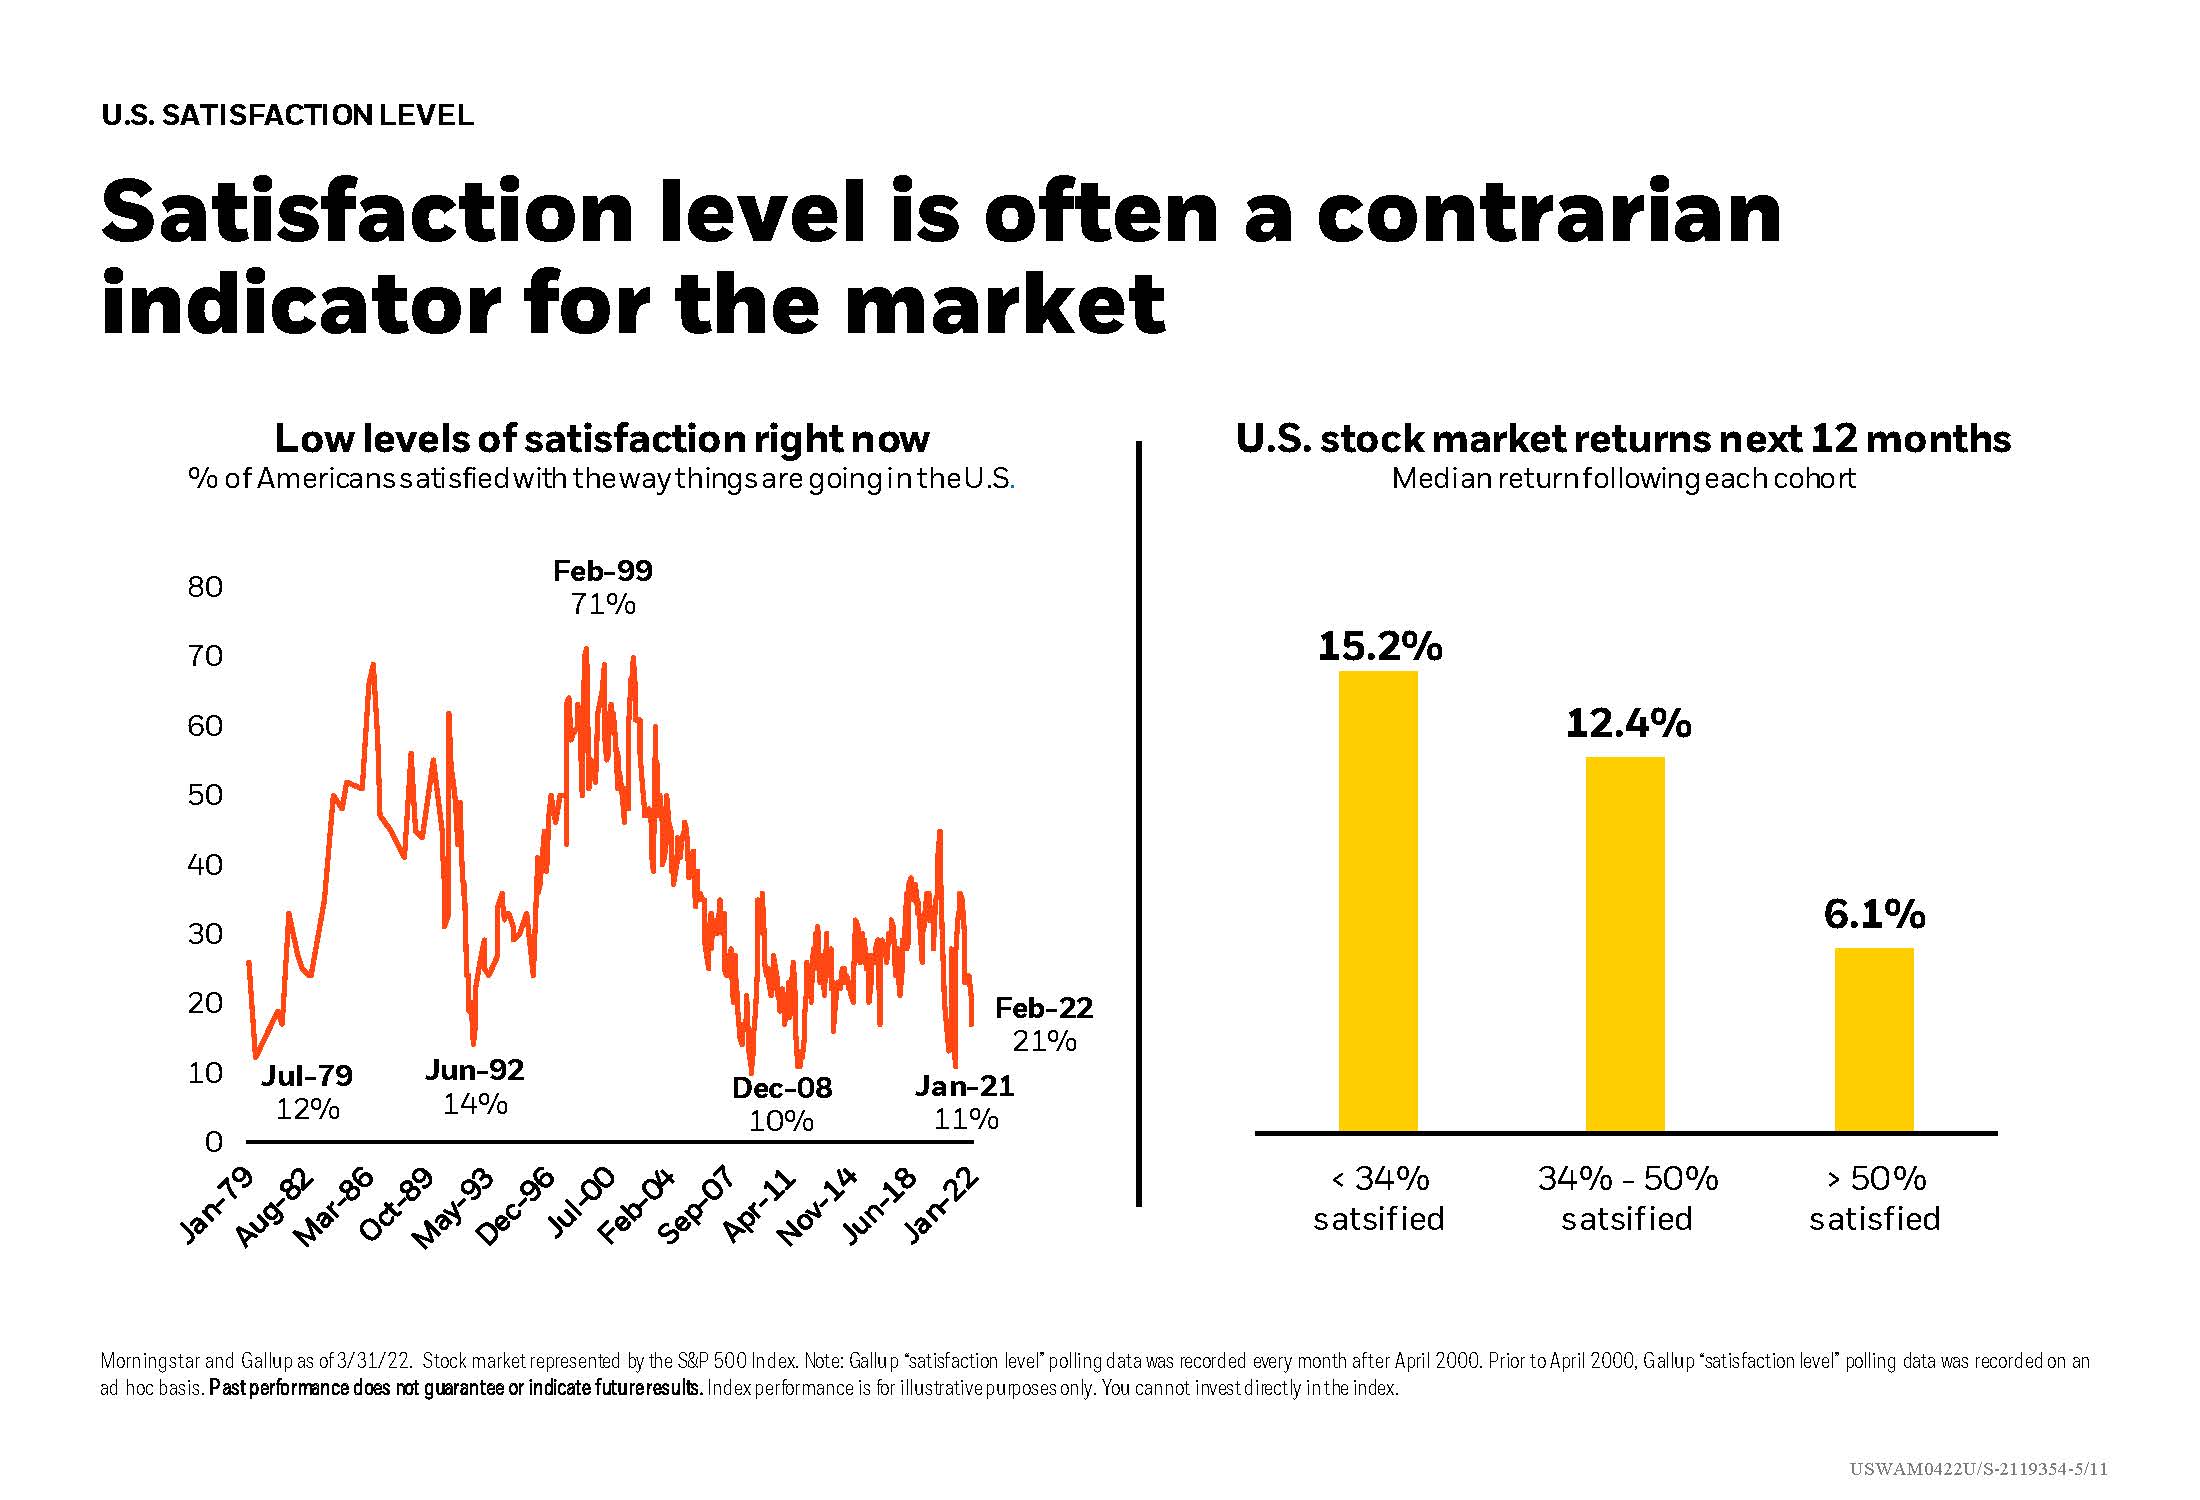
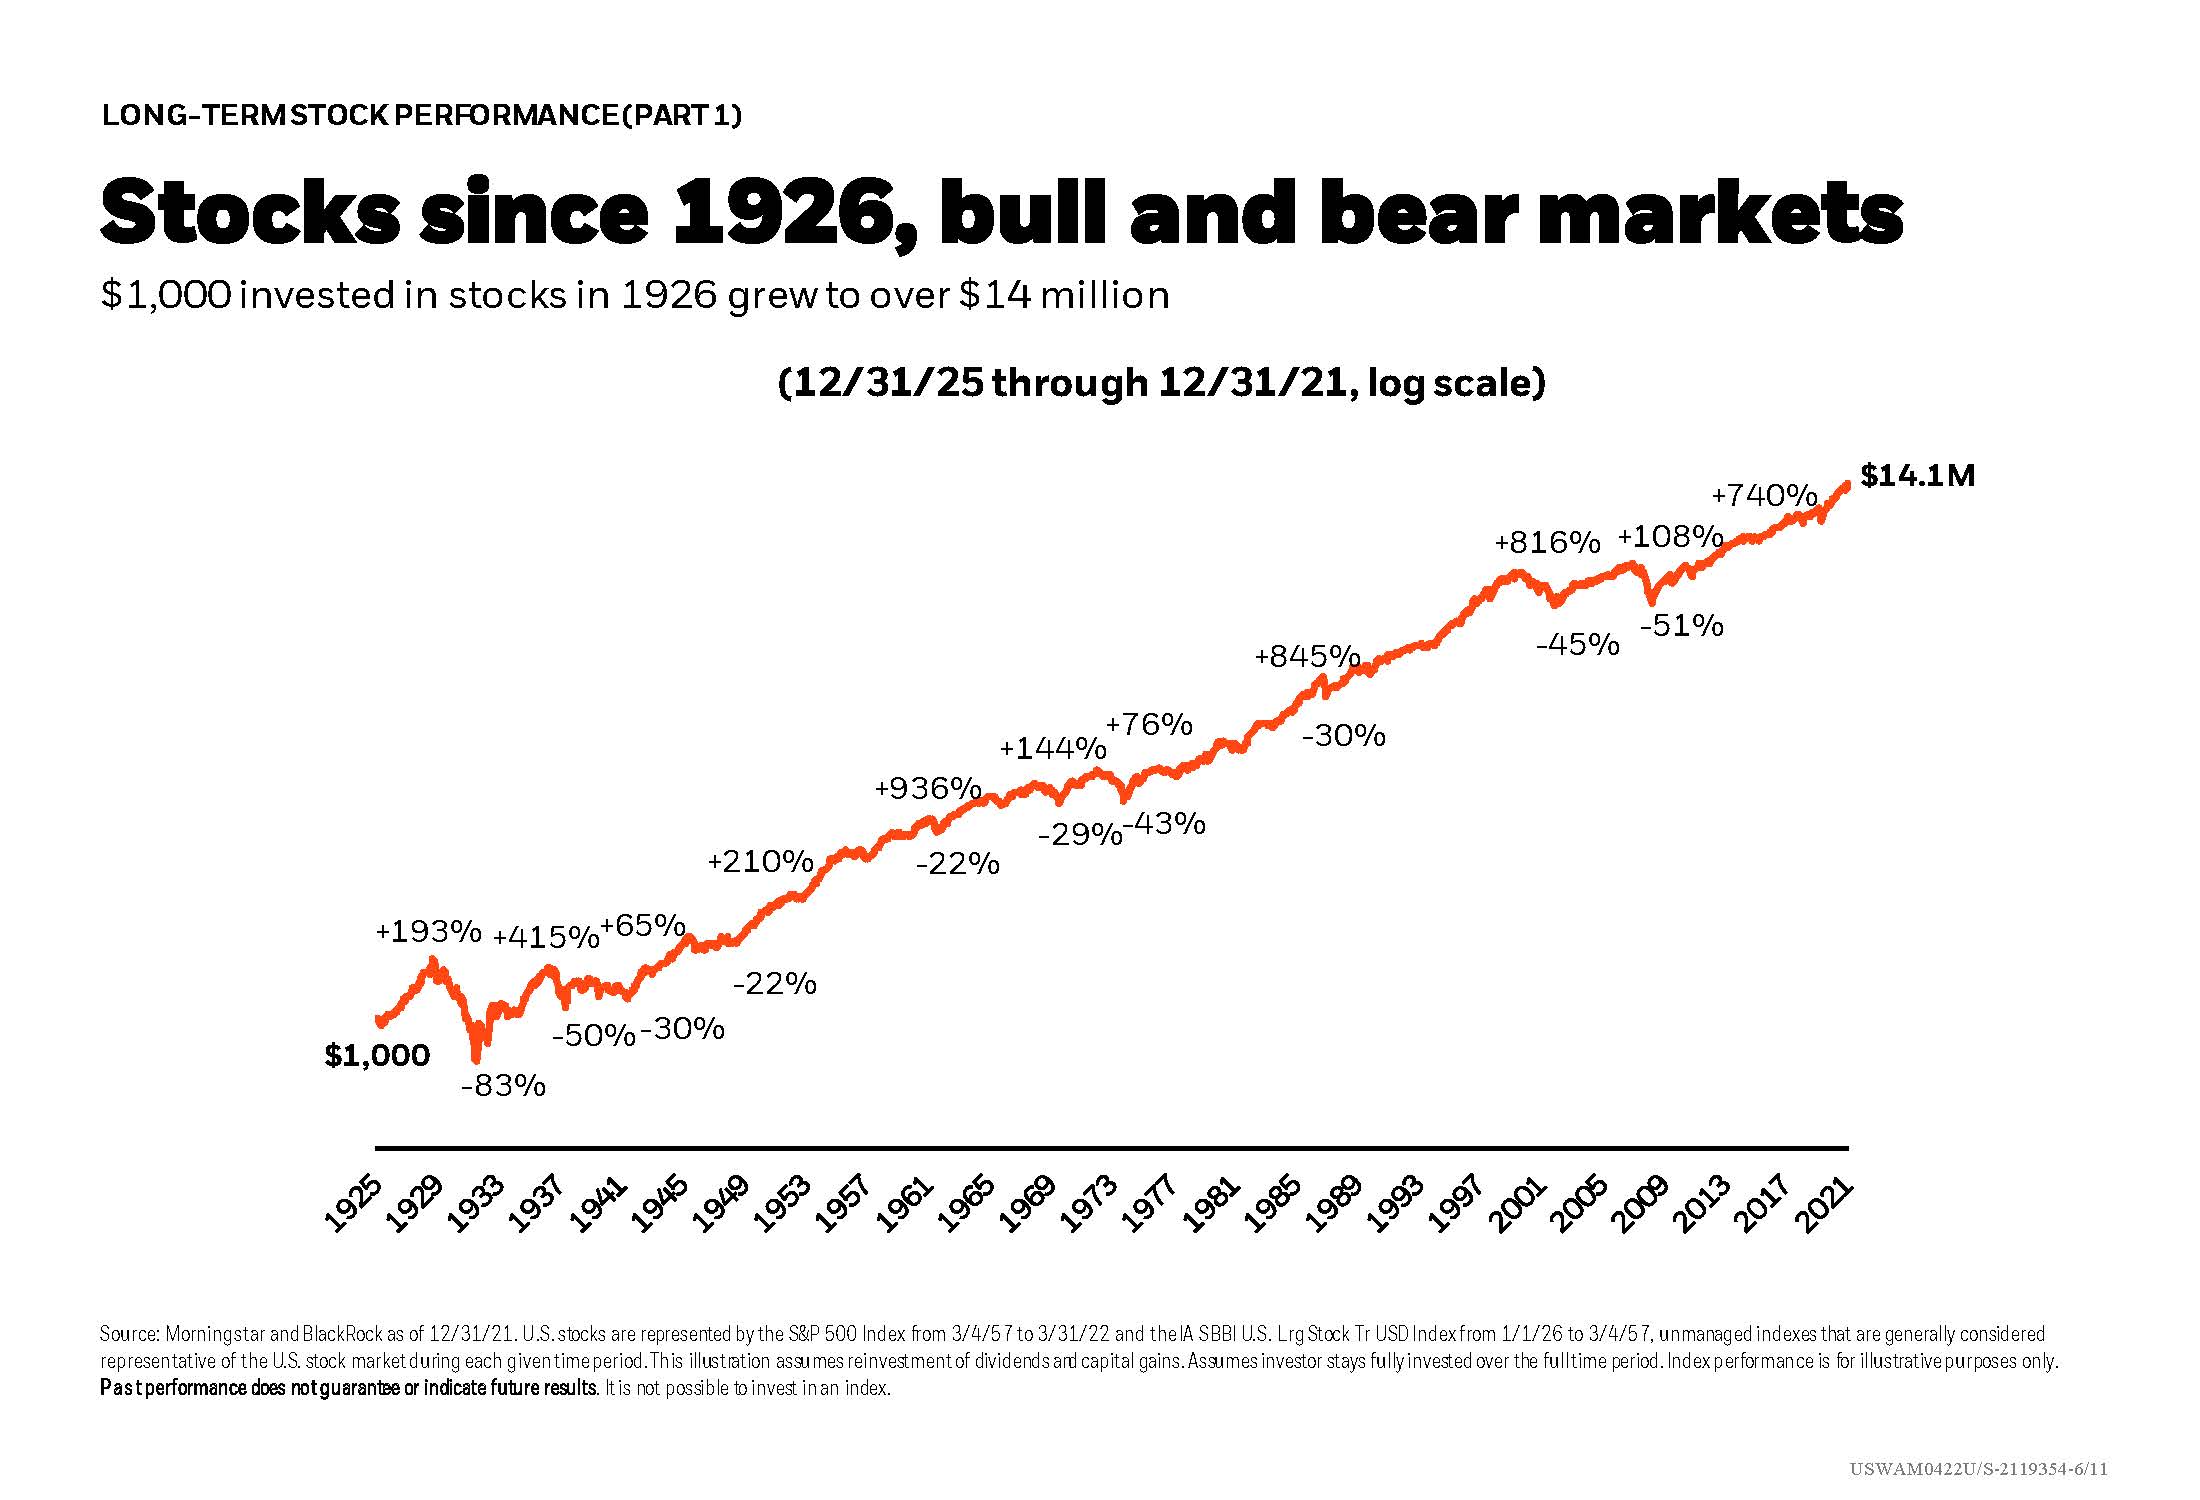
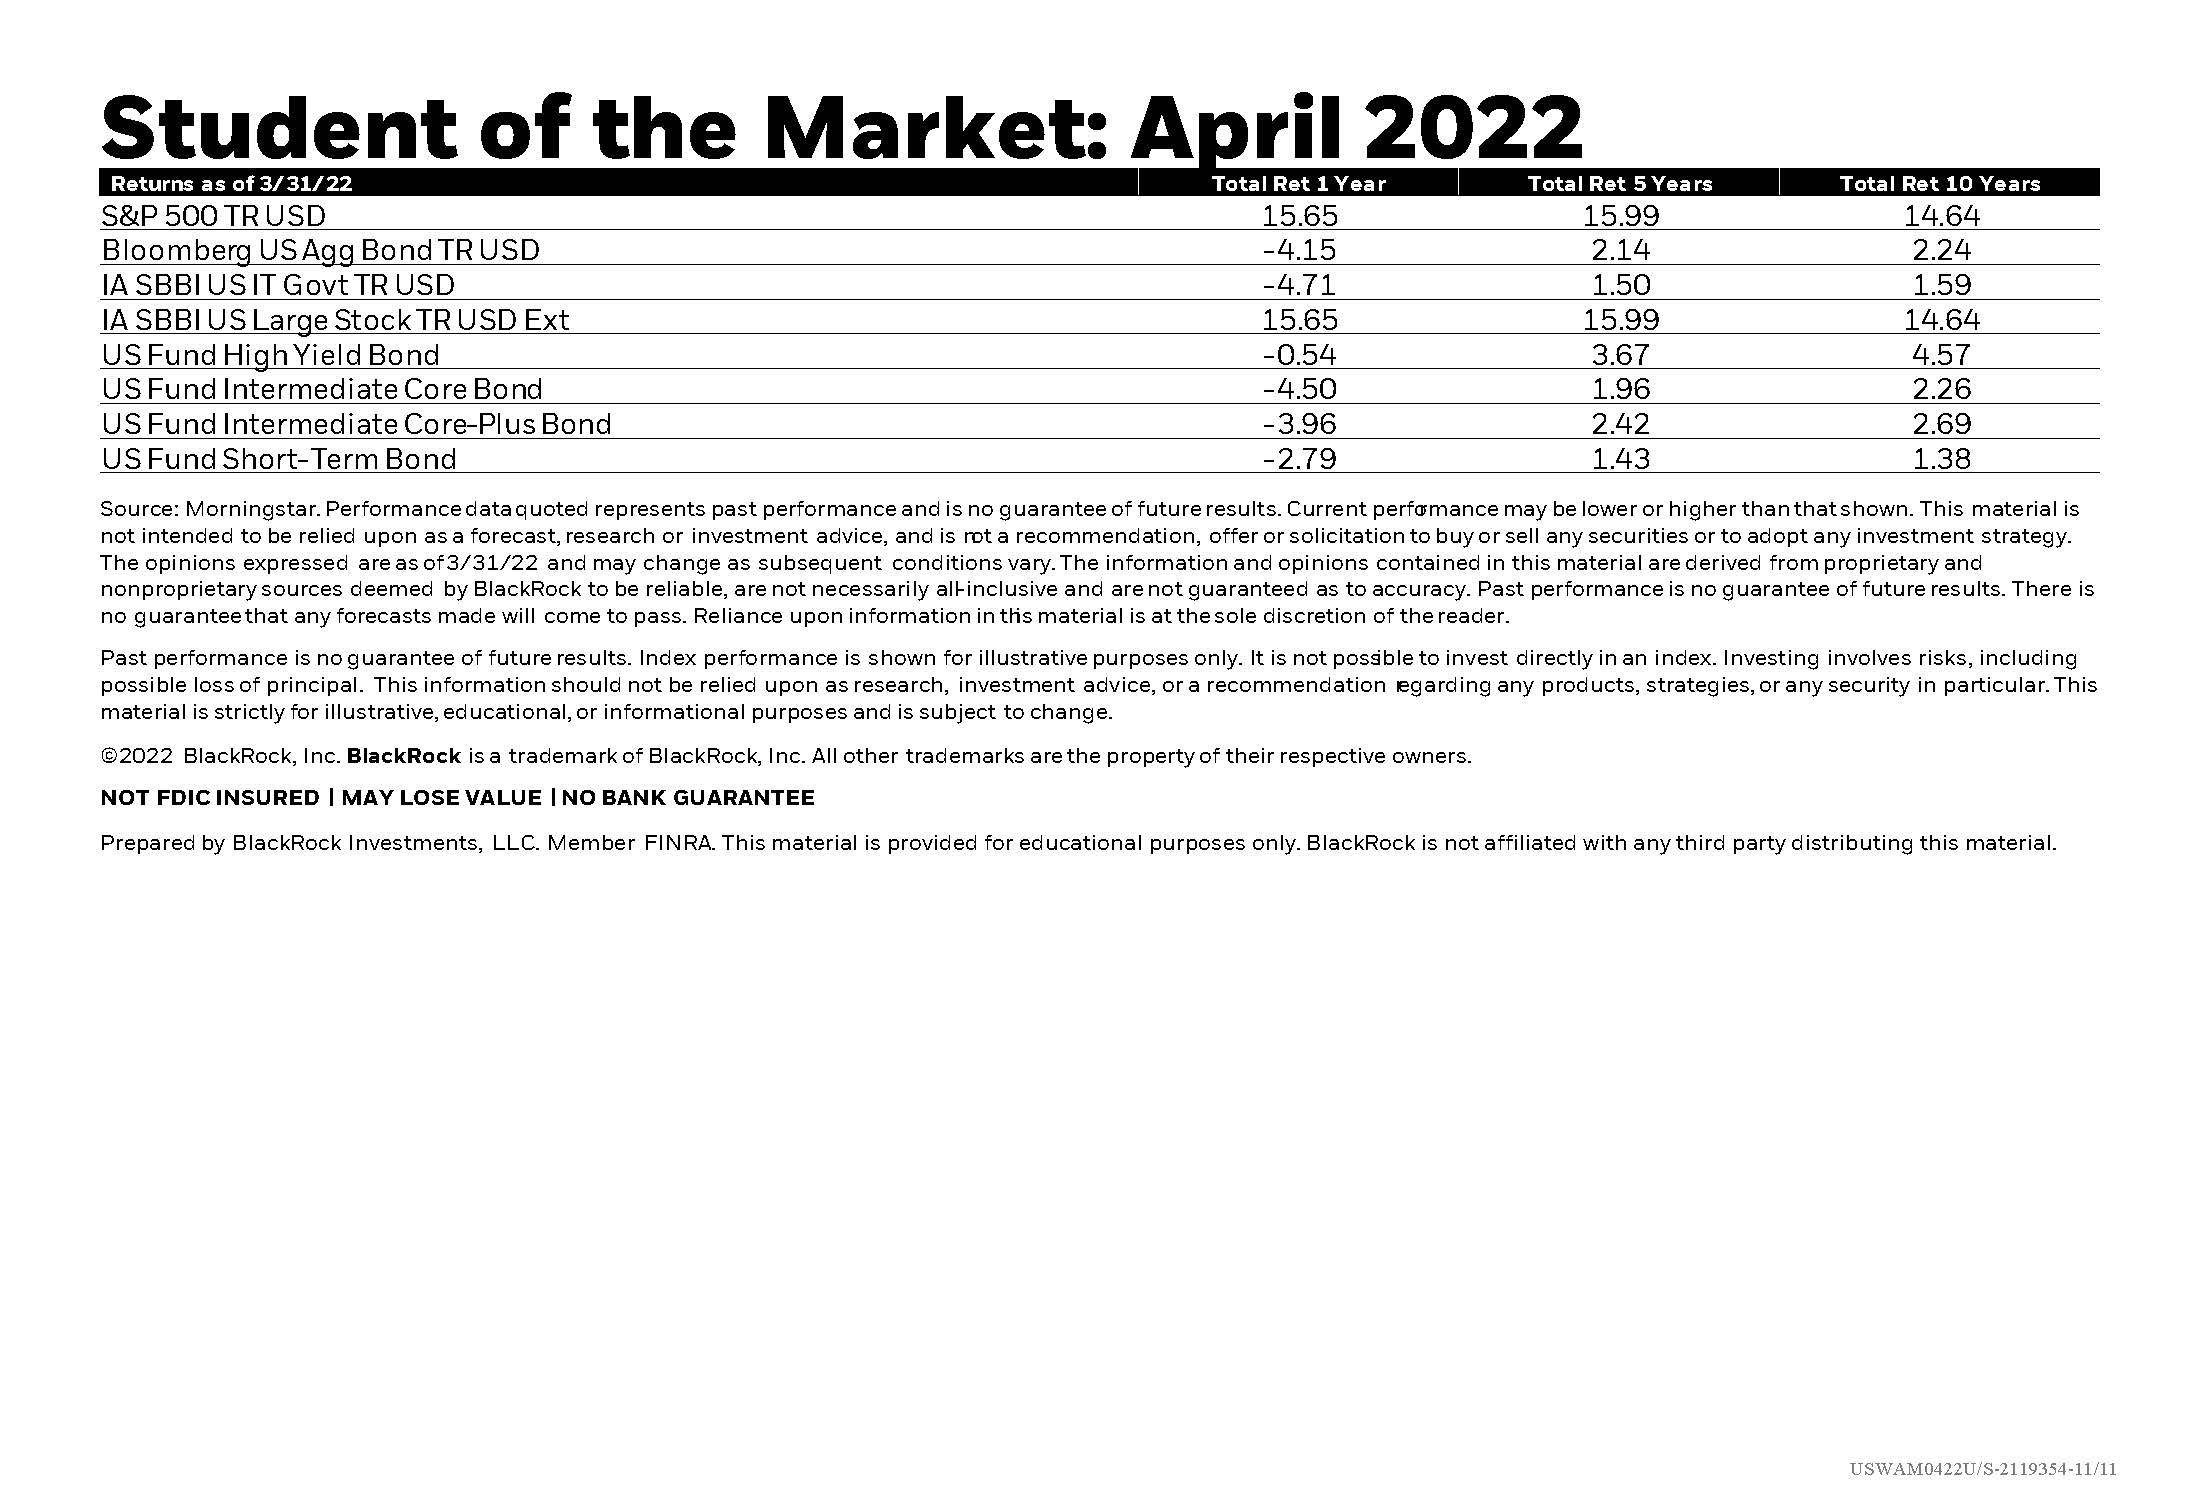
Do you feel your satisfaction level with the market is tracking with the norm? Maybe this brief history of long term stock performance might help change your mind. This month’s Student of the Market shows the numbers on how $1,000 invested in 1926 grew to over $14 million and how best days for stocks tend to closely follow the worst days.

April 27, 2022
April Student of the Market
Important Disclosure: Content on our website and in our newsletters is for informational purposes only. The information provided may (or may not) directly apply to your situation. We recommend that readers work directly with a professional advisor when making decisions in the context of their specific situation.

Other content you may like

  • NOV Student of the Market

    Historic Stock and Bond Streaks

    November 29, 2023
    Is there potentially peak pessimism for bonds? Check out past stats for losing streaks for stocks and bonds, as well as long-term bond returns and starting interest rates. Take a look to see how not all stocks within the S&P500 are the same and find the historic sweet spots for stock and bond returns during a Fed pause.
    Read this Article
  • Time to Revisit Your New Year’s Resolutions

    Time to Revisit Your New Year's Resolutions

    February 16, 2024
    If your New Year’s resolutions contained a desire to get your overall finances in order, you might consider that budgeting should always be the centerpiece of your financial resolutions. Here are some ideas that can help you come up with a plan to succeed with your goals.
    Read this Article
  • Market Performance and a Recession Indicator

    Market Performance and a Recession Indicator

    December 1, 2022
    U.S. stocks historically average 10% per year but rarely do they finish a year at that level. See the difference between the average annual return and what happened to stocks YTD in 2022 by looking at the range of returns for stocks by the full calendar year. A quick glance at the most reliable recession indicator and how alternative asset classes do better when the return on “cash” is higher. Plus stats on market performance.
    Read this Article
  • The Positive Start Continues for U.S. Stocks

    The Positive Start Continues for U.S. Stocks

    July 20, 2023
    With a look at the first 6 months of 2023, this overview examines past “positive starts” in the U.S. Stock Market, gives data for the easing of stock volatility, and how the Feds raising rates may affect performance. Included is a deeper look at bonds and retirement income planning, such as U.S. inflation versus cash, bonds and stocks and the importance of withdrawal planning.
    Read this Article
  • The link you have selected is located on another server. The linked site contains information that has been created, published, maintained, or otherwise posted by institutions or organizations independent of this organization. We do not endorse, approve, certify, or control any linked websites, their sponsors, or any of their policies, activities, products, or services. We do not assume responsibility for the accuracy, completeness, or timeliness of the information contained therein. Visitors to any linked websites should not use or rely on the information contained therein until they have consulted with an independent financial professional. Please click “Continue to Link” to leave this website and proceed to the selected site.
    phone-handset