Article

The 8th Best August Stock Performance since 1926

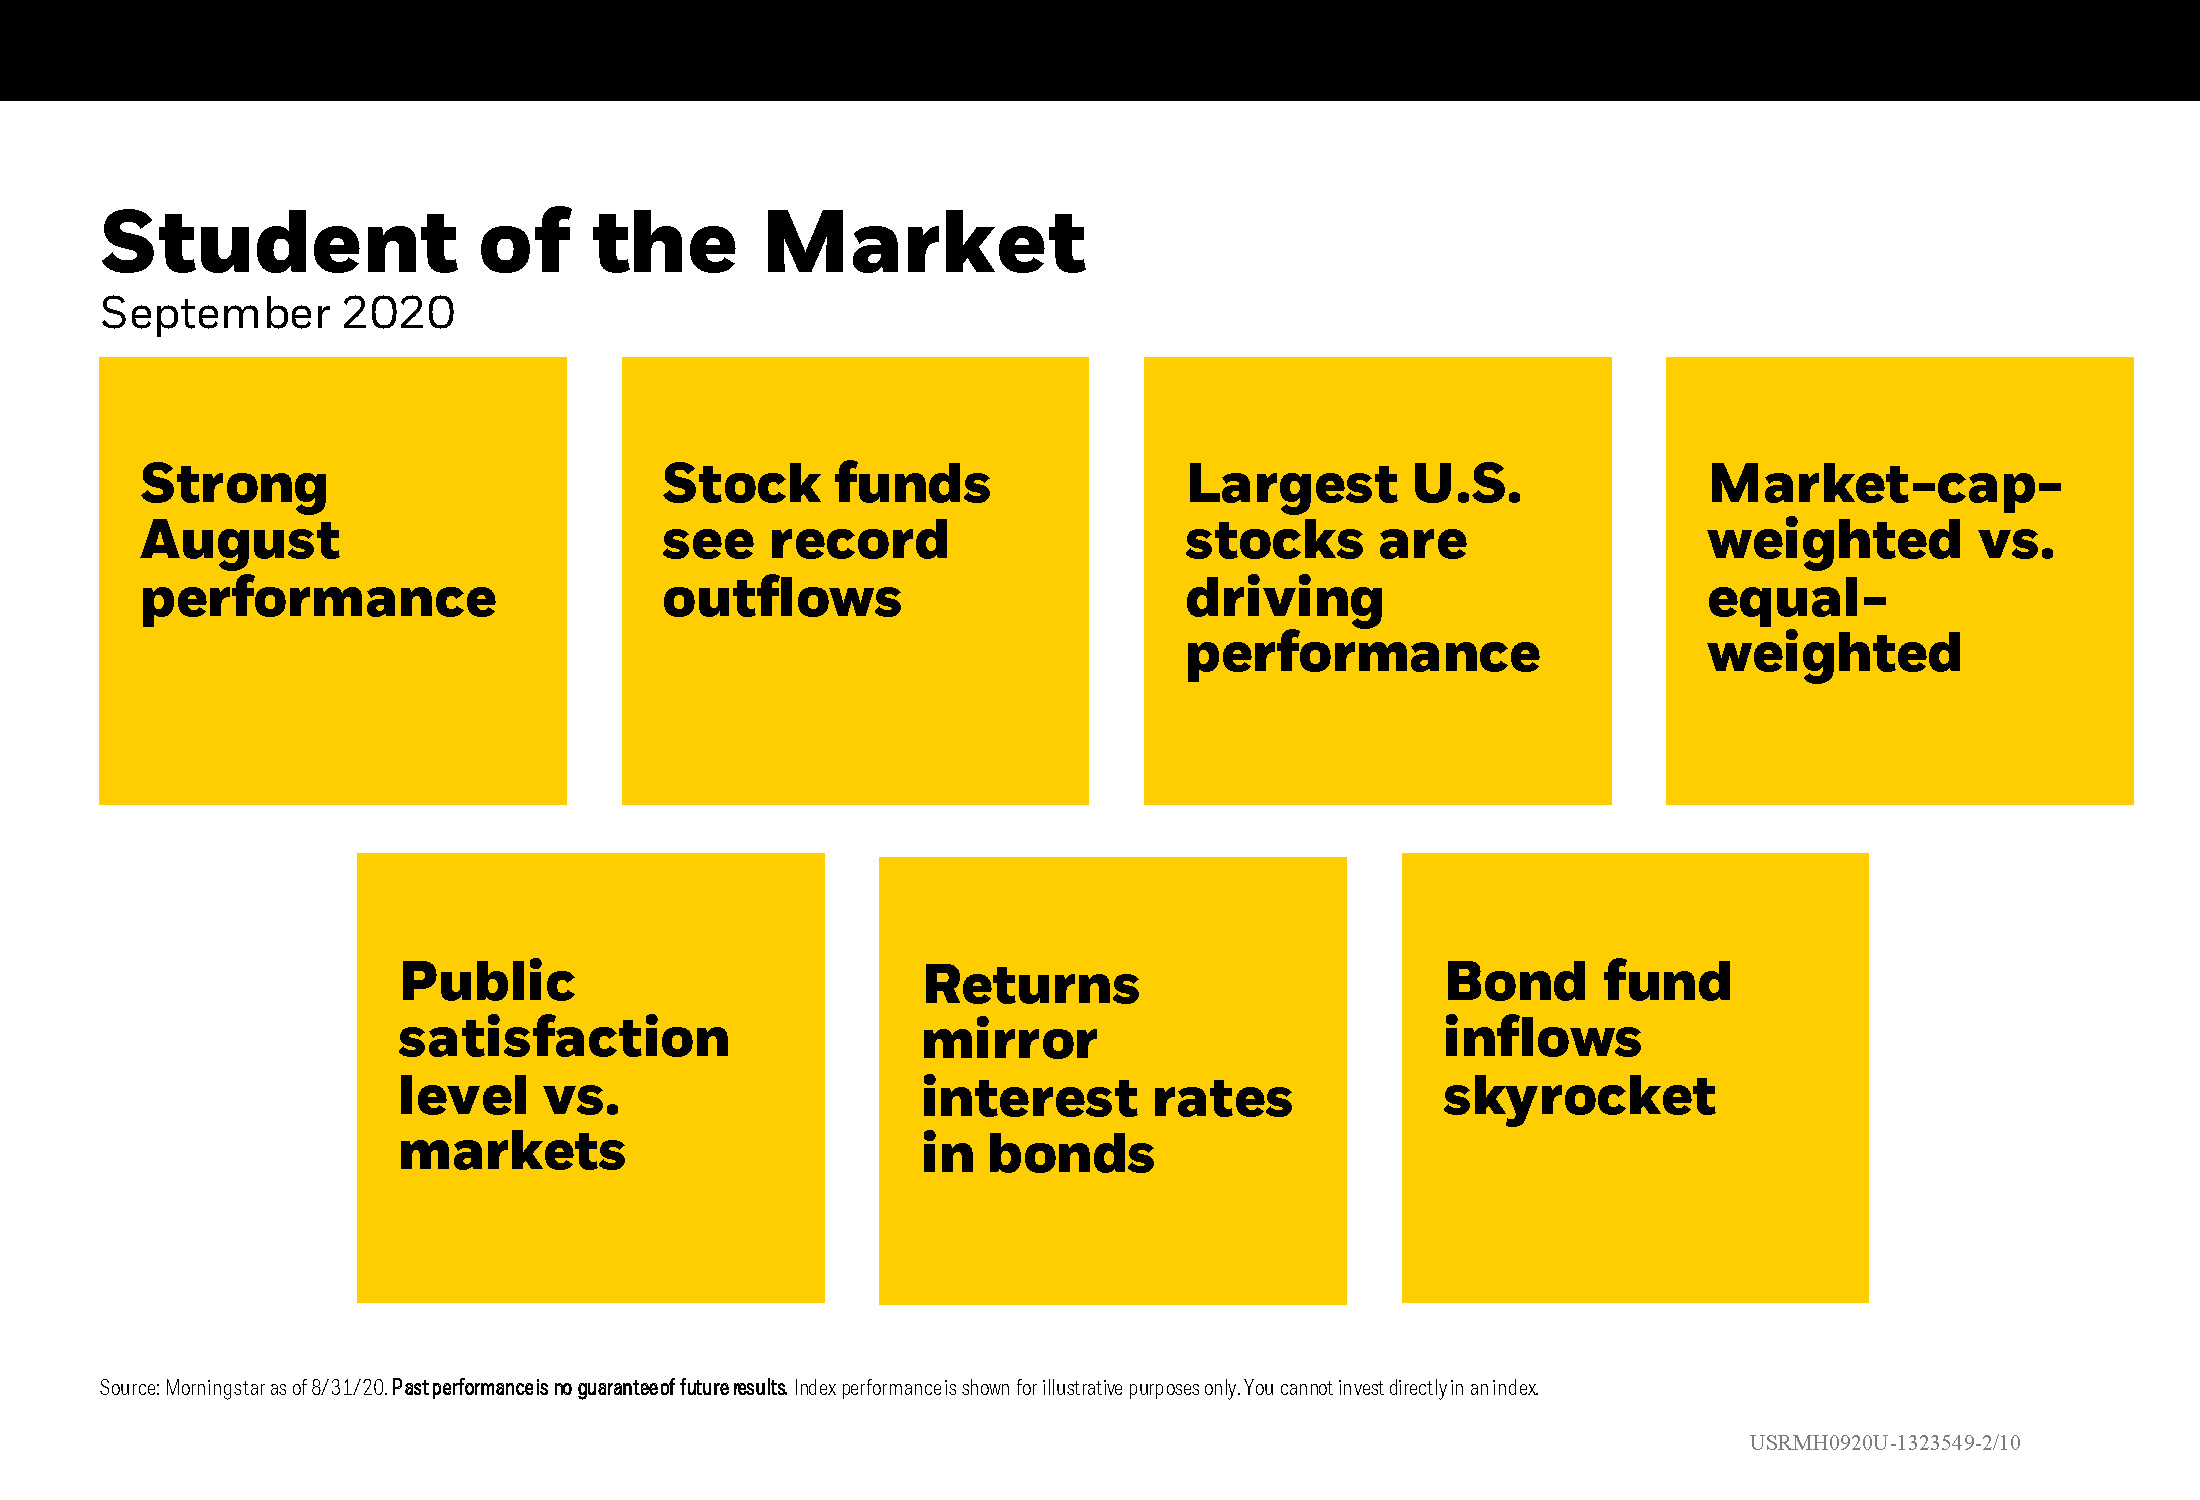
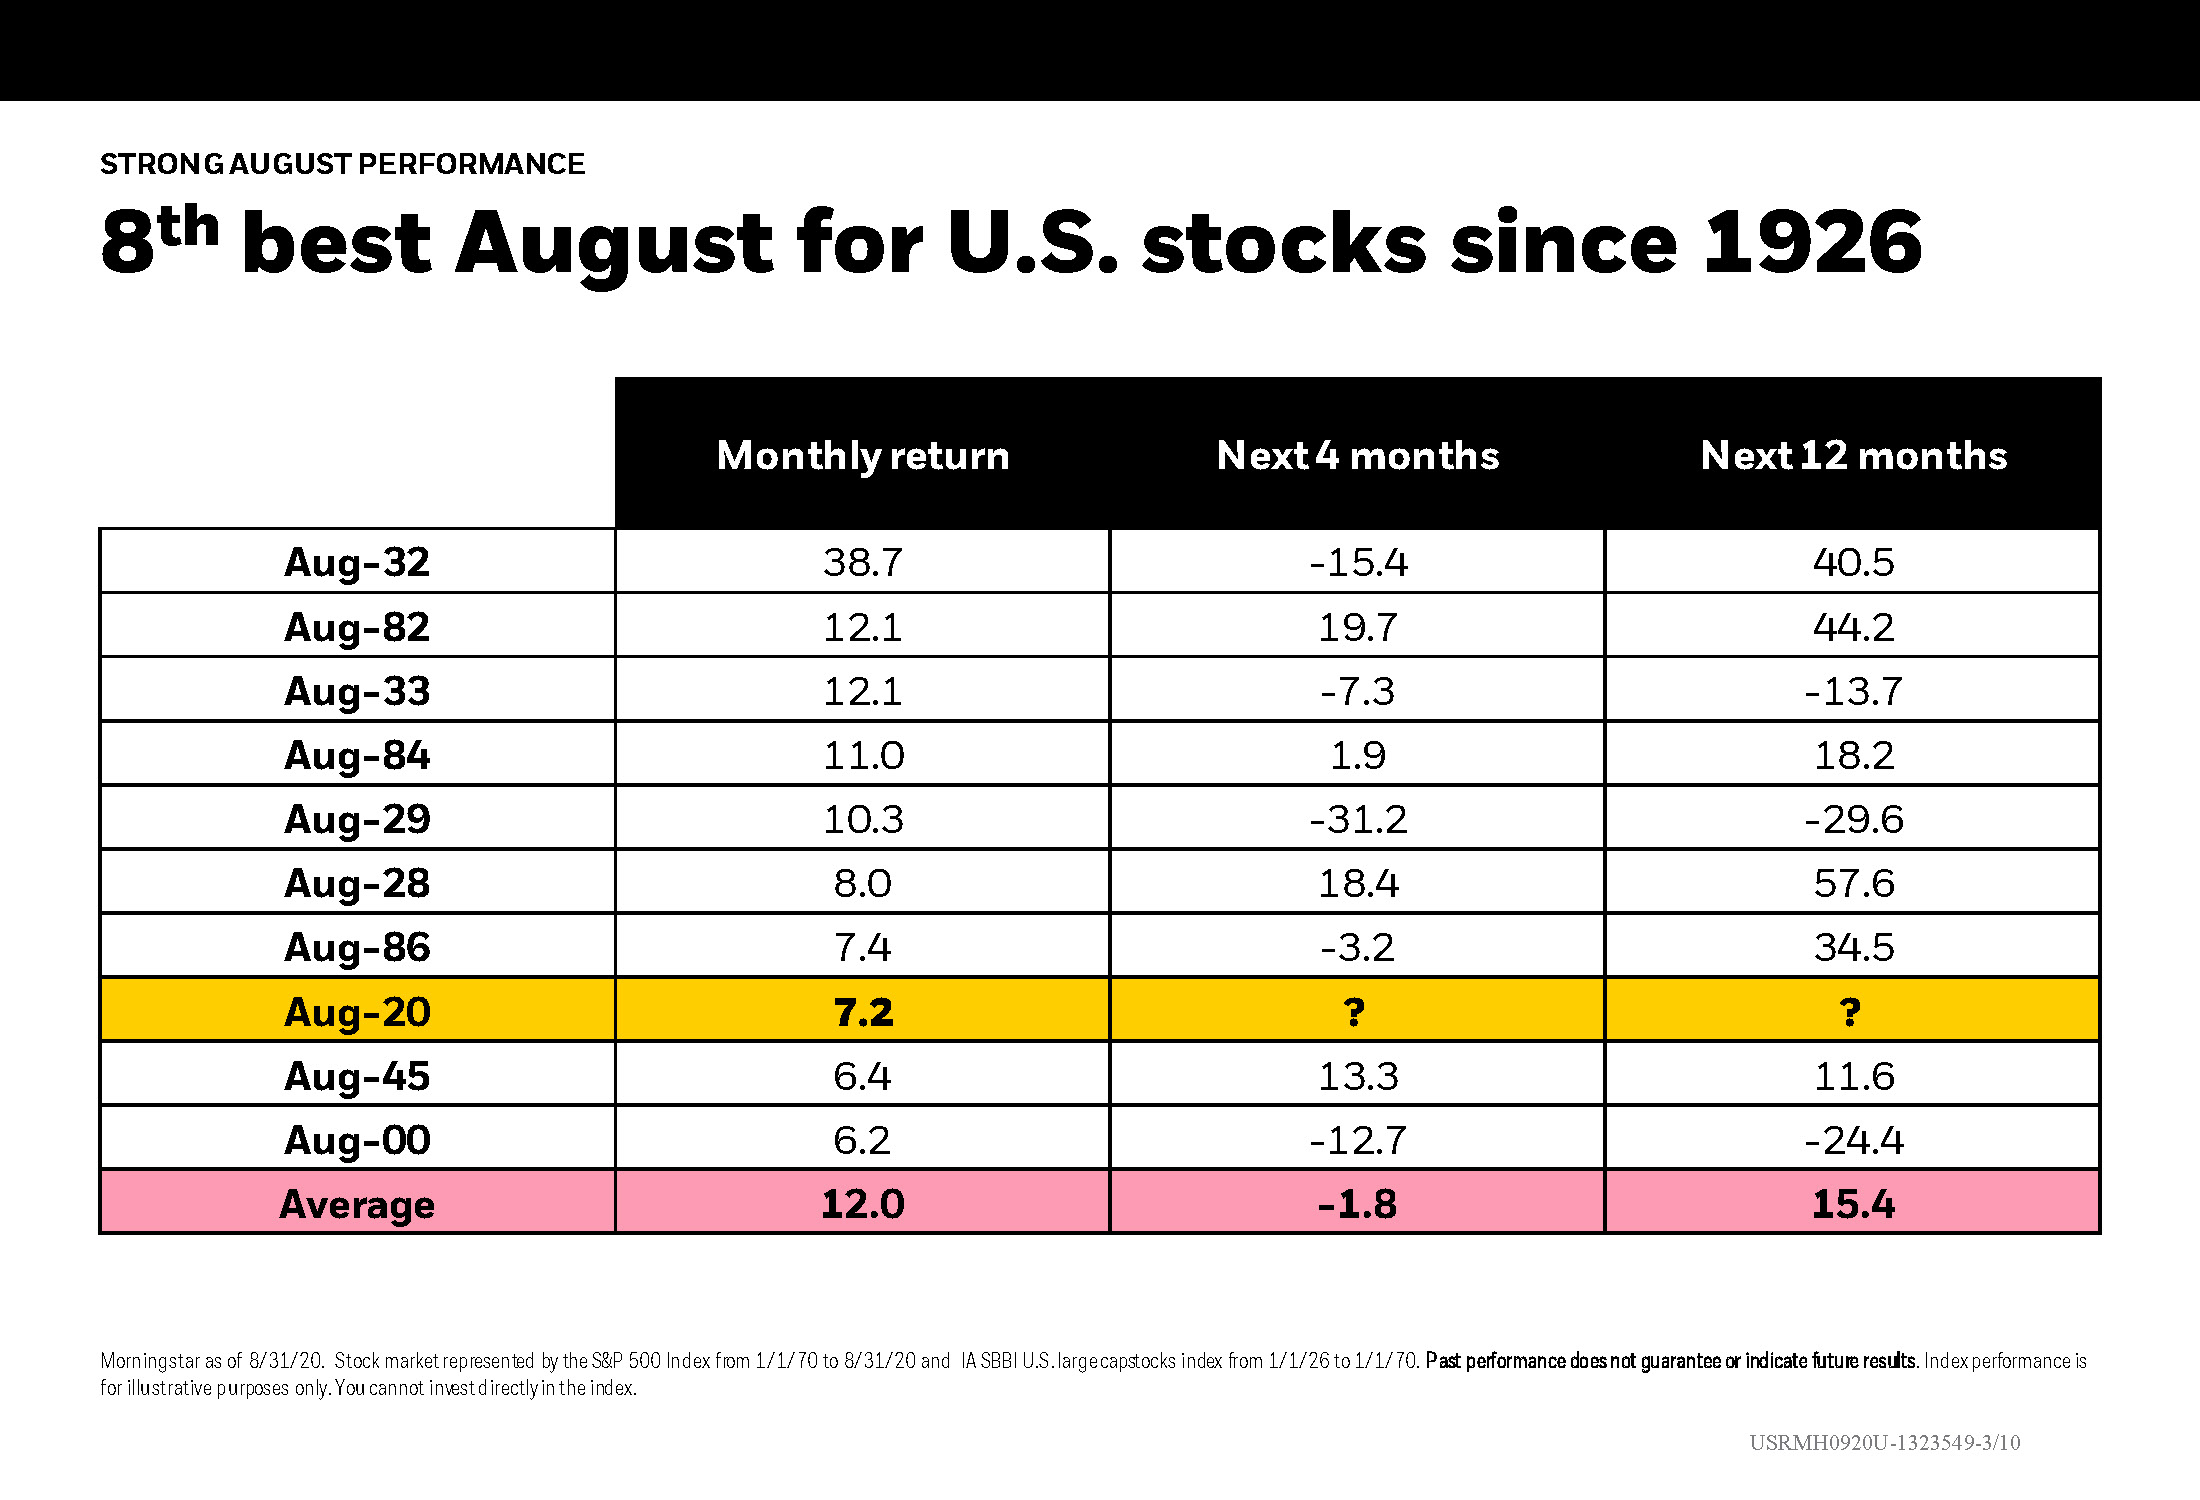
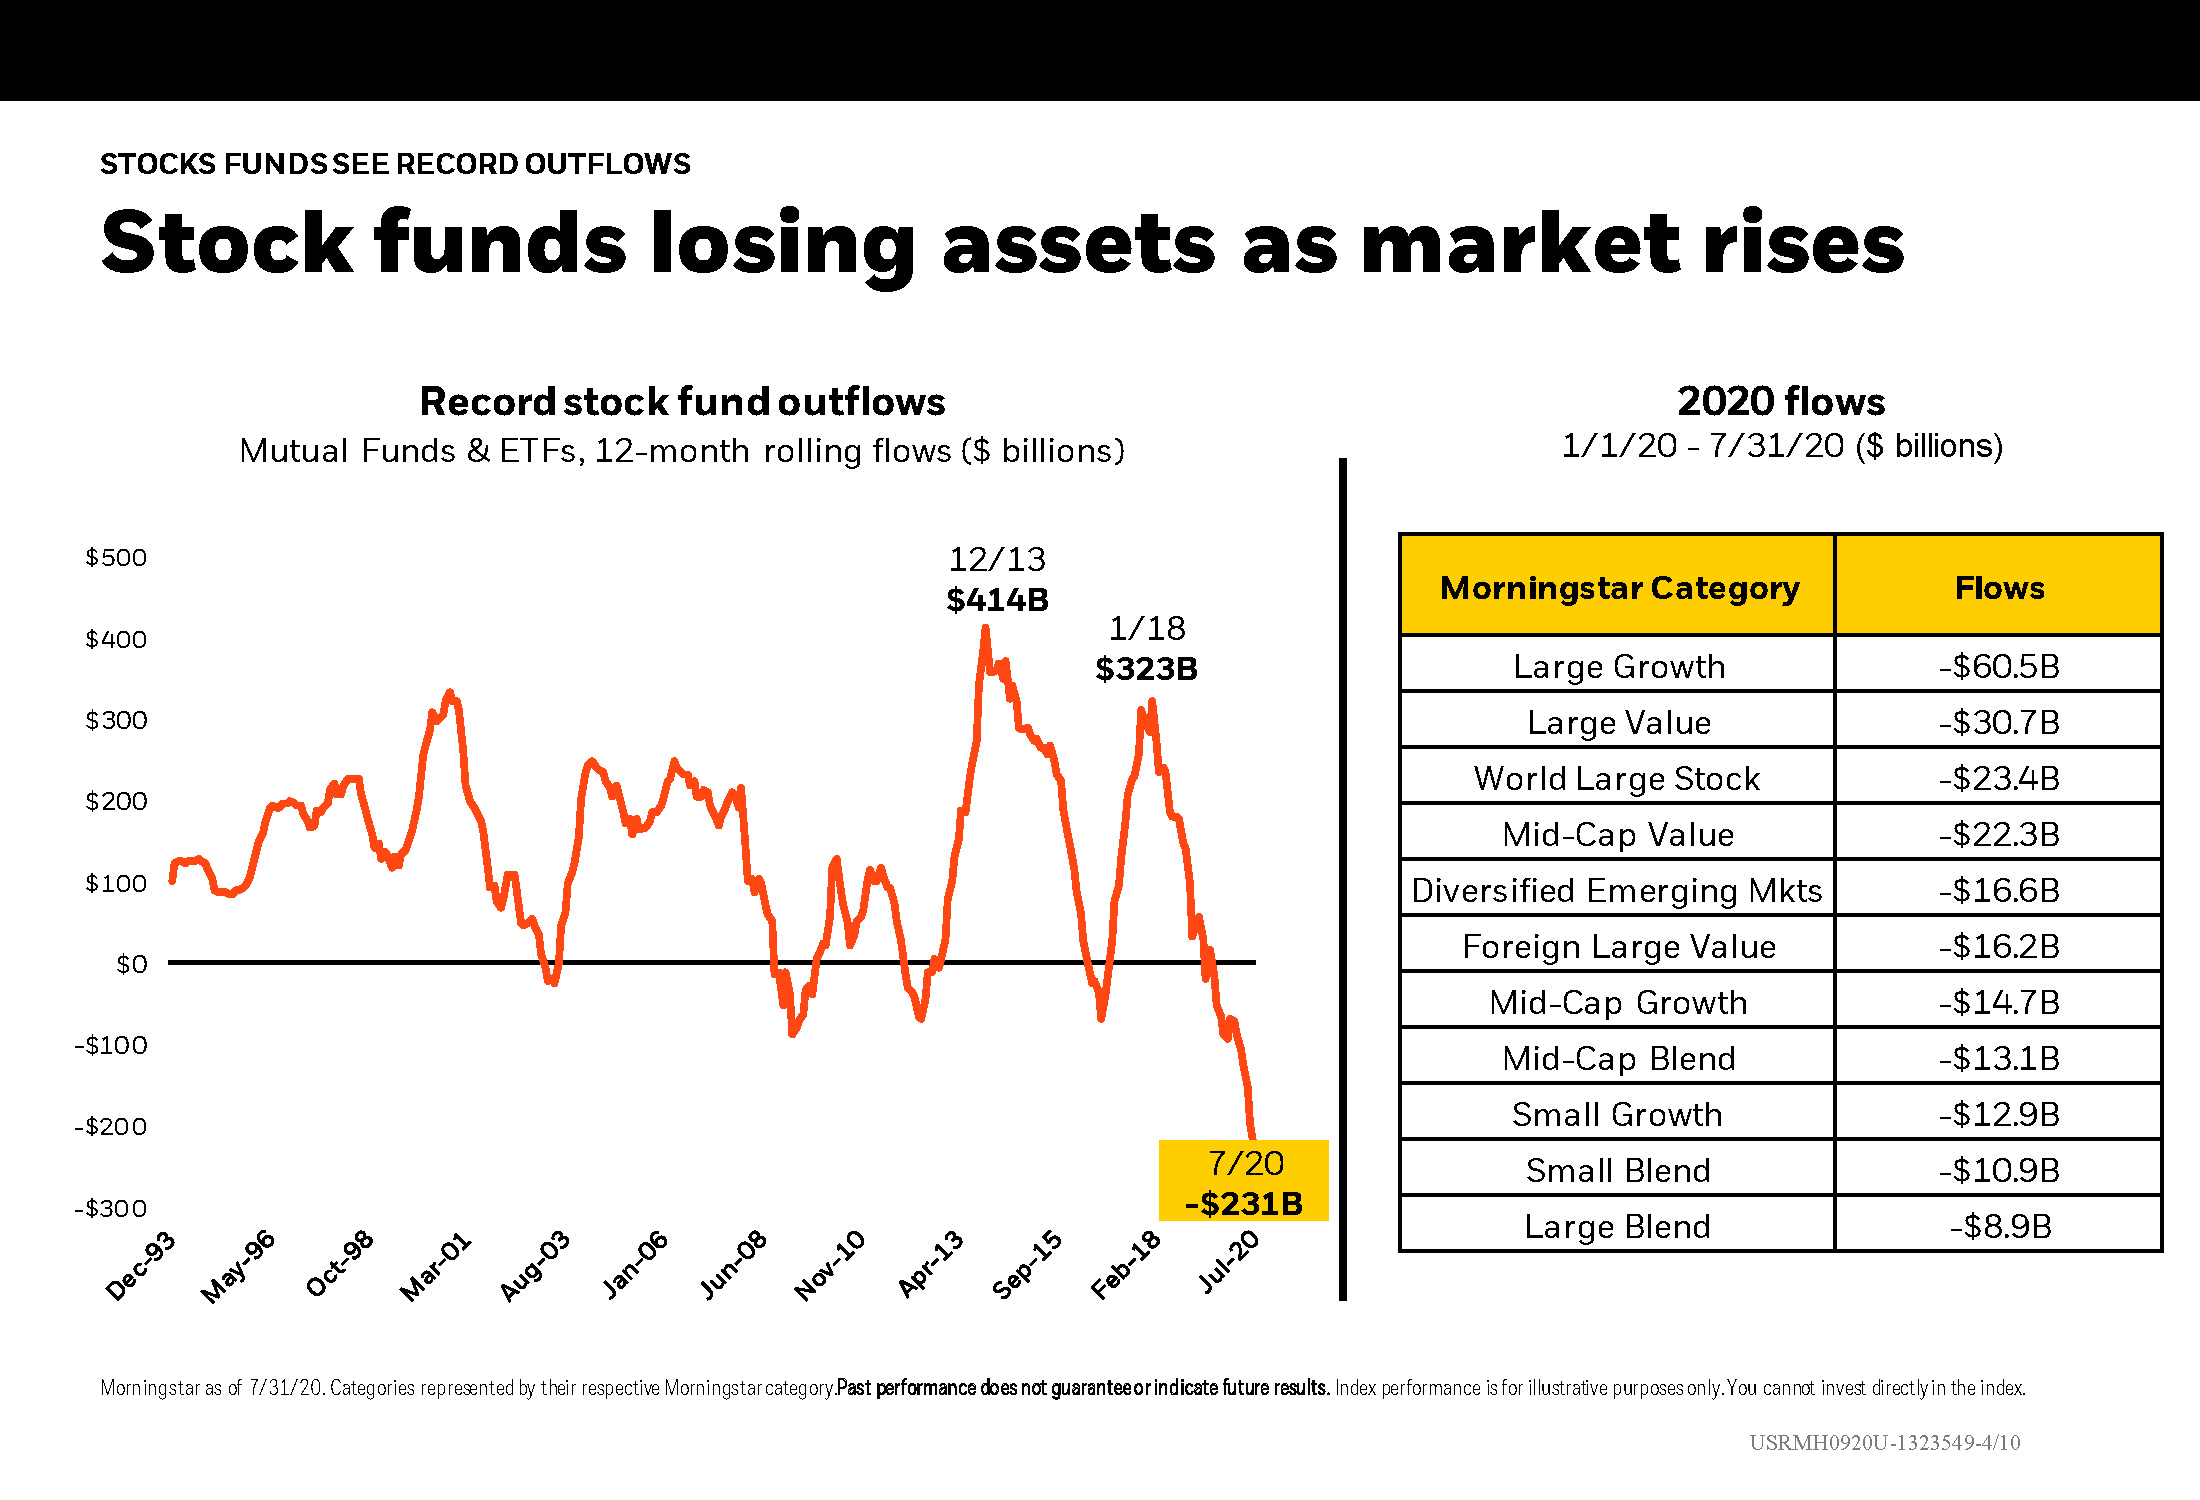
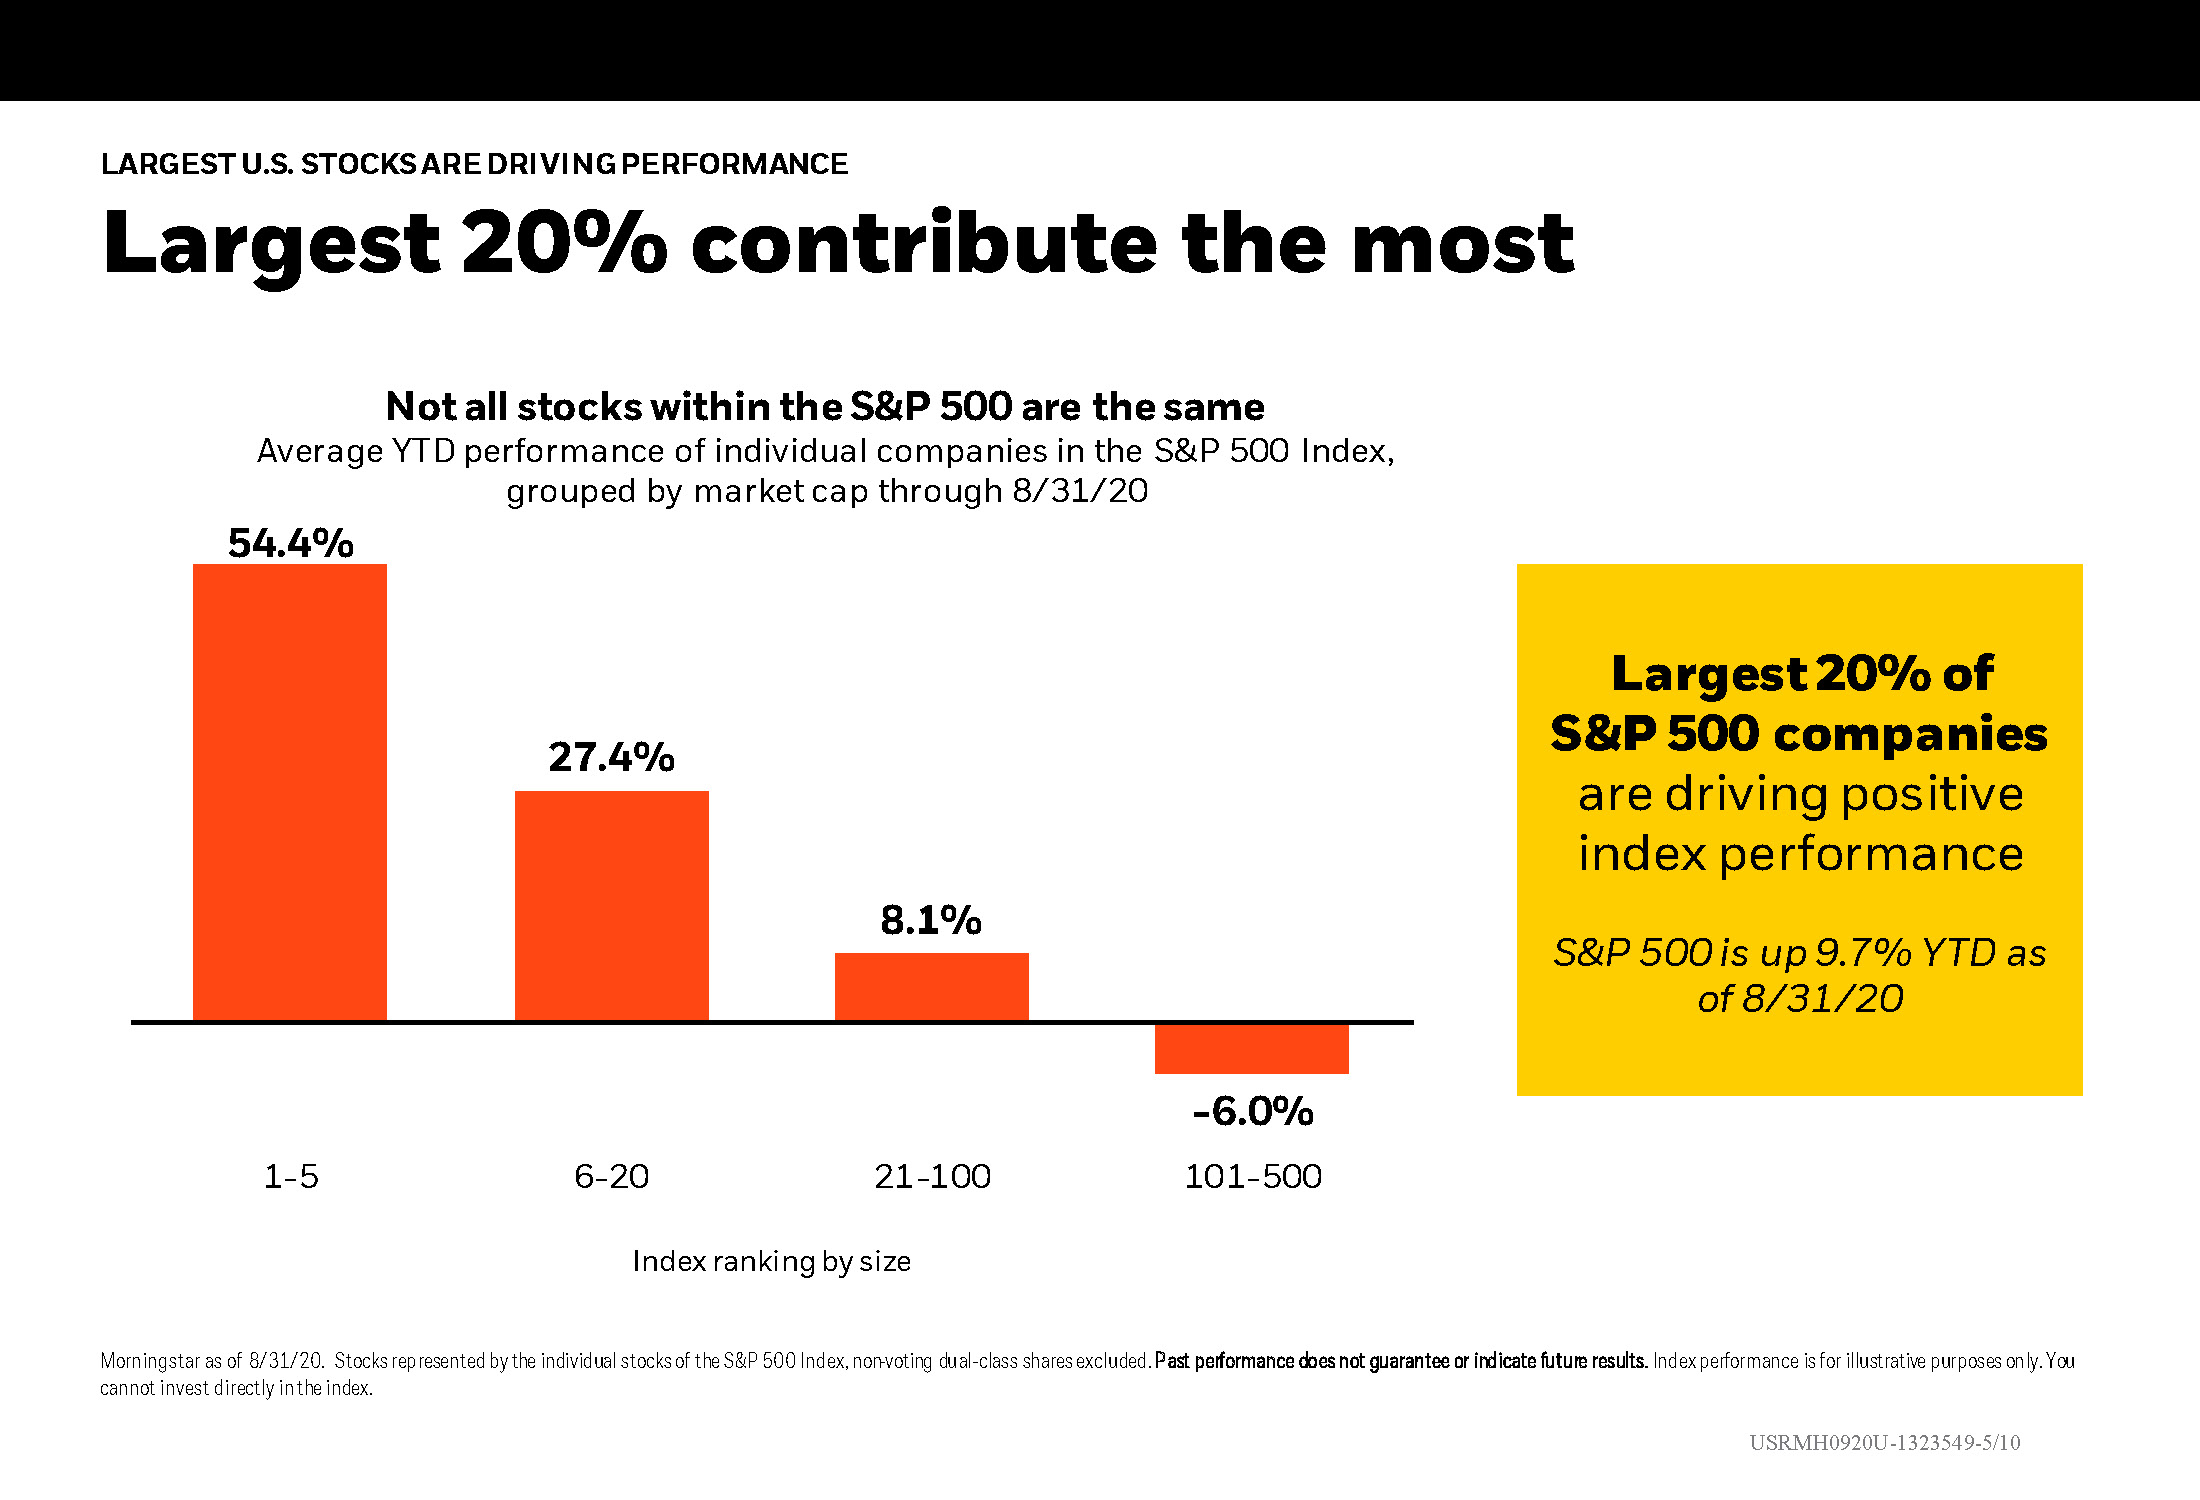
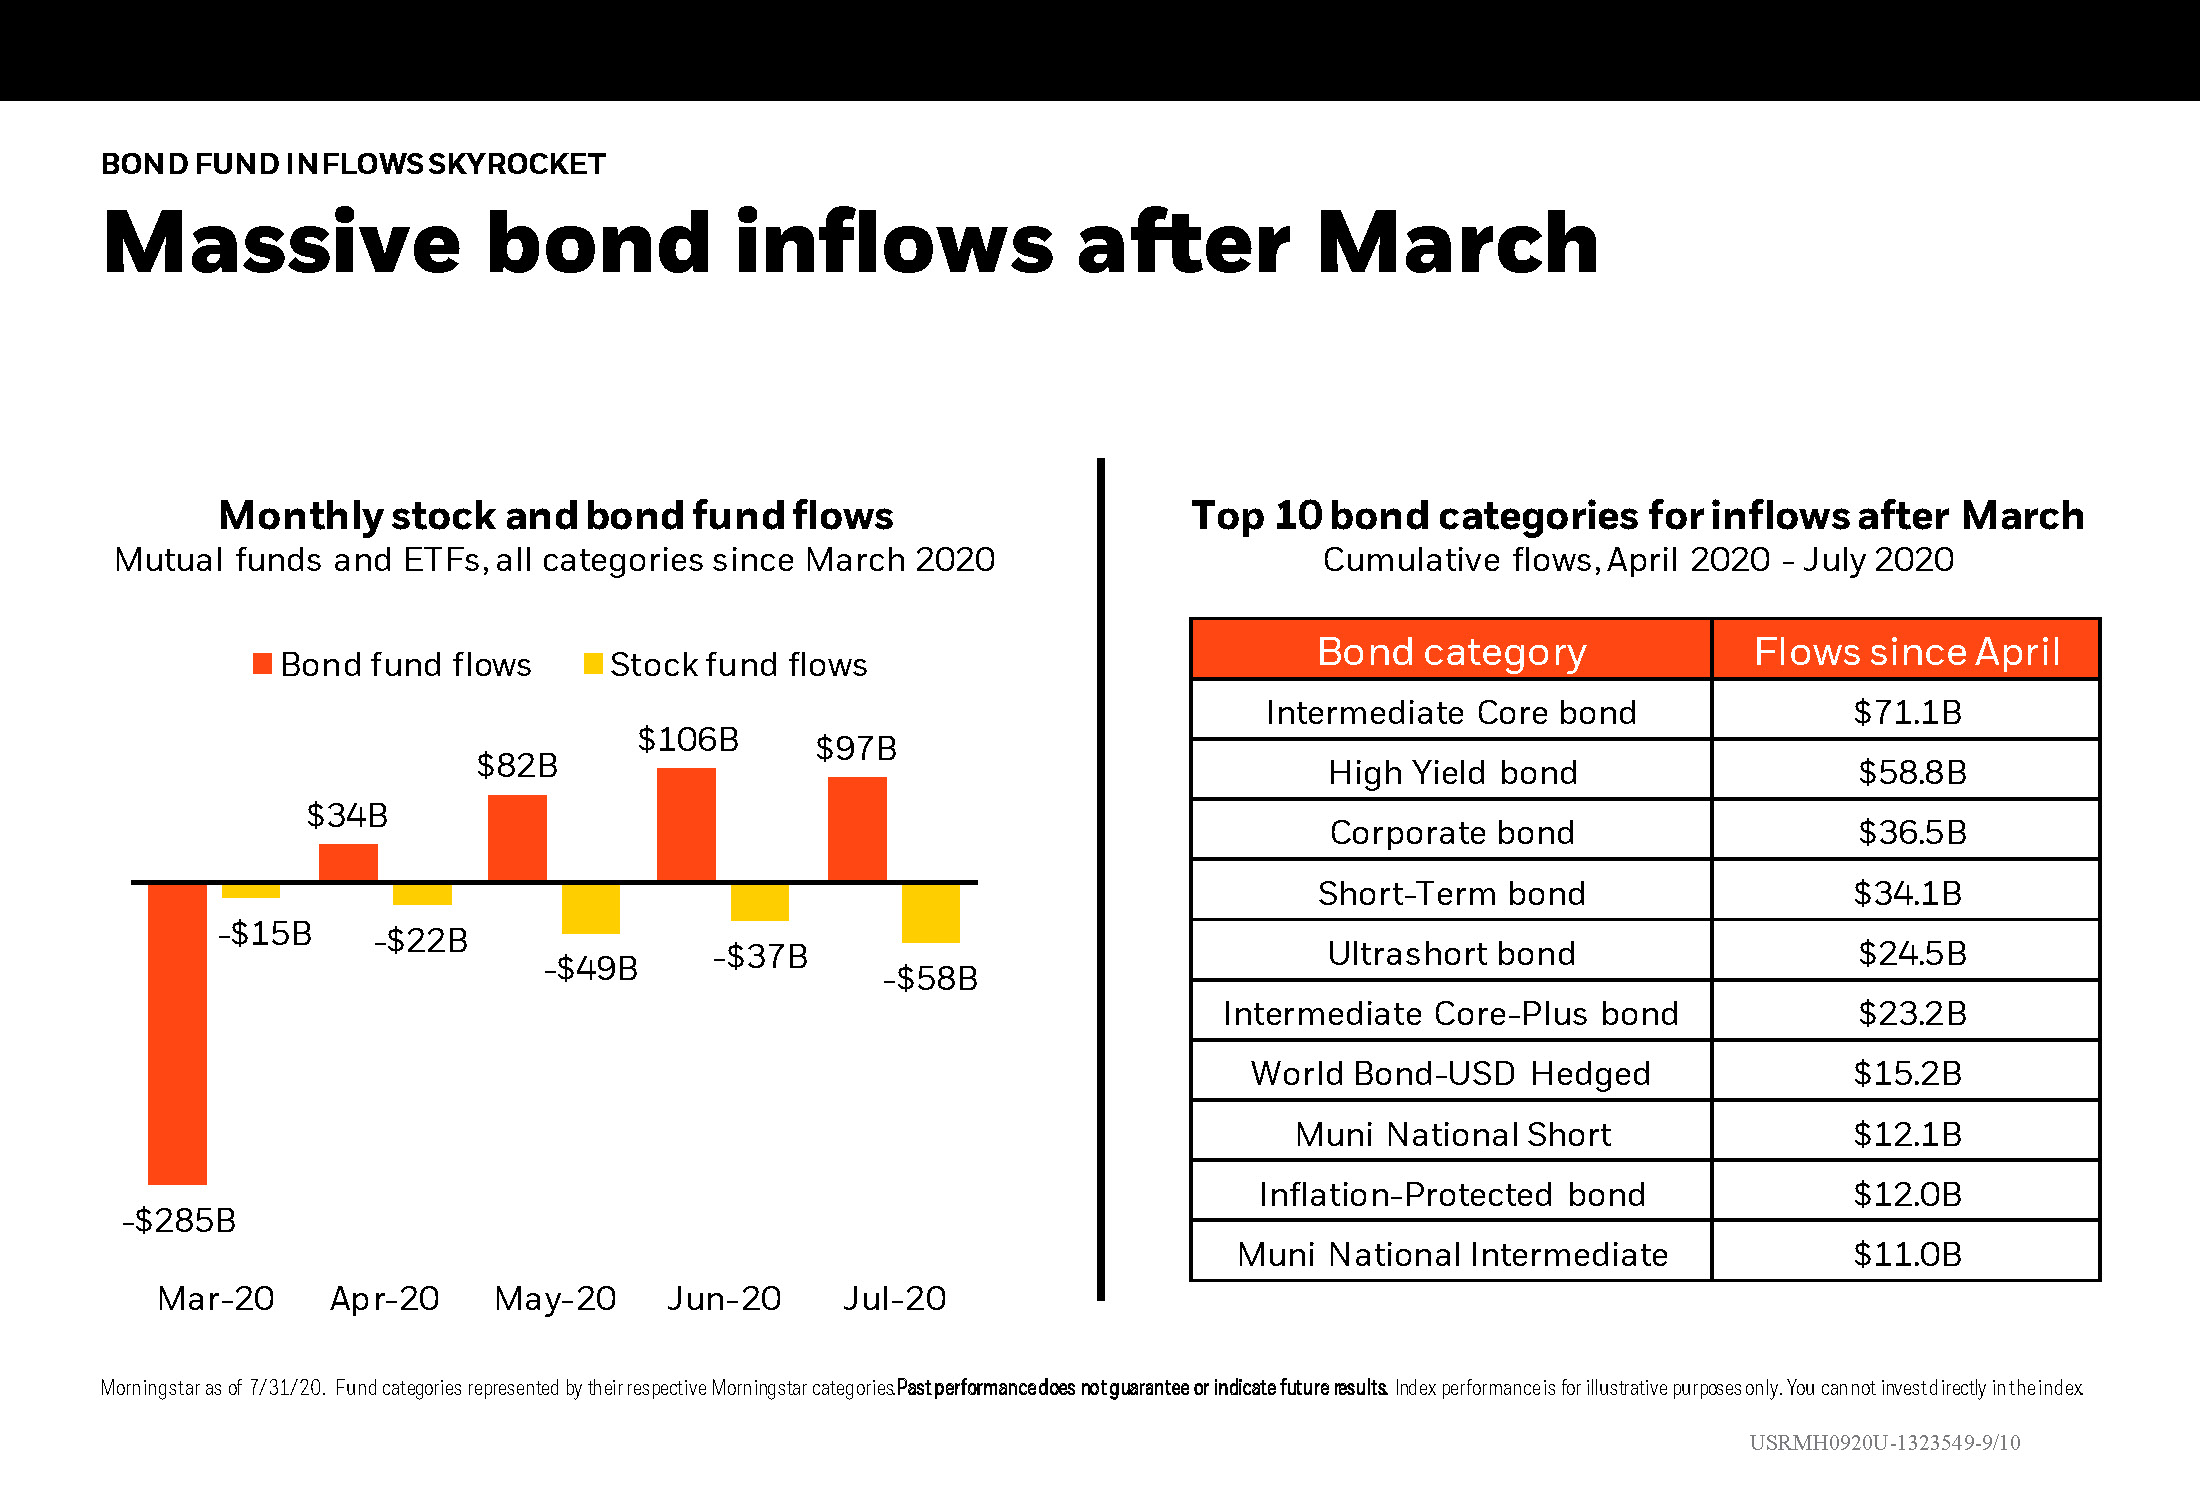
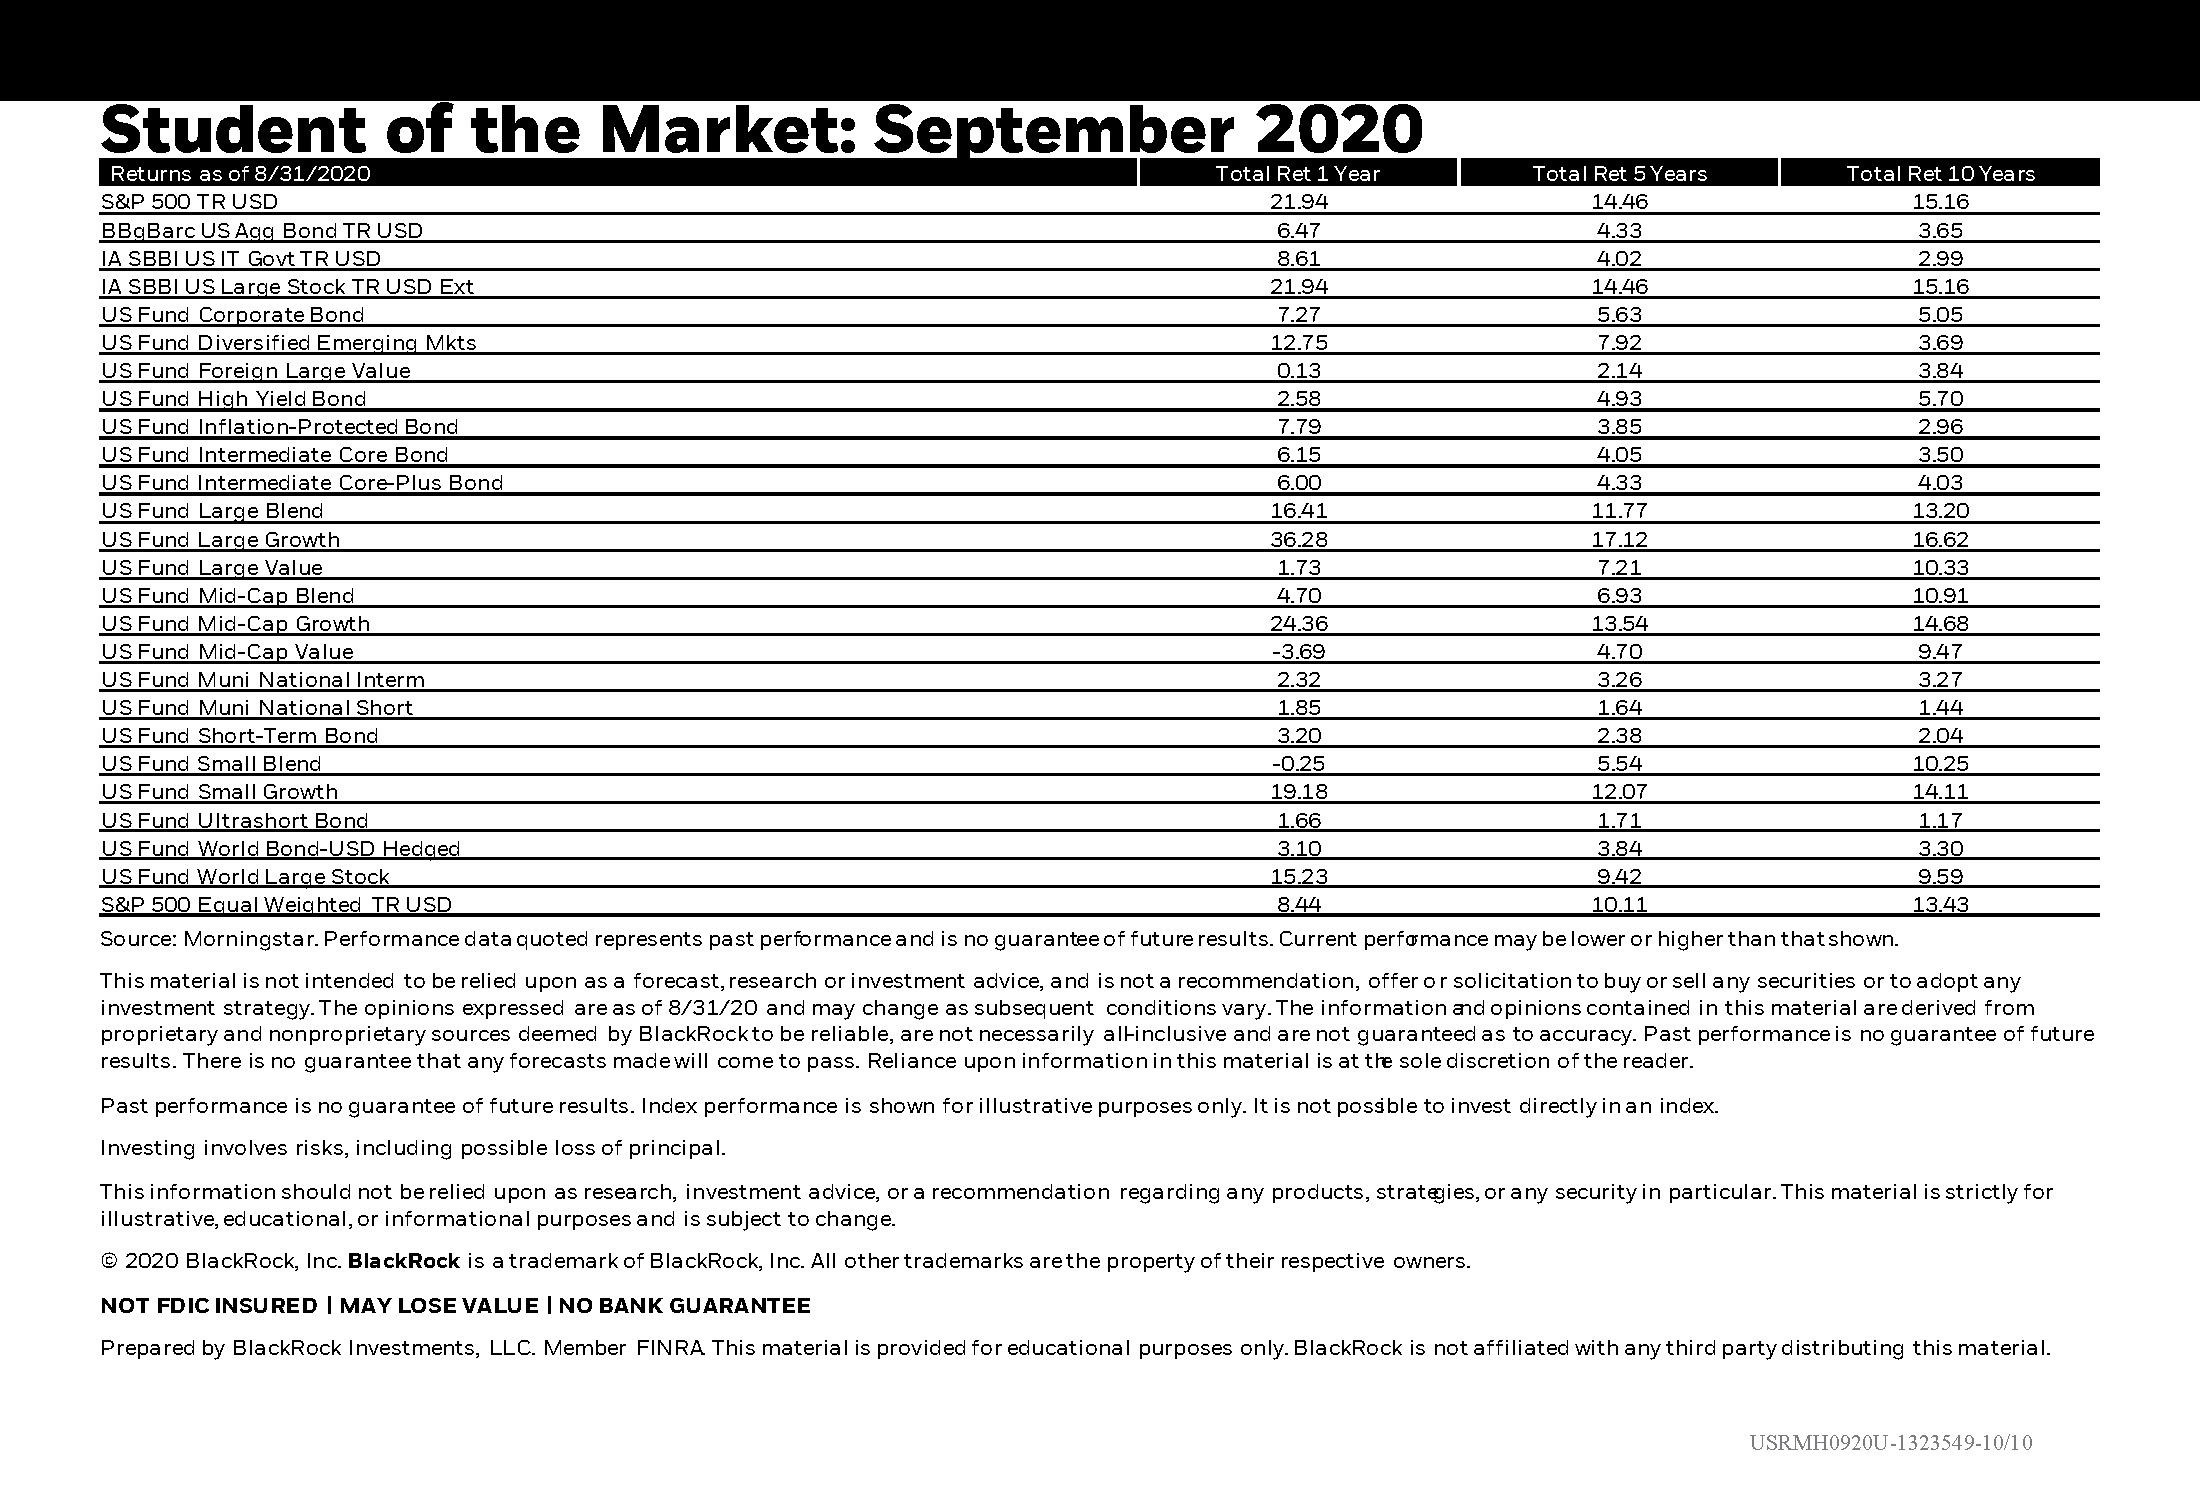
U.S. Stocks performance had the 8th best August since 1926. This market summary gives the stats for outflows, bond inflows, and the performance of the largest U.S. stocks.

September 7, 2020
Important Disclosure: Content on our website and in our newsletters is for informational purposes only. The information provided may (or may not) directly apply to your situation. We recommend that readers work directly with a professional advisor when making decisions in the context of their specific situation.

Other content you may like

  • Planning for Your Financial Future

    Planning for Your Financial Future

    April 5, 2023
    Money plays an important role at every turn your life takes. There are ways to develop good financial habits now so you can be prepared for the different strategies that certain events require in the future. And the good part is, you can start from wherever you are currently, to make decisions that will go a long way towards achieving your financial goals.
    Read this Article
  • Assess the Health of Your Business

    Assess the Health of Your Business

    January 16, 2024
    Taking a closer look at your company’s internal operations and external environment may help you avoid costly mistakes, improve your management practices, and refine your long-term strategic goals. There is an analysis tool that can help you hone your business strategy and strengthen your position in the marketplace.
    Read this Article
  • A happy, young couple just got the keys to their first home.

    Can the Next Generation Afford Home Ownership?

    July 22, 2025
    This article explores factors influencing housing affordability, the impact of current economic conditions, and future prospects. Readers will discover insights into decision-making for first-time real estate purchases and strategic approaches to homeownership.
    Read this Article
  • Market Performance and a Recession Indicator

    Market Performance and a Recession Indicator

    December 1, 2022
    U.S. stocks historically average 10% per year but rarely do they finish a year at that level. See the difference between the average annual return and what happened to stocks YTD in 2022 by looking at the range of returns for stocks by the full calendar year. A quick glance at the most reliable recession indicator and how alternative asset classes do better when the return on “cash” is higher. Plus stats on market performance.
    Read this Article
  • The link you have selected is located on another server. The linked site contains information that has been created, published, maintained, or otherwise posted by institutions or organizations independent of this organization. We do not endorse, approve, certify, or control any linked websites, their sponsors, or any of their policies, activities, products, or services. We do not assume responsibility for the accuracy, completeness, or timeliness of the information contained therein. Visitors to any linked websites should not use or rely on the information contained therein until they have consulted with an independent financial professional. Please click “Continue to Link” to leave this website and proceed to the selected site.
    phone-handset