Article

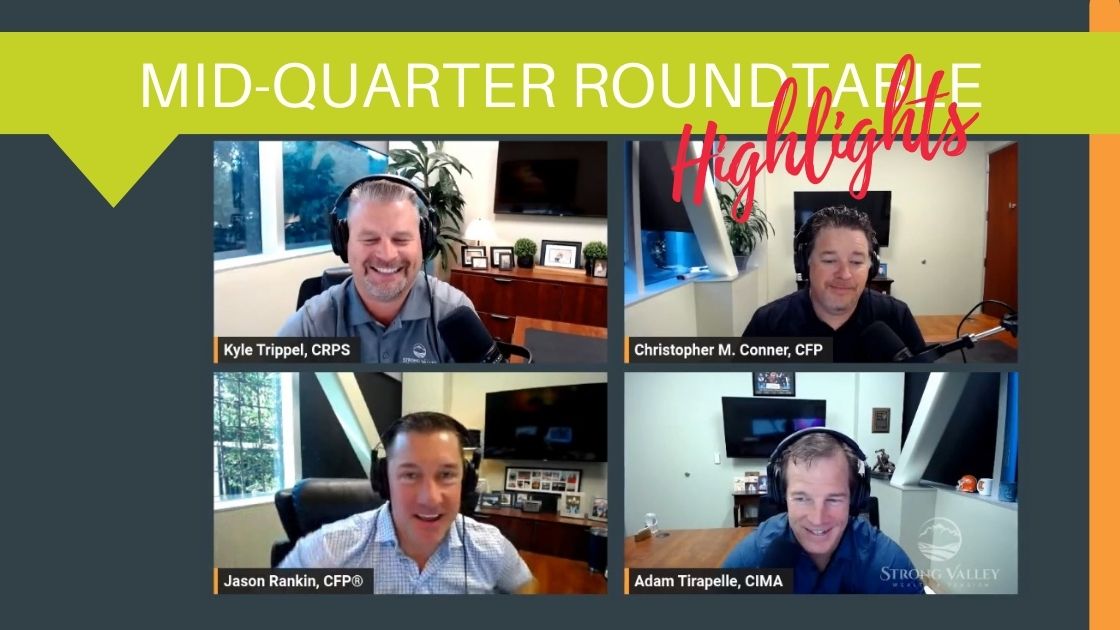
Podcast Highlight - New Tool for Clients to Visualize Strategy

As a way to help clients visualize the big picture during the ups and downs of a long-term financial strategy, the Team introduces a new software tool that does that.

Enjoy this highlight clip from the Strong Valley Mid-Quarter Roundtable discussion. If you have questions for the Strong Valley team, check out strongvalley.com and use the Contact form to submit your questions.

You can stay up-to-date with the quarterly updates by following us at strongvalley.com/podcast, or by subscribing to the Strong Valley podcast on iTunes.


August 31, 2023
Important Disclosure: Content on our website and in our newsletters is for informational purposes only. The information provided may (or may not) directly apply to your situation. We recommend that readers work directly with a professional advisor when making decisions in the context of their specific situation.

Other content you may like

  • APR Student of the Market image

    Interest Rates Swung Dramatically

    April 26, 2023
    This end of the month Market overview looks at the dramatic swing in falling interest rates and how it affected market volatility. It also includes data showing how U.S. stocks have persevered through financial crisis and bank failures. Plus a new look at Money Market and Bond Fund flows.
    Read this Article
  • What Should You Do as Markets Flirt with Bears?

    What Should You Do as Markets Flirt with Bears?

    May 24, 2022
    Market declines should inform – not drive – your asset allocation decisions. Does it matter if the S&P 500 is down 19% versus 21%? Both scenarios probably leave you feeling anxious and you’re sure not alone. It’s times like this that perspective is important. This article examines the last time the S&P 500 was in a bear market and a little history of other past bear markets.
    Read this Article
  • Market Performance and a Recession Indicator

    Market Performance and a Recession Indicator

    December 1, 2022
    U.S. stocks historically average 10% per year but rarely do they finish a year at that level. See the difference between the average annual return and what happened to stocks YTD in 2022 by looking at the range of returns for stocks by the full calendar year. A quick glance at the most reliable recession indicator and how alternative asset classes do better when the return on “cash” is higher. Plus stats on market performance.
    Read this Article
  • A couple sitting at a table and filling out a document or form.

    The Value of Bonds

    April 24, 2026
    Bonds can be an important component in a balanced investment portfolio, offering a reliable income stream. They can also help balance risk in uncertain times. Understanding bond dynamics, value and intricacies, can significantly enhance your investment strategy.
    Read this Article
  • The link you have selected is located on another server. The linked site contains information that has been created, published, maintained, or otherwise posted by institutions or organizations independent of this organization. We do not endorse, approve, certify, or control any linked websites, their sponsors, or any of their policies, activities, products, or services. We do not assume responsibility for the accuracy, completeness, or timeliness of the information contained therein. Visitors to any linked websites should not use or rely on the information contained therein until they have consulted with an independent financial professional. Please click “Continue to Link” to leave this website and proceed to the selected site.
    phone-handset