For clients of Kate Eiland, please CLICK HERE to see important details related to the Strong Valley transition.
Article

Presidential Election Momentum

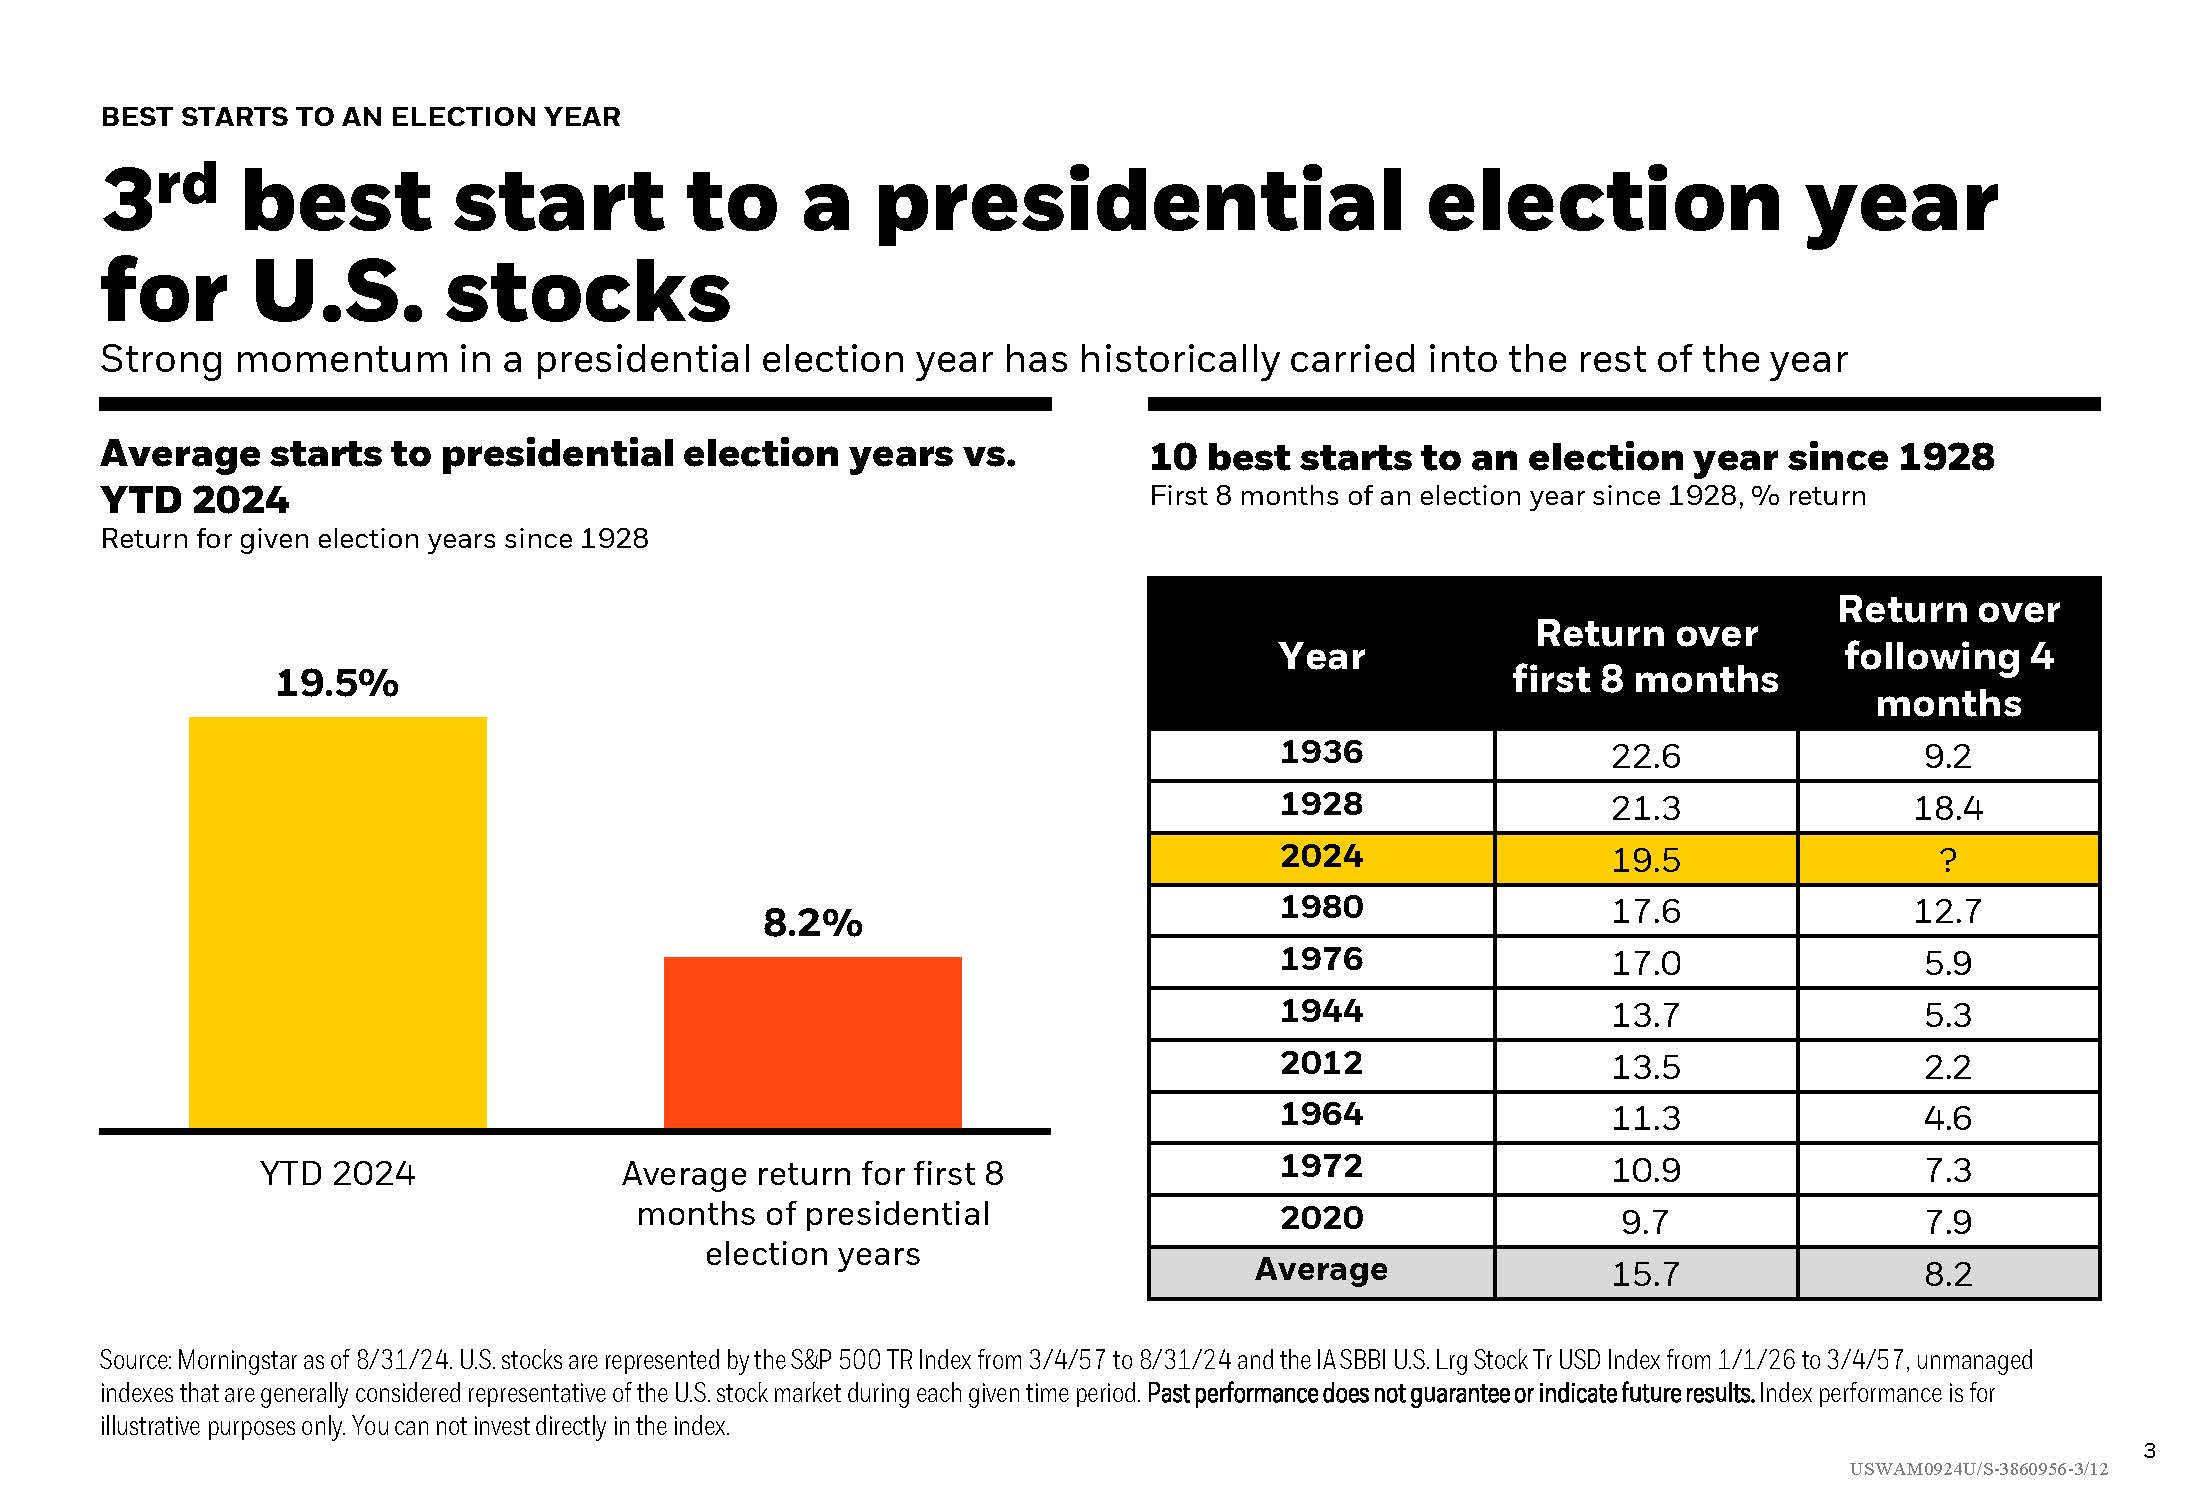
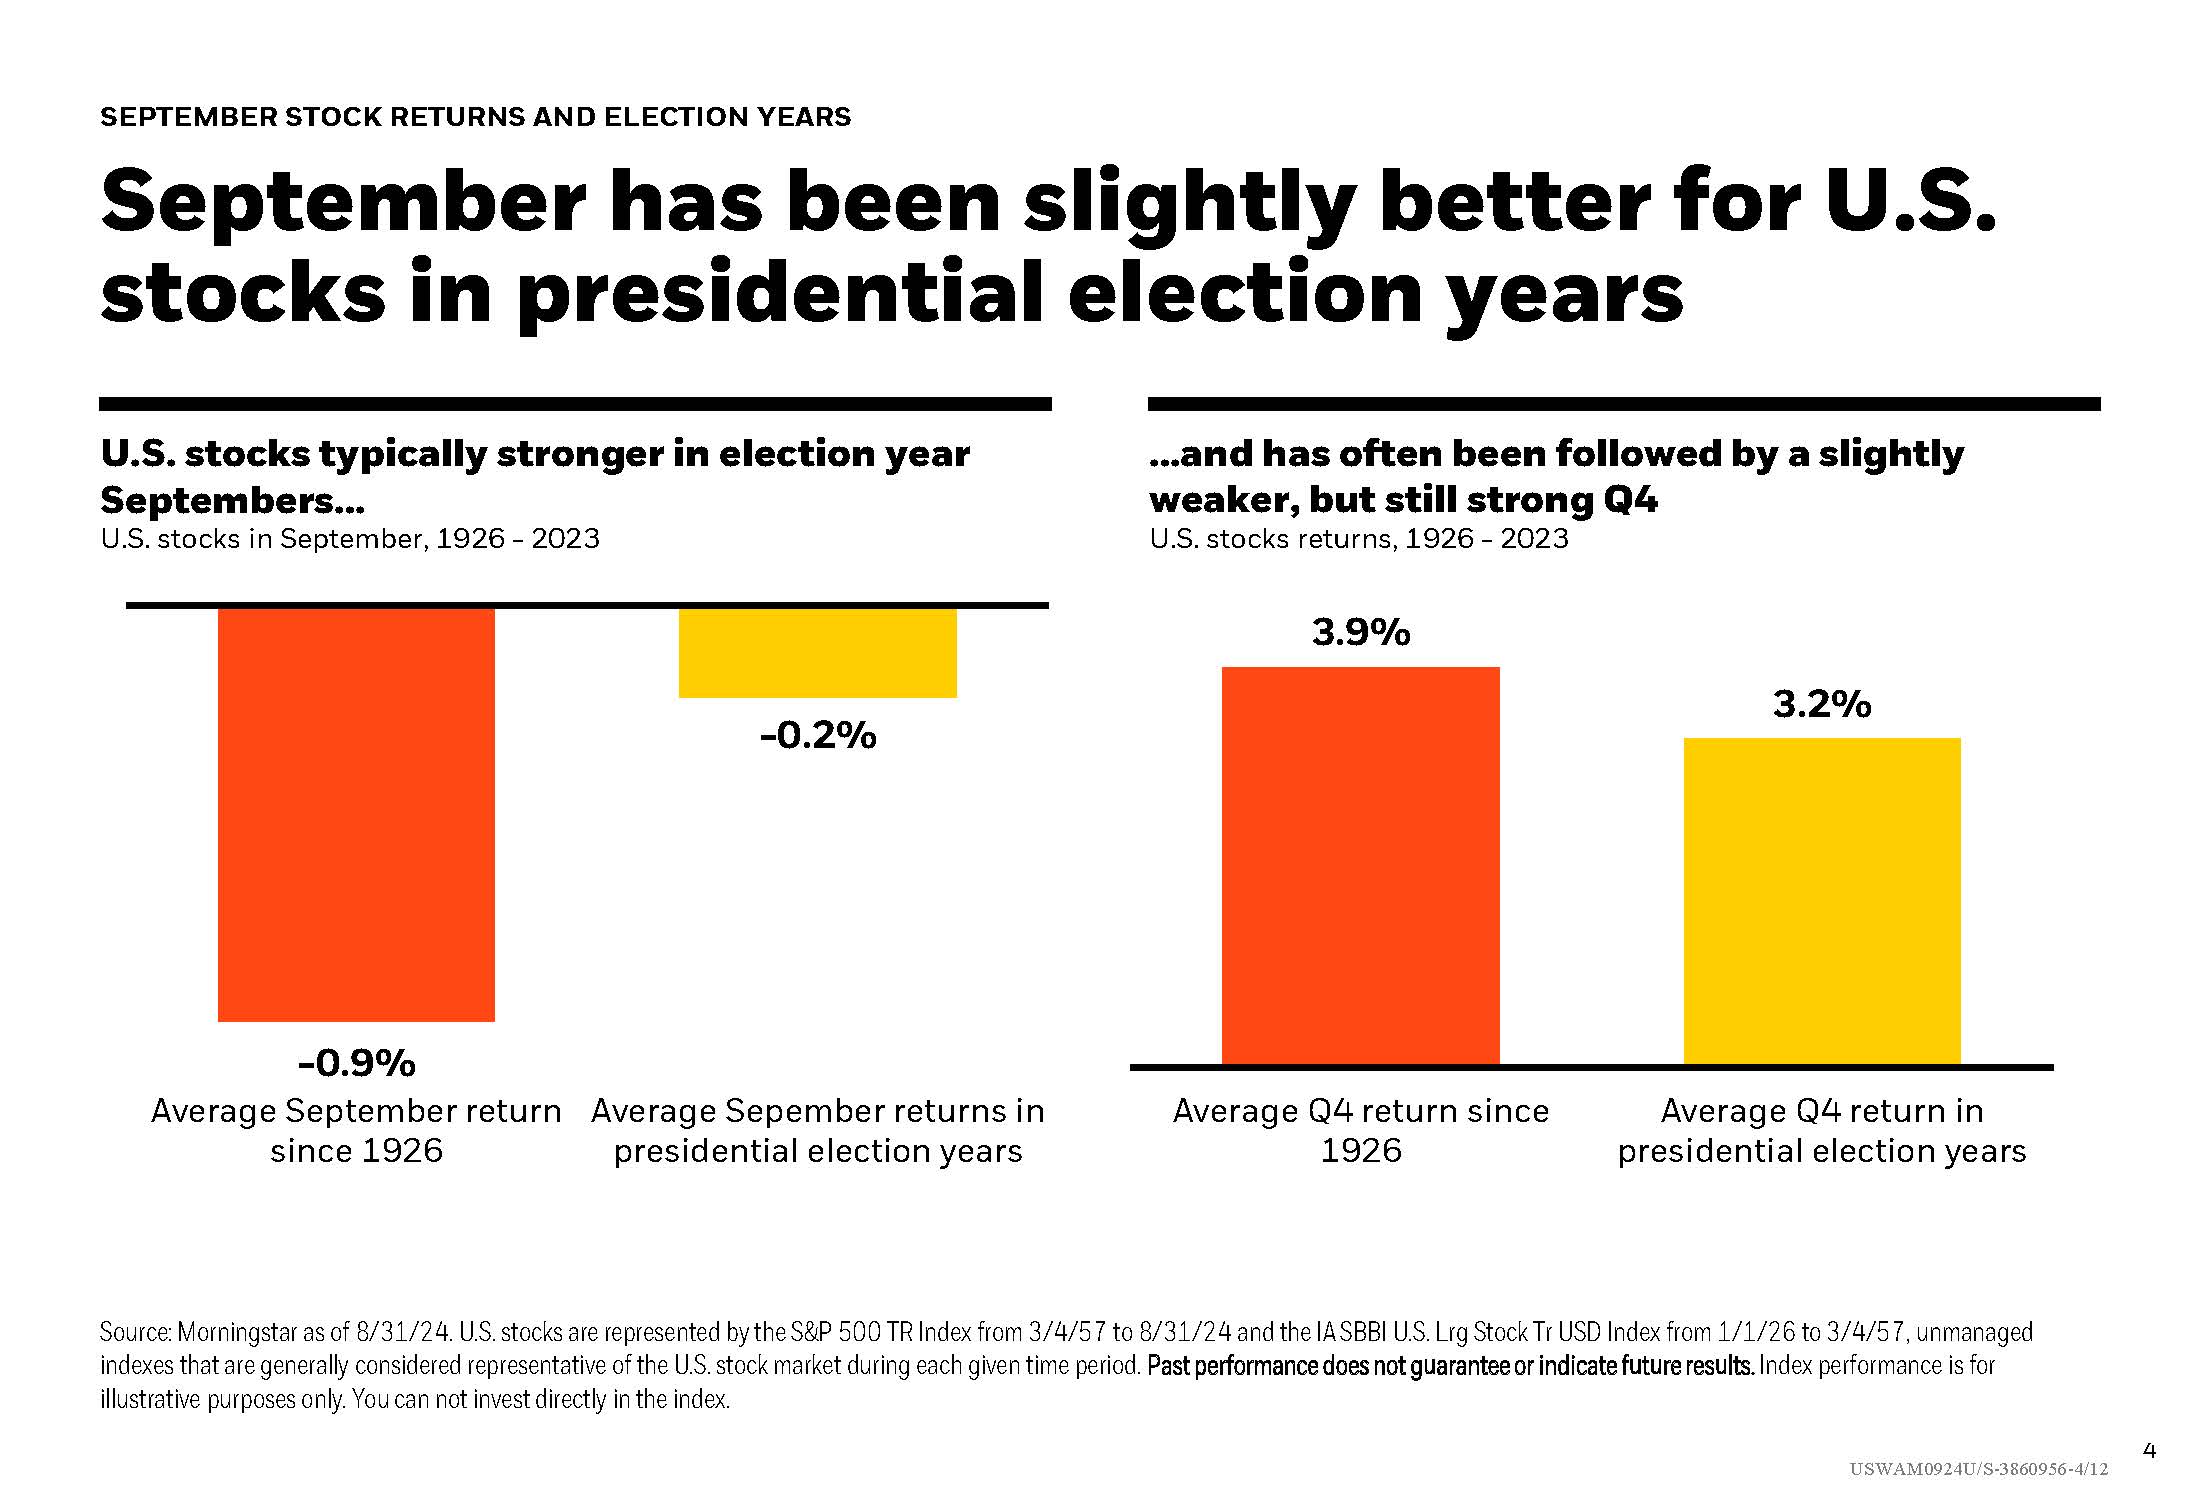
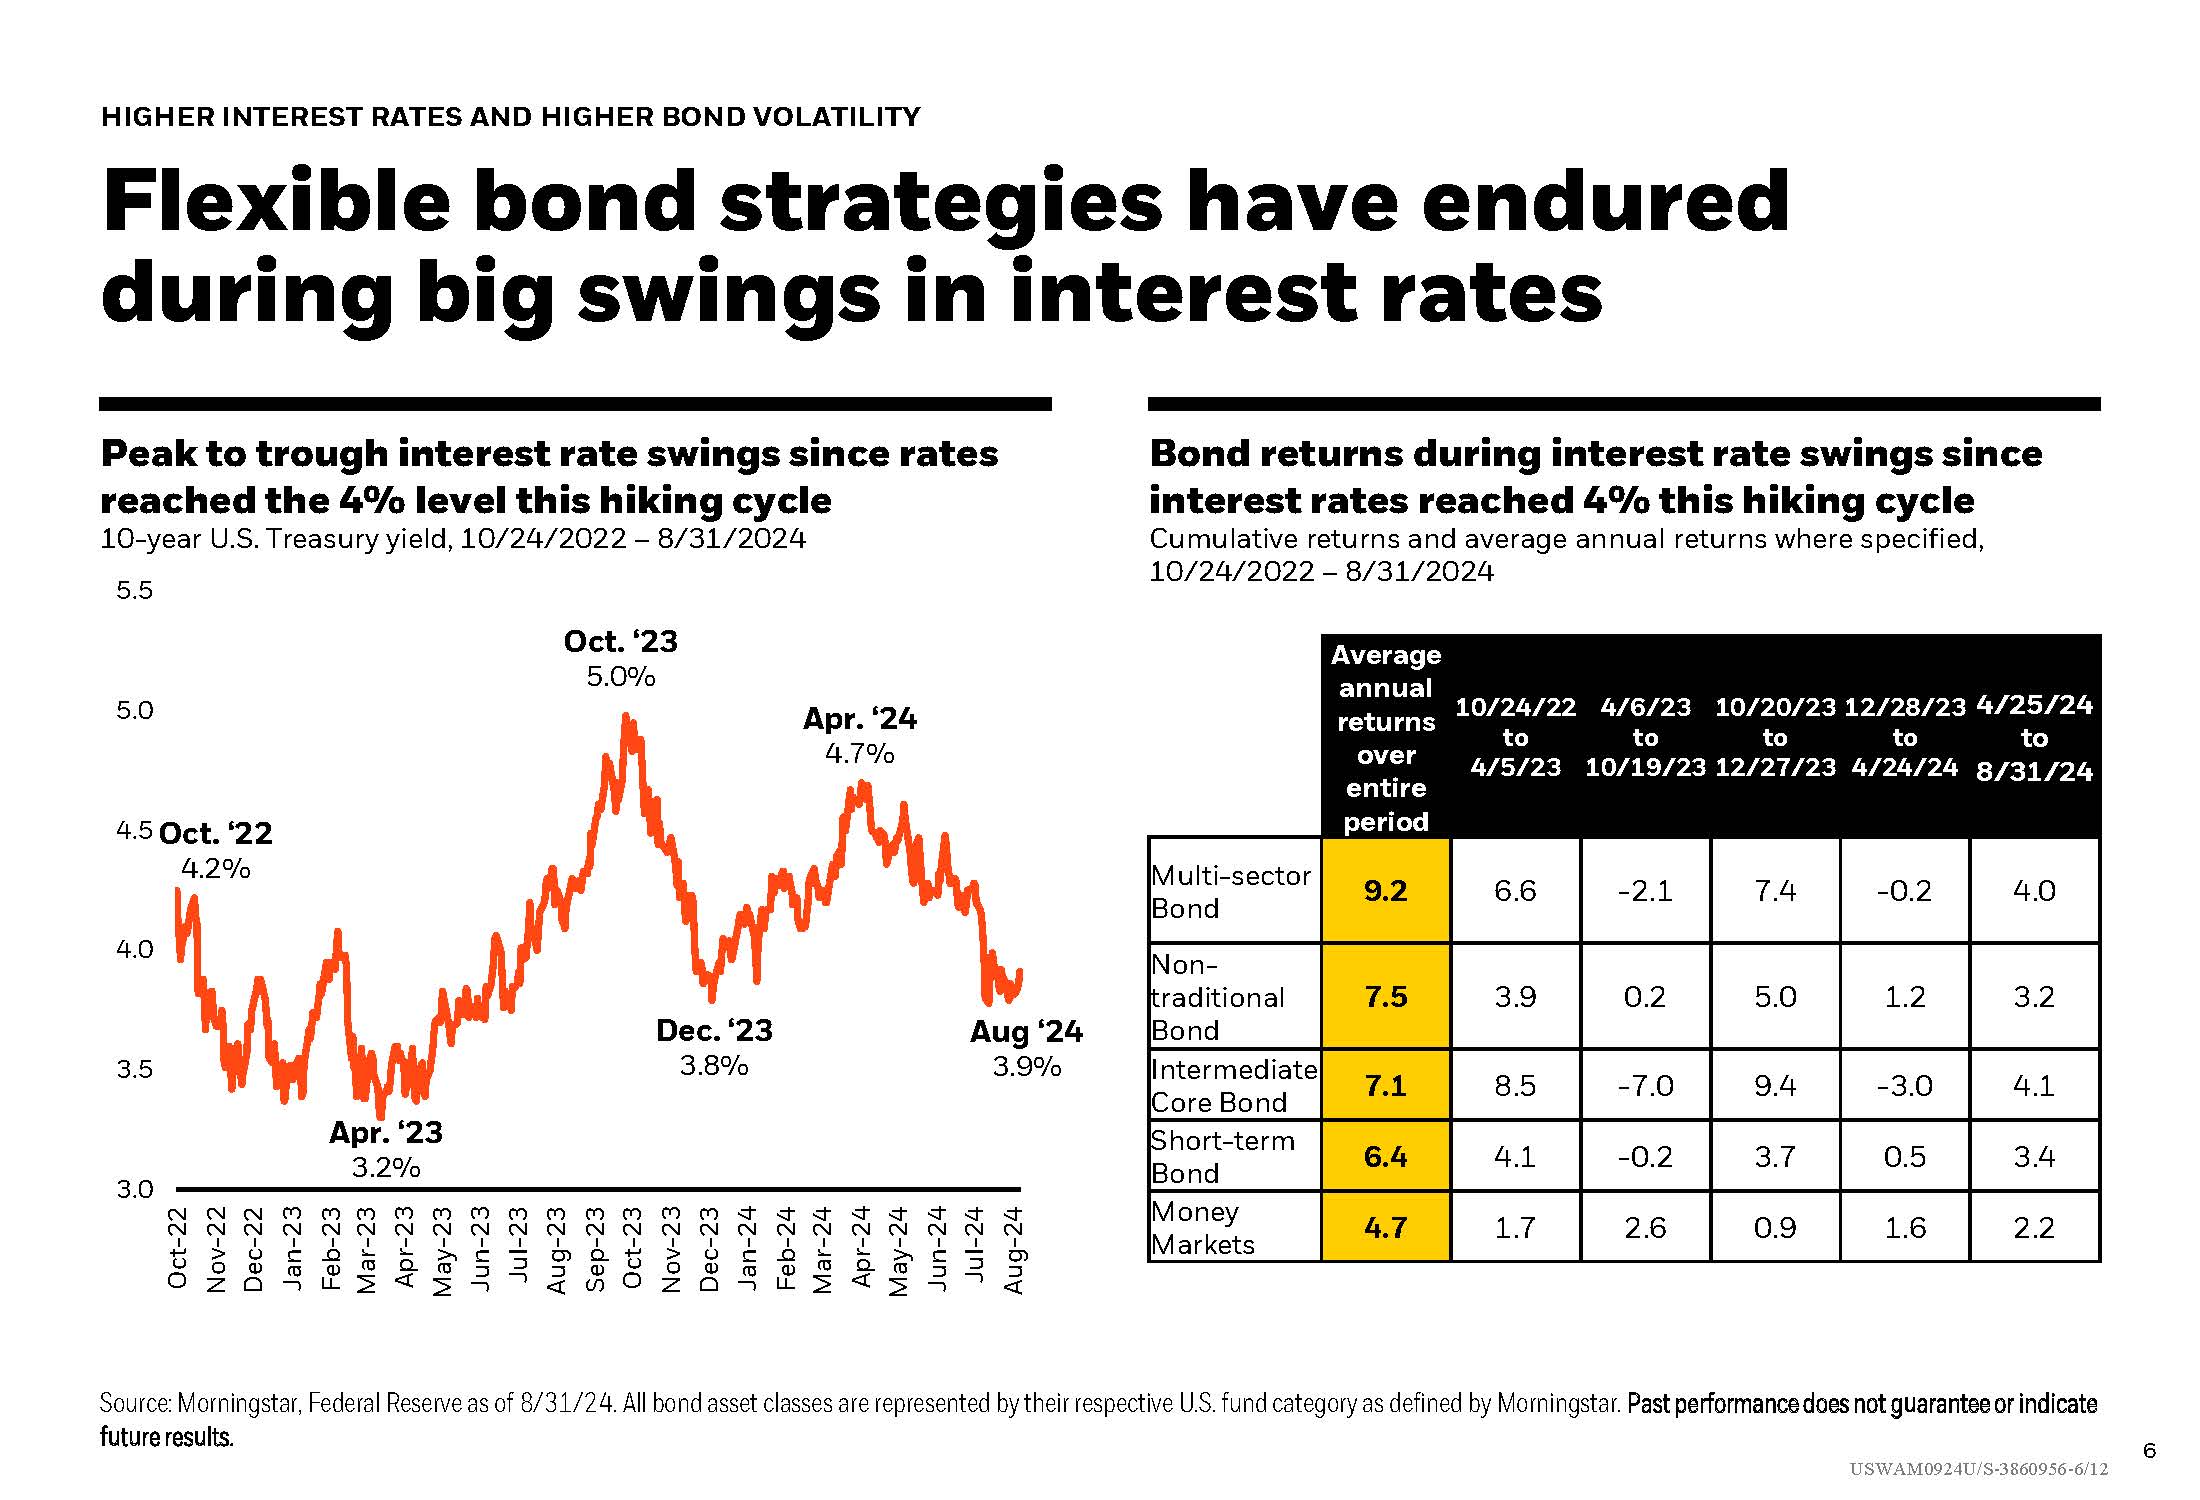
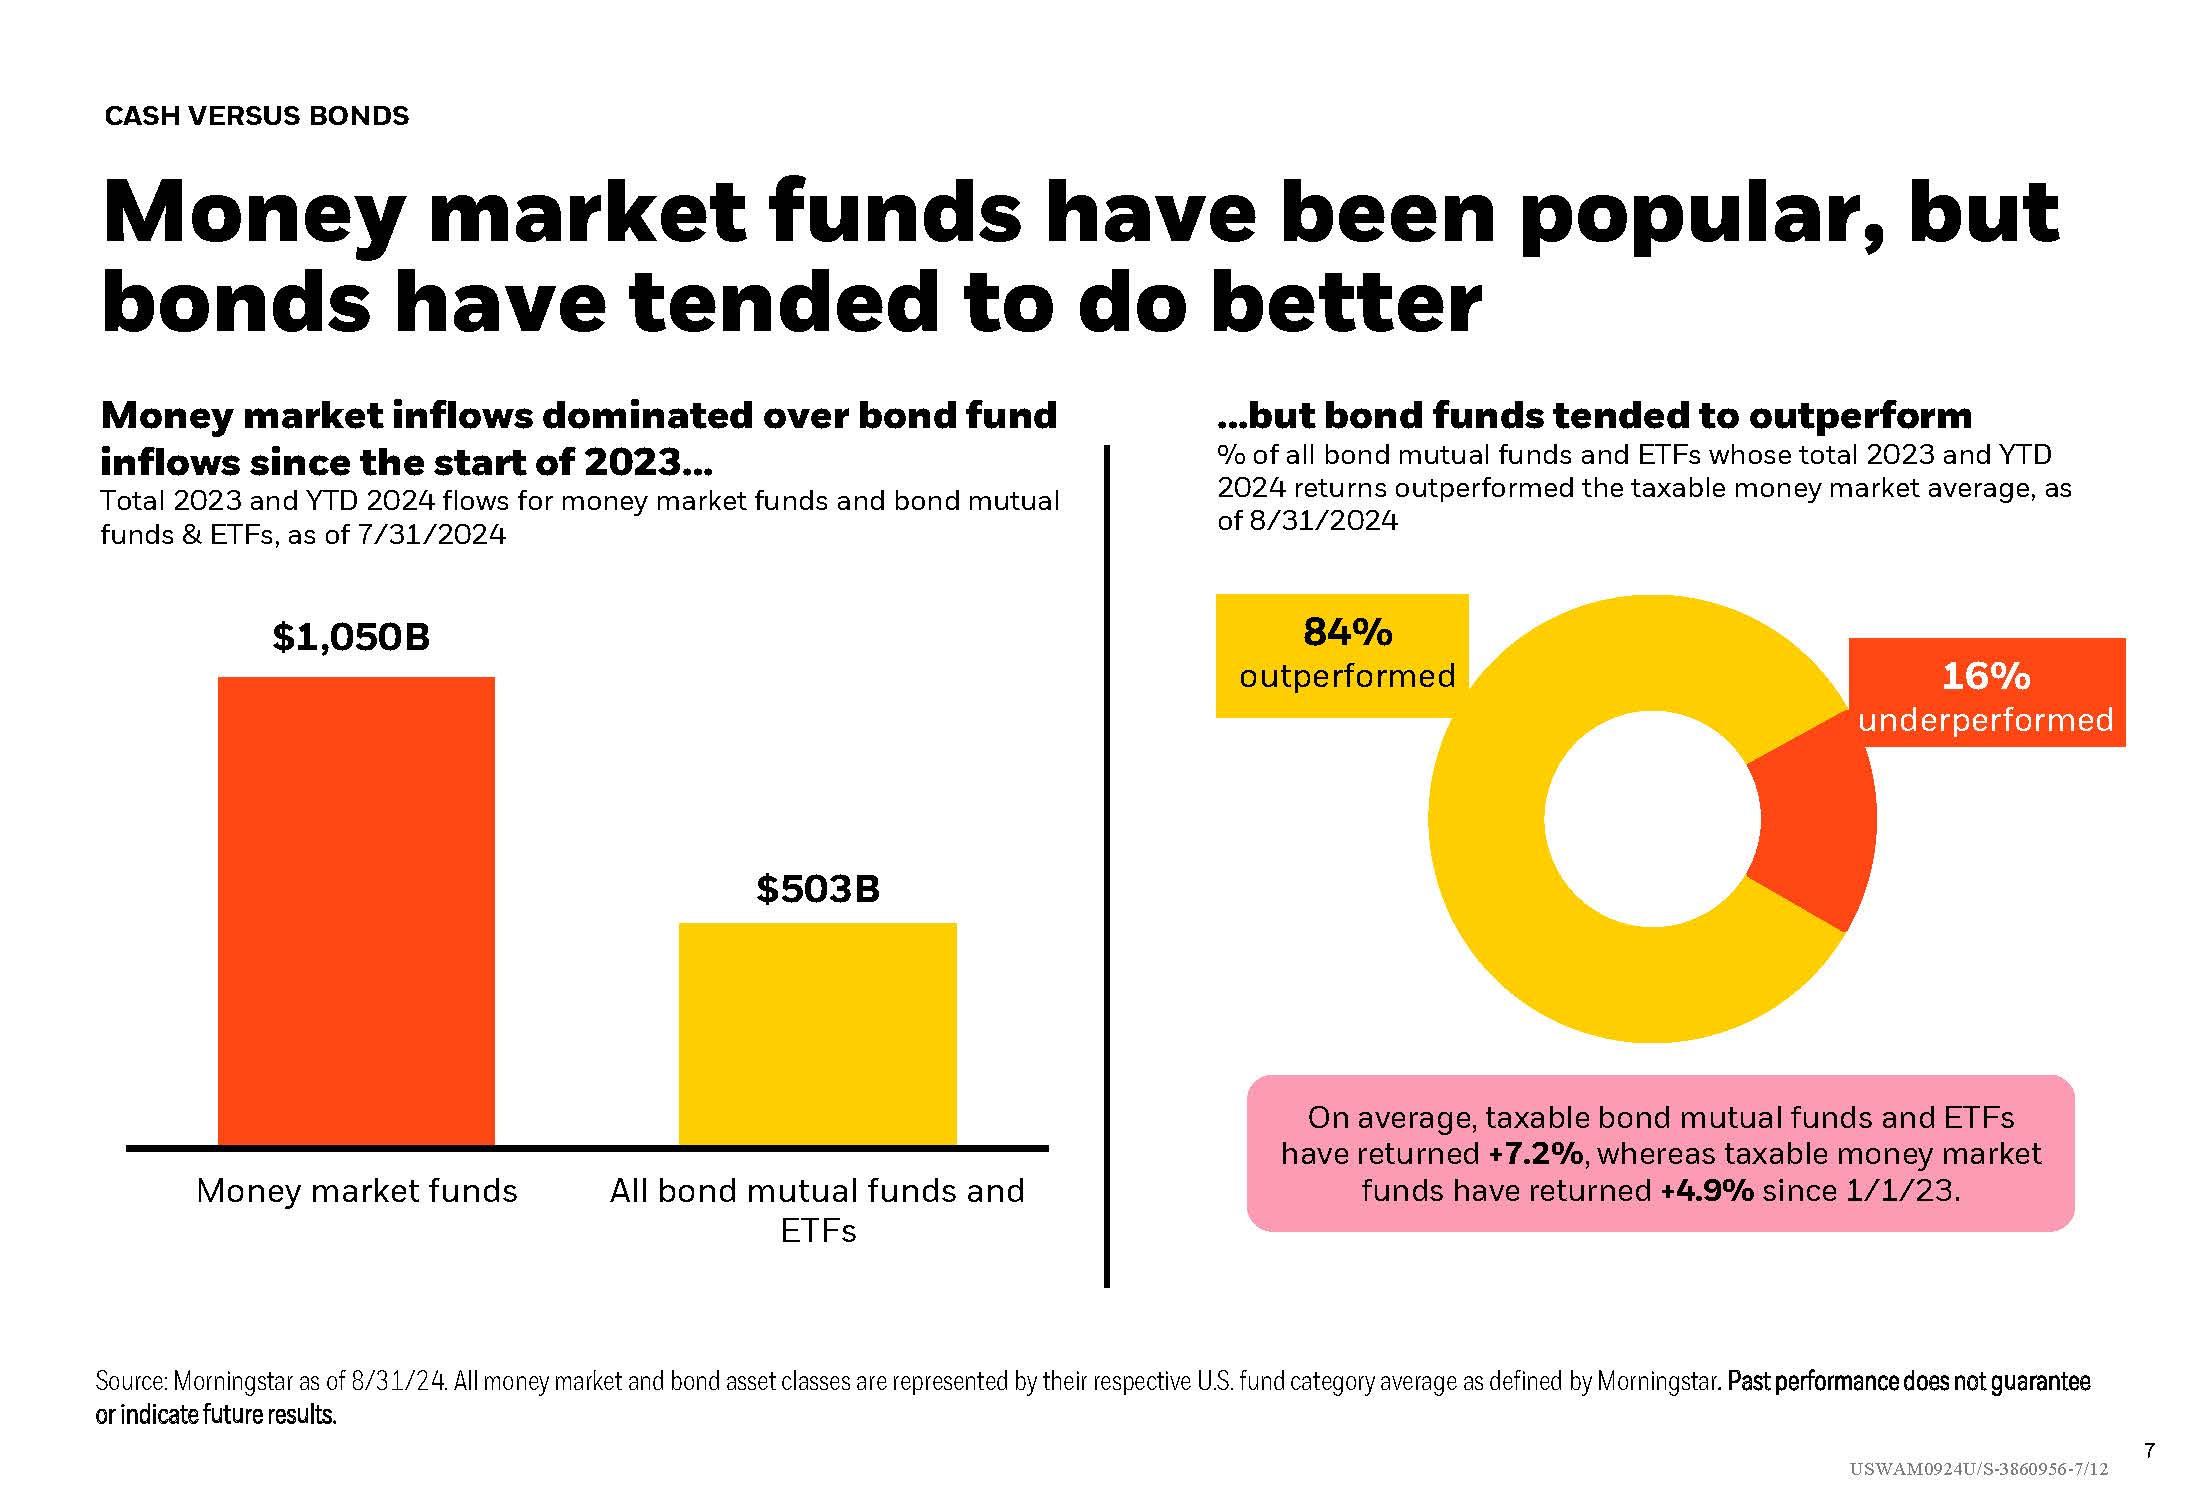
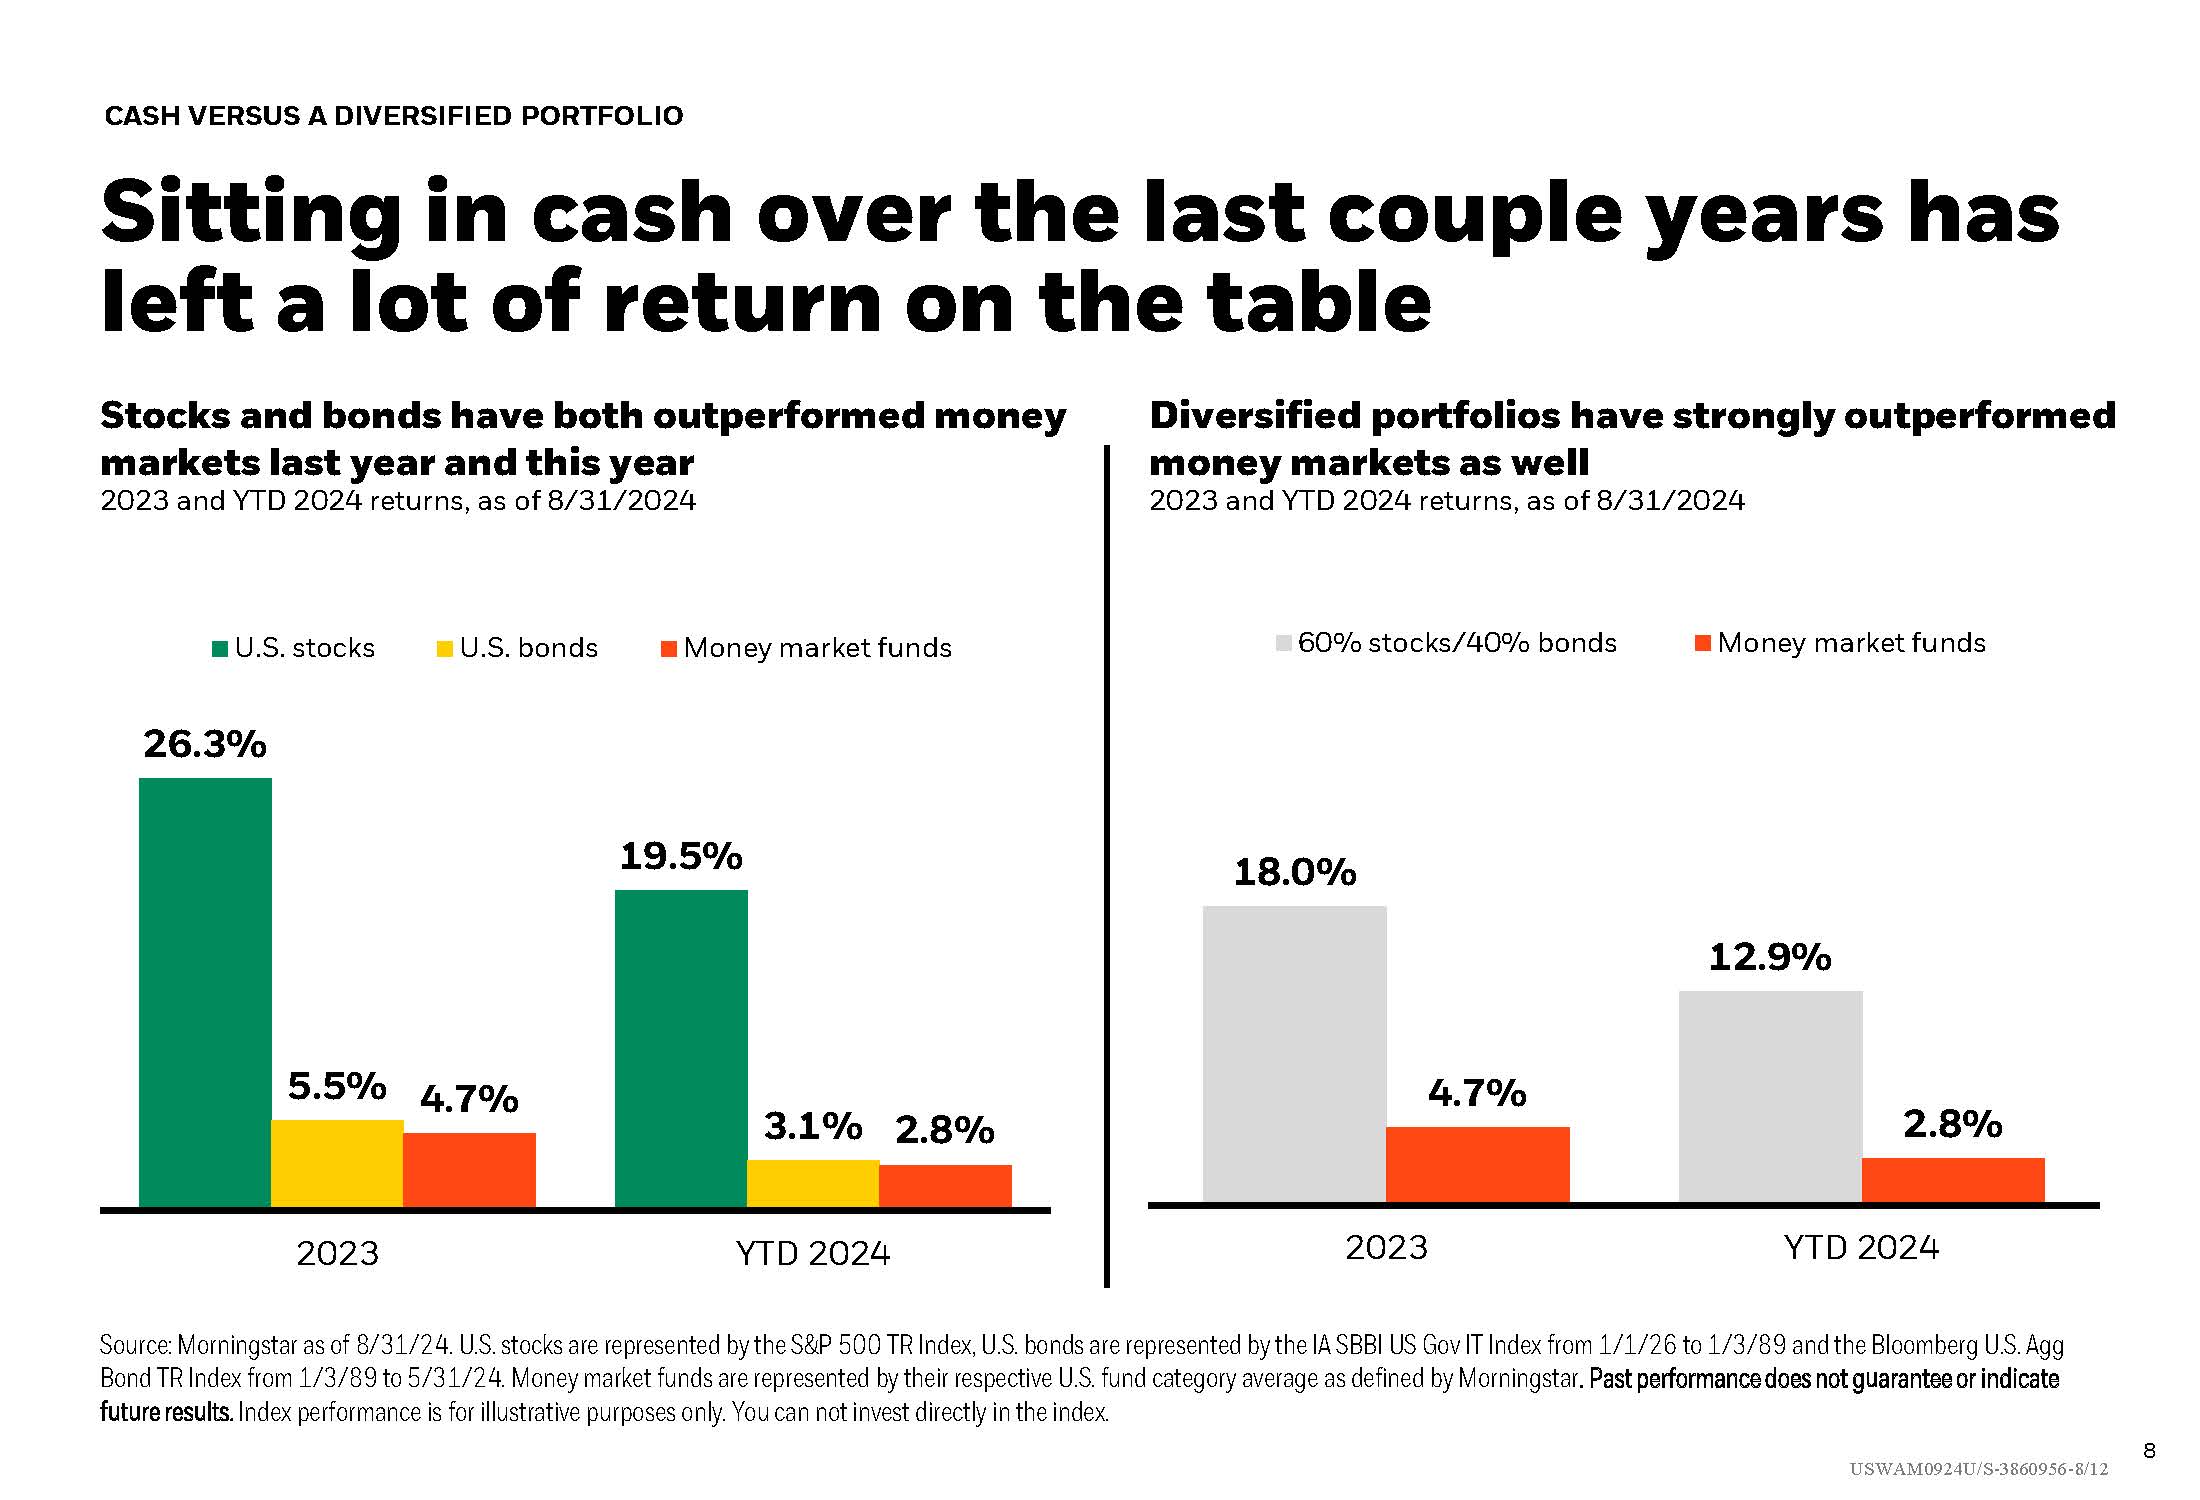
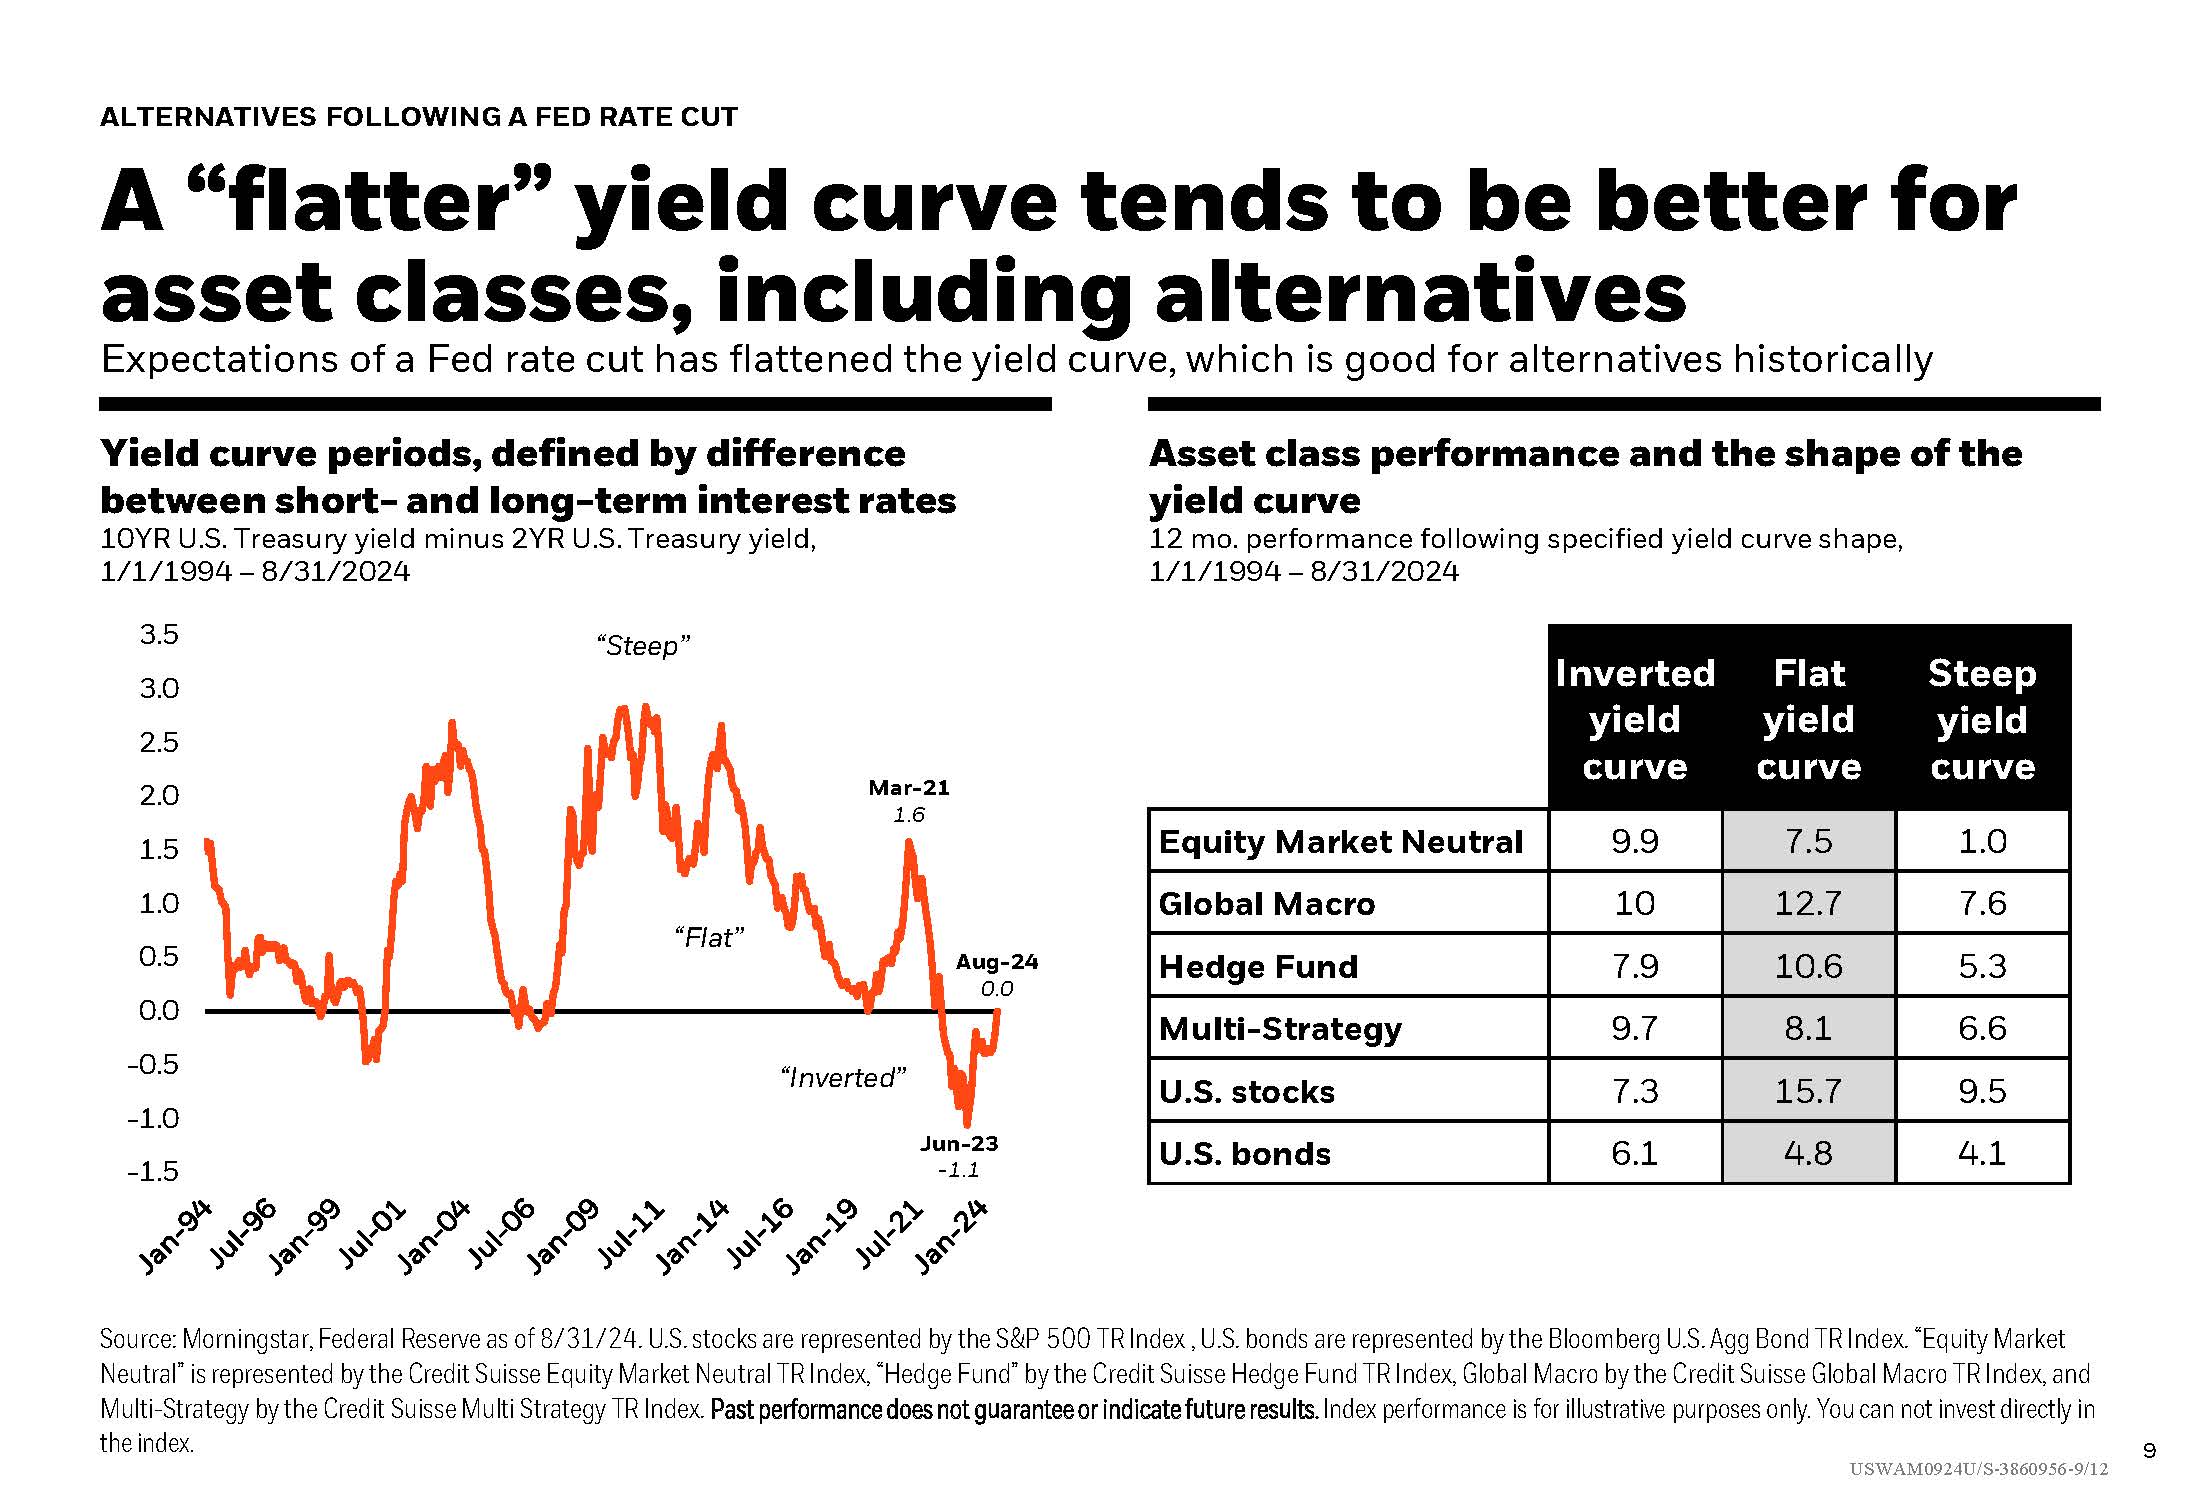
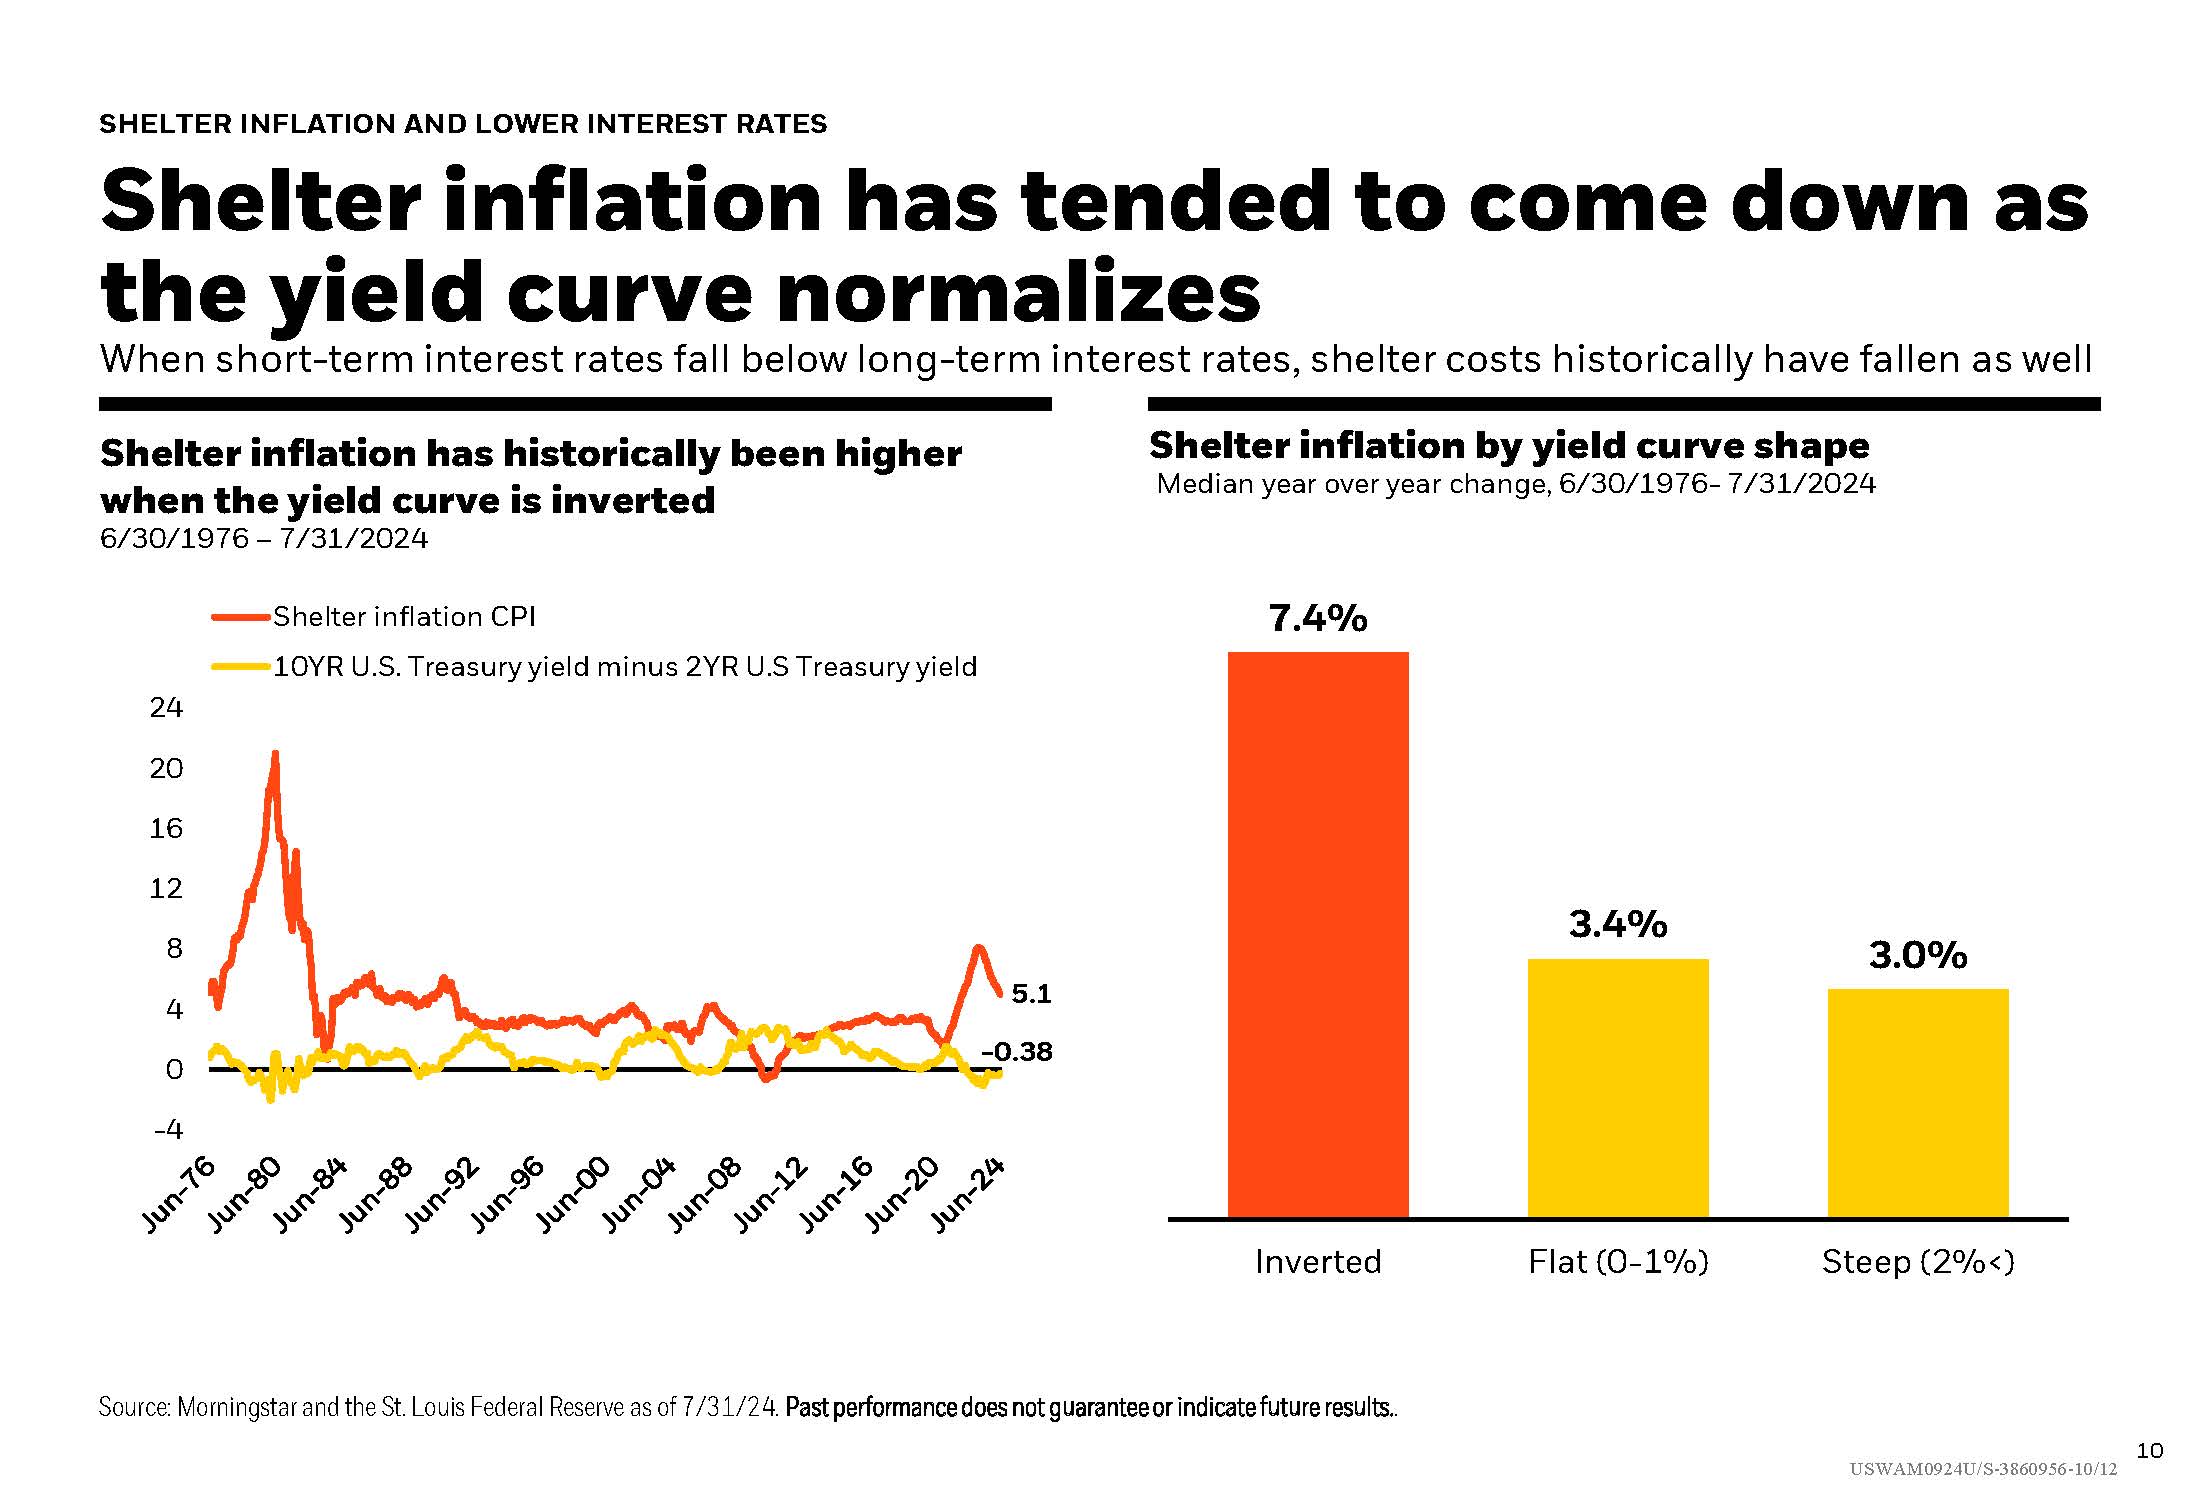
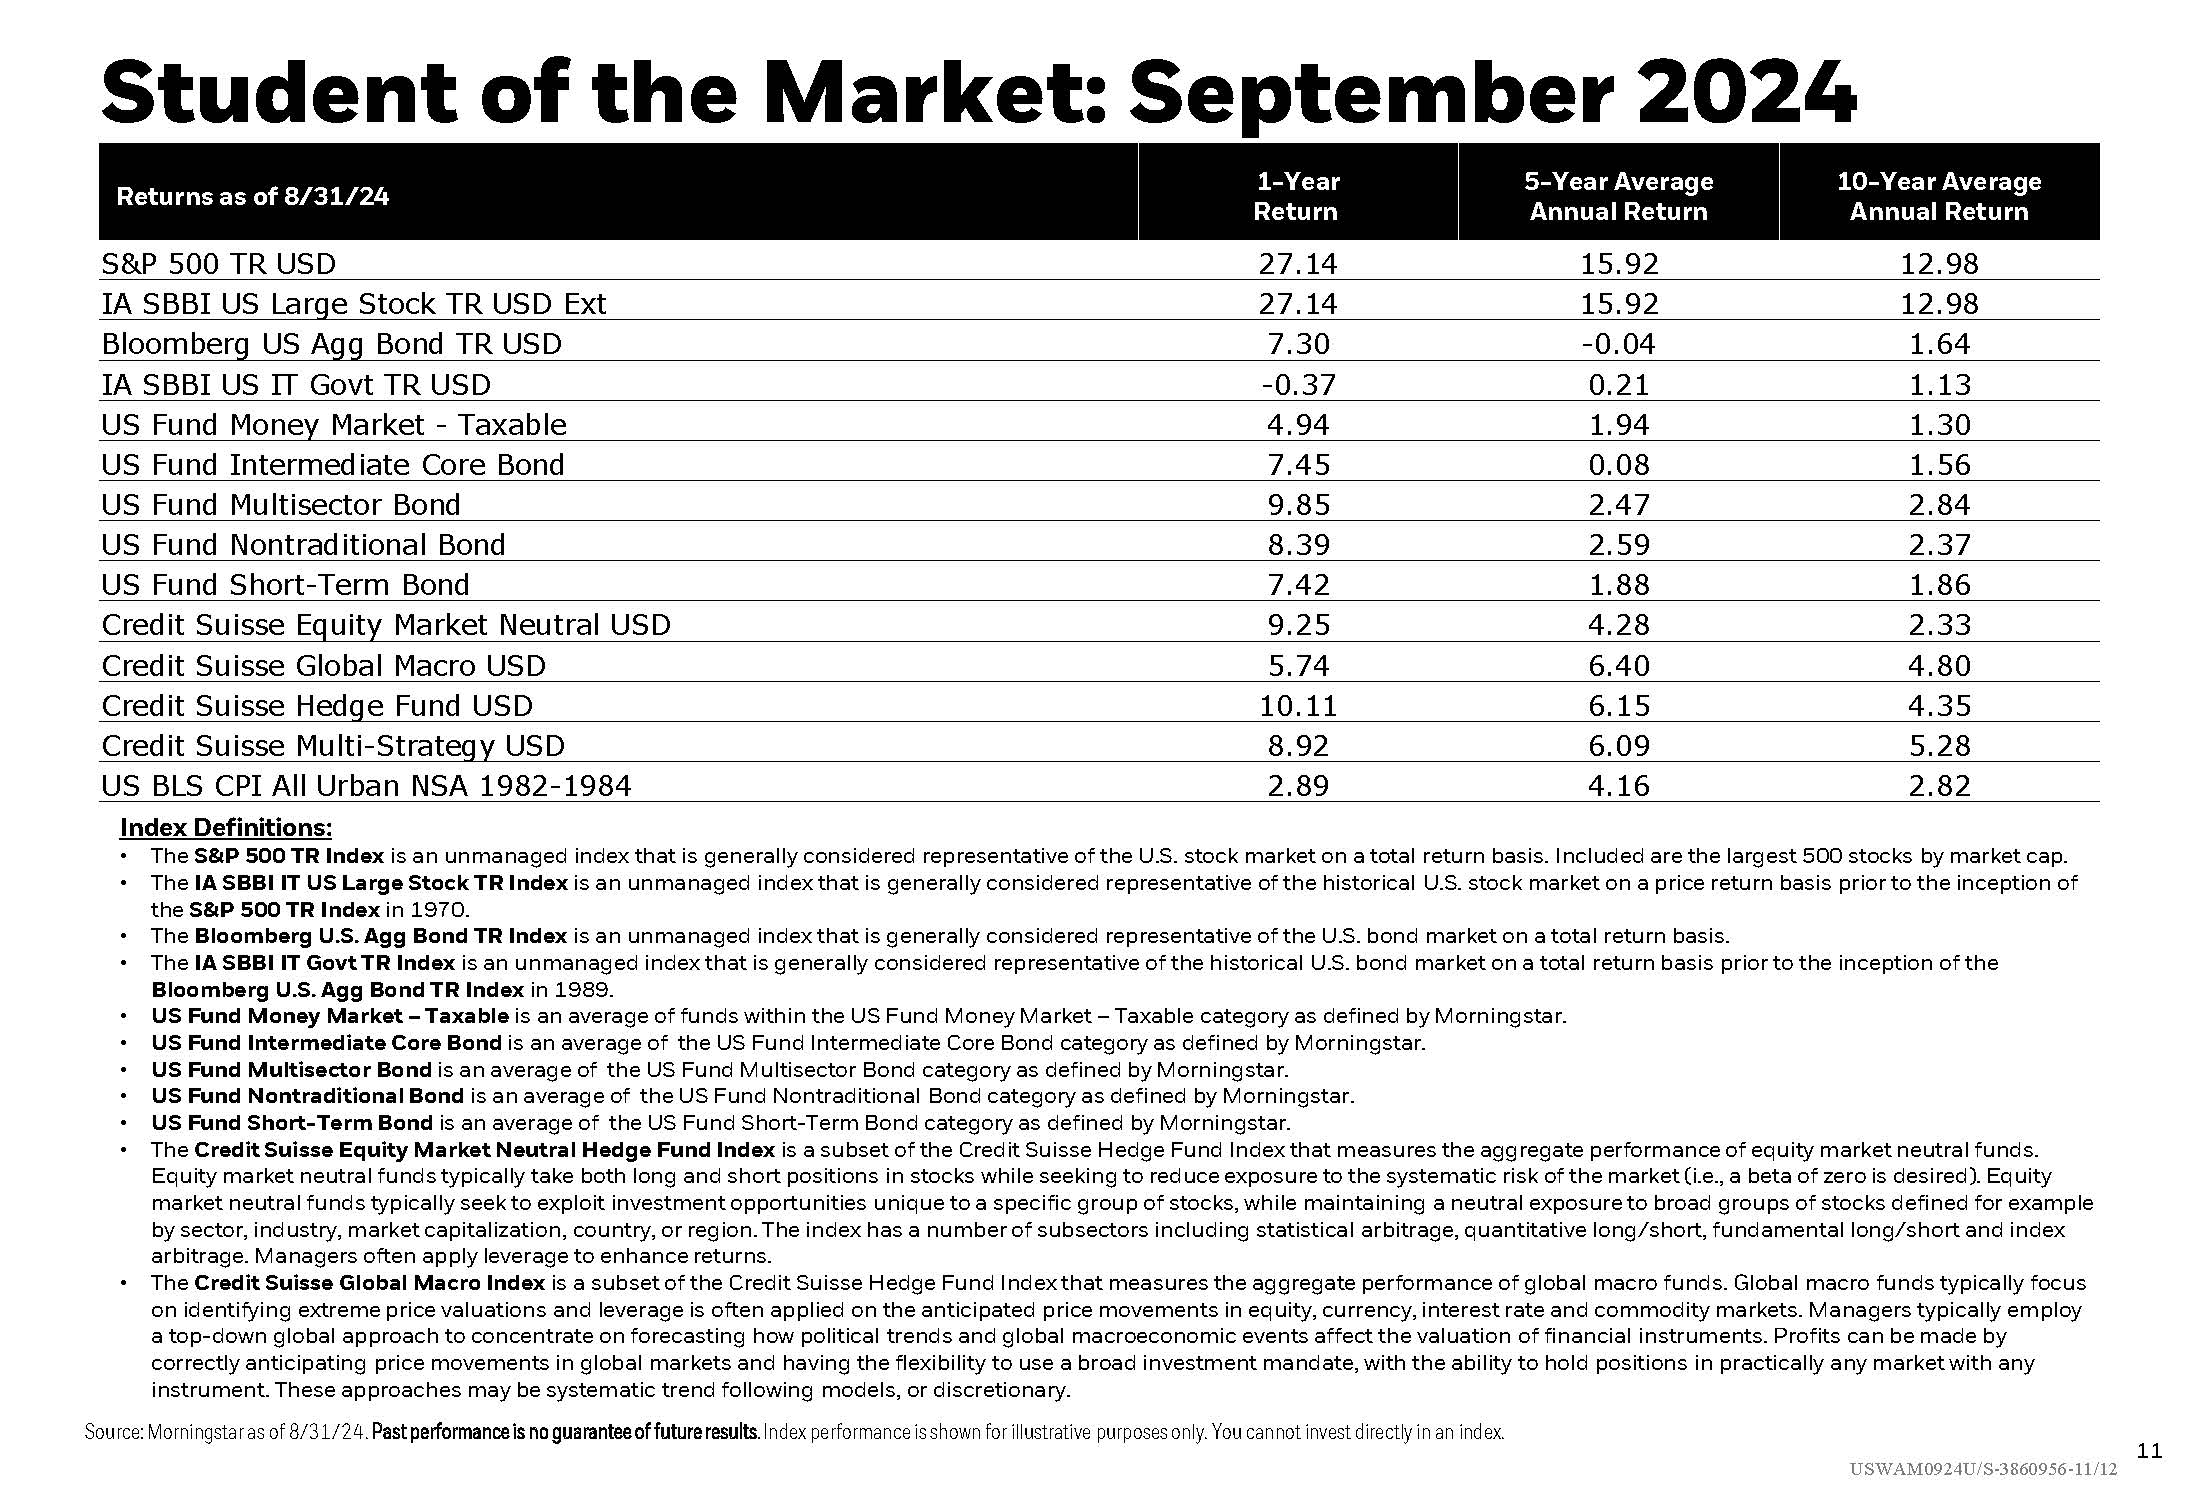
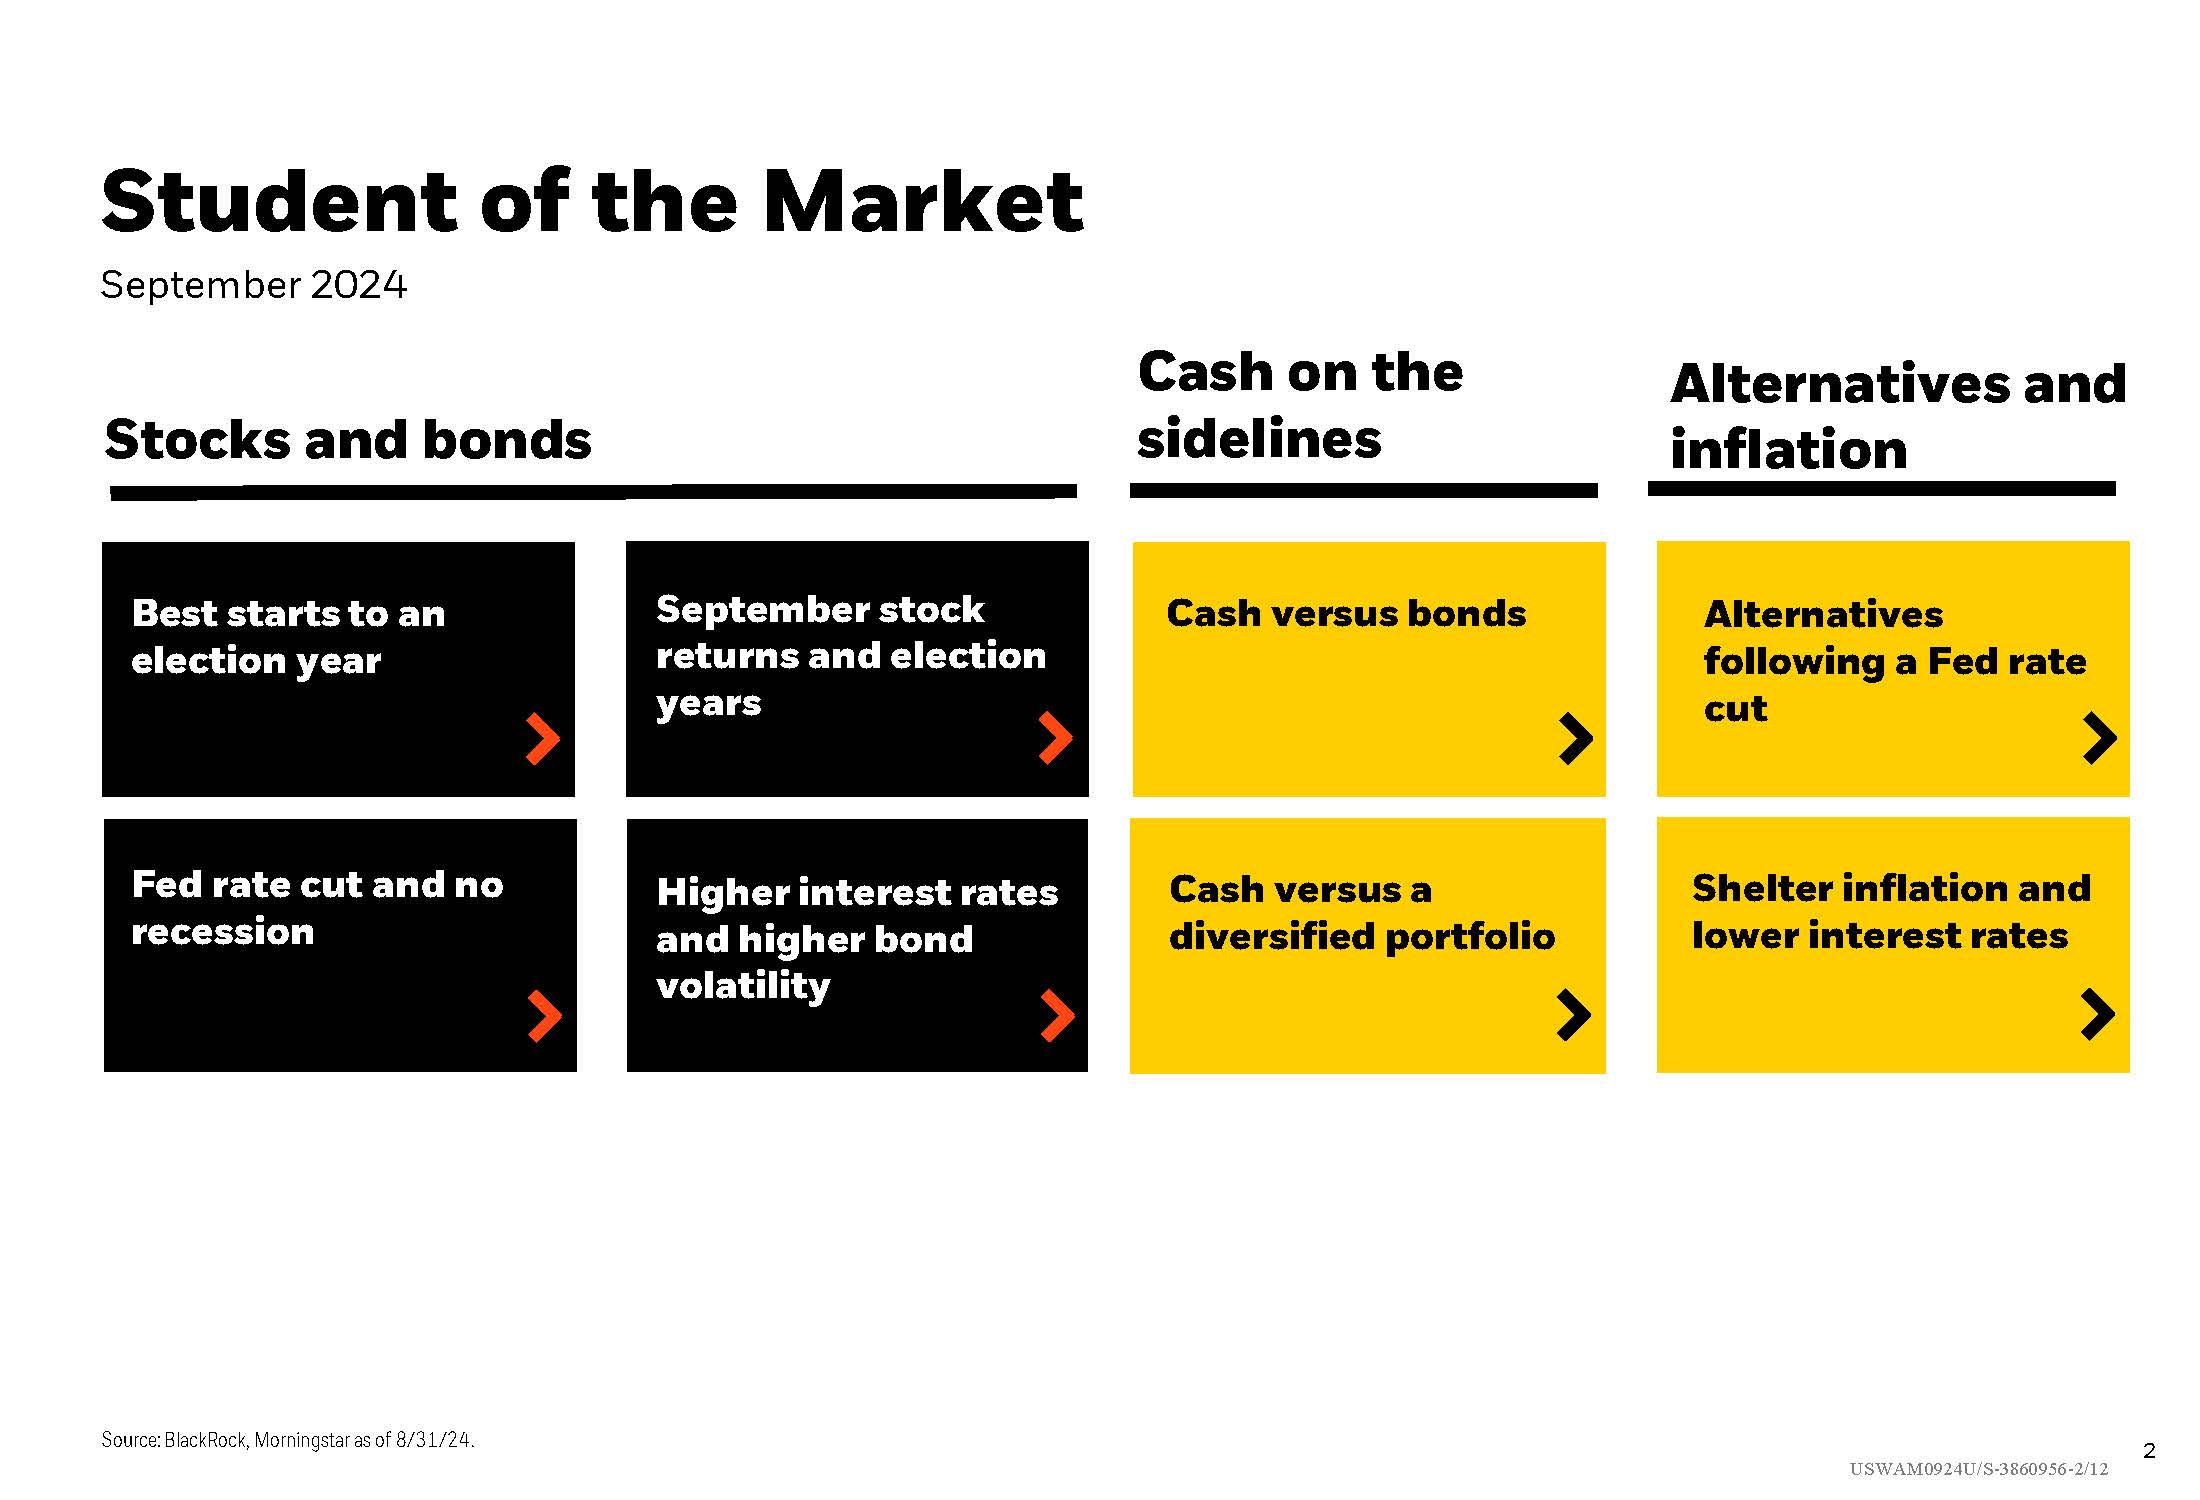
Looking at average starts in U.S. Stocks in an election year, this Student of the Market looks at historical data on how the best starts carry into the rest of the year. Big swings in interest rates are examined in bond returns and compared with money market funds. And stats to indicate a normalization in the yield curve.

September 24, 2024
Important Disclosure: Content on our website and in our newsletters is for informational purposes only. The information provided may (or may not) directly apply to your situation. We recommend that readers work directly with a professional advisor when making decisions in the context of their specific situation.

Other content you may like

  • The 8th Best August Stock Performance since 1926

    September 7, 2020
    This special report looks at the historical market returns in the context of presidential elections, which parties are in control of Congress, and various government election outcomes. While nobody can predict the future, and past results don't guarantee future outcomes, this report gives some insights as to what the financial landscape might look like after the 2020 elections.
    Read this Article
  • Parents and grandparents celebrating a girl's 5th birthday.

    The Sandwich Generation

    February 13, 2026
    Are you part of the “sandwich generation?” Are you squeezed with competing pressures of caring for aging parents, raising kids, and trying to save for retirement, all at the same time? There are strategies that can help to balance these responsibilities. Take a look!
    Read this Article
  • AUG Student of the Market

    So Goes July, So Goes the Rest of the Year?

    August 23, 2022
    With a good Market showing in July, what are the historical trends for the 6 months following? Now throw in mid-term elections and this month’s overview of market performance gets very interesting. Also included are past trends for stock performance during recessions and a quick look at a couple of inverted yield curves.
    Read this Article
  • The link you have selected is located on another server. The linked site contains information that has been created, published, maintained, or otherwise posted by institutions or organizations independent of this organization. We do not endorse, approve, certify, or control any linked websites, their sponsors, or any of their policies, activities, products, or services. We do not assume responsibility for the accuracy, completeness, or timeliness of the information contained therein. Visitors to any linked websites should not use or rely on the information contained therein until they have consulted with an independent financial professional. Please click “Continue to Link” to leave this website and proceed to the selected site.
    phone-handset