Call Our Office
(559) 384-2900 | Fresno
(619) 480-1413 | San Diego
(619) 480-1413 | San Diego
Your Money
Your Life
Your Way
You are now leaving the Strong Valley Wealth & Pension, LLC ("Strong Valley") website. By clicking on the "Schwab Alliance Access" link below you will be entering the Charles Schwab & Co., Inc. (“Schwab”) Website. Schwab is a registered broker-dealer, and is not affiliated with Strong Valley or any advisor(s) whose name(s) appears on this Website. Strong Valley is/are independently owned and operated. Schwab neither endorses nor recommends Strong Valley. Regardless of any referral or recommendation, Schwab does not endorse or recommend the investment strategy of any advisor. Schwab has agreements with Strong Valley under which Schwab provides Strong Valley with services related to your account. Schwab does not review the Strong Valley website(s), and makes no representation regarding the content of the Website(s). The information contained in the Strong Valley website should not be considered to be either a recommendation by Schwab or a solicitation of any offer to purchase or sell any securities.
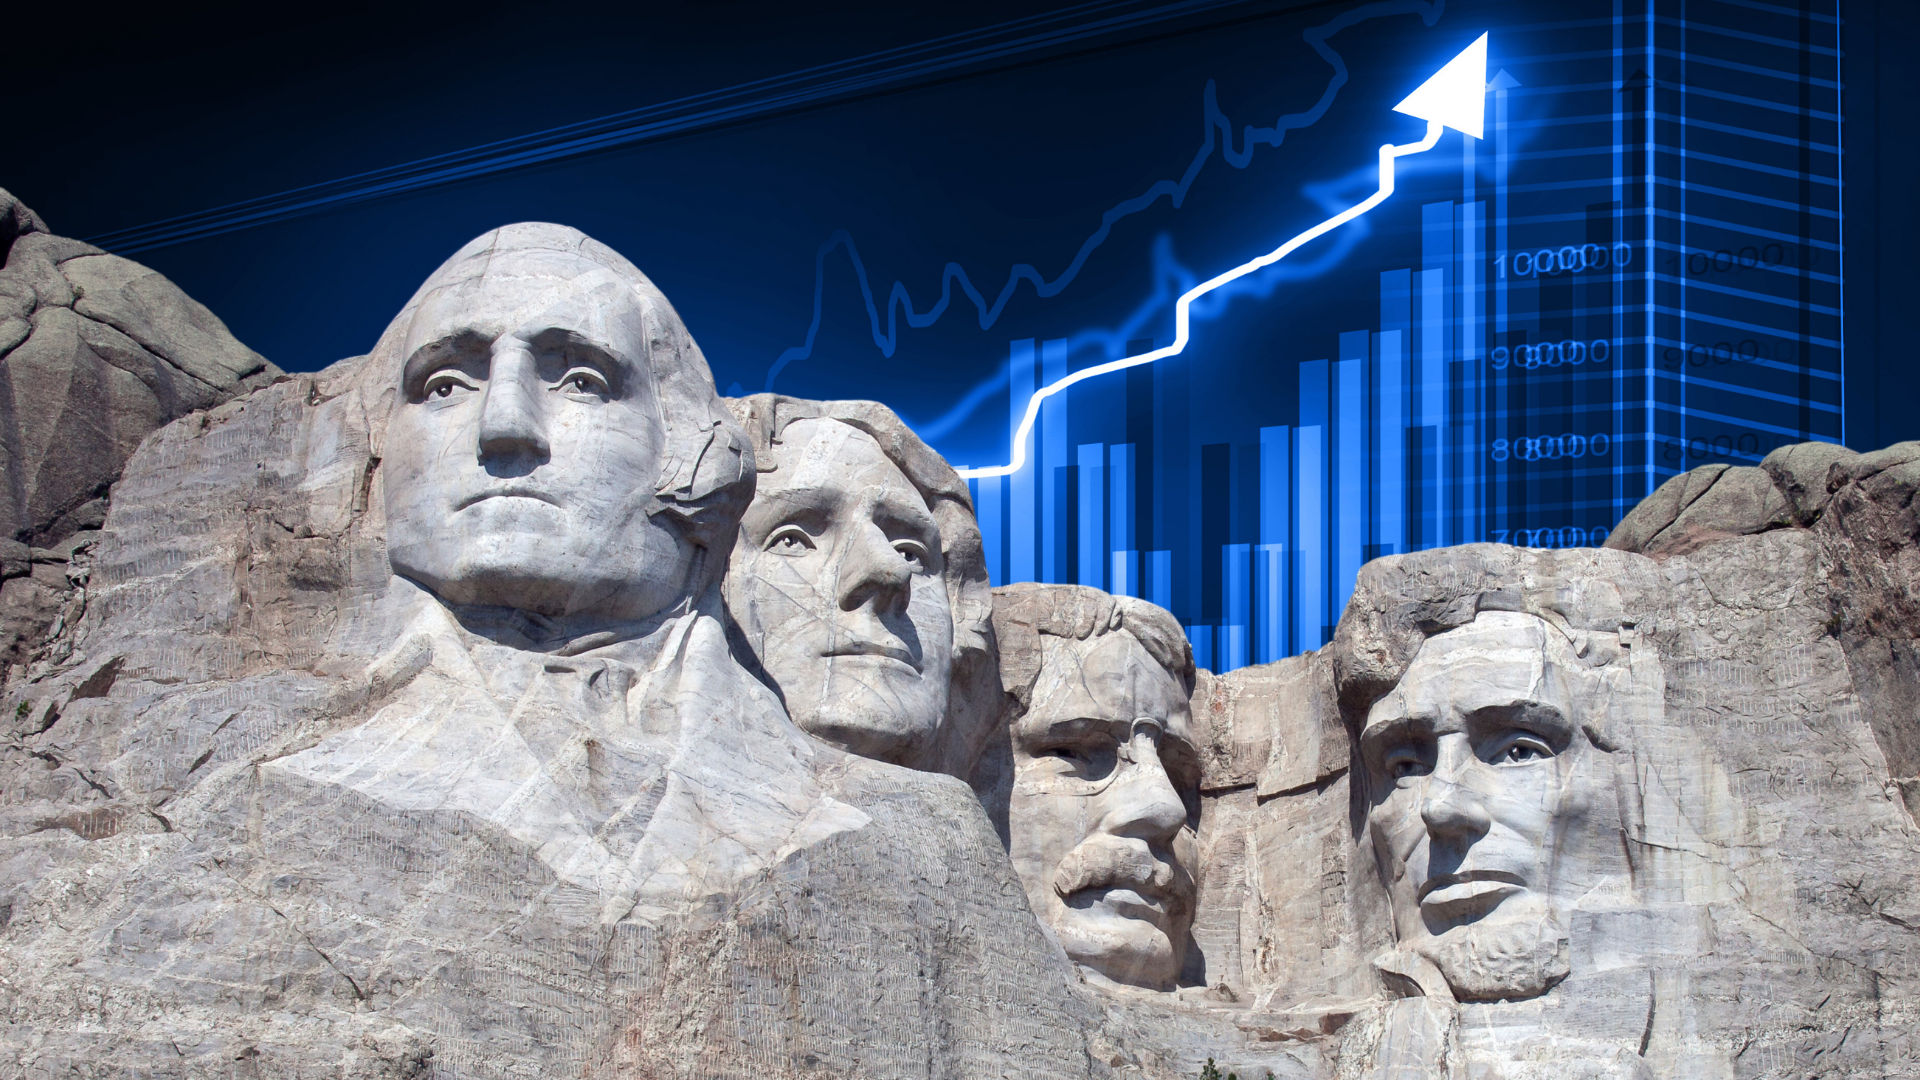
Every four years, Washington D.C. and Wall Street converge as Americans elect a president and Wall Street tries to figure out what the outcome means for the stock and bond markets. And since so many hypotheses on this topic abound, it’s hard to keep track of them all. In Part III of this series – a new ranking that will include a few presidents you likely know much more about. Including a peanut-farmer turned president.
Every four years, Washington D.C. and Wall Street converge as Americans elect a president and Wall Street tries to figure out what the outcome means for the stock and bond markets. And since so many hypotheses on this topic abound, it’s hard to keep track of them all.
For example, there are those who swear that Wall Street performs better when:
But what if we ranked the best and worst presidents simply by the performance of the stock market? Surely that would settle the debate as to which president was best for investors, right? Well, while it sounds easy – and the editors at Kiplinger did rank presidents from worst to best according to the stock market – there are a few big caveats to consider.
Caveat #1: Since the Office of the President was established in 1789, America has had 44 different presidents. And just three years later, Wall Street was officially founded on May 17, 1792 with the signing of the Buttonwood Agreement. But for the most part, there really was no “stock market” until the late 1800s, meaning it doesn’t make sense to include the first 22 presidents. So this analysis starts with the election of 1888.
Caveat #2. The Dow Jones Industrial Average was first published on May 26, 1896 and it followed the 12 largest companies in each sector. Today, it tracks 30 companies. The other very commonly-used index – the S&P 500 – although introduced in 1957 it does track data back to the late 1920s. The editors of Kiplinger decided to use the S&P 500 from President Hoover to the present and the DJIA for earlier.
Caveat #3. Returns do not include dividends. Over the last few decades, dividends have become a smaller component of total returns, so not including dividends will tend to favor more recent presidents.
Caveat #4. Data is not adjusted for inflation. This will tend to help presidents of inflationary times (Carter and Ford) and hurt presidents of deflationary times (Hoover and Bush).
Final Caveat. This one is sure to spark heated debate, but it seems fair to not include President Trump on this list simply because his presidency is still going.
Parts I and II brought us this list:
#1: President Herbert Hoover (-30.8% per year)
#2: President George W. Bush (-5.6% per year)
#3: President Grover Cleveland (-4.9% per year)
#4: President Richard Nixon (-3.9% per year)
#5: President Benjamin Harrison (-1.4% per year)
#6: President William Howard Taft (-0.1% per year)
#7: President Theodore Roosevelt (2.2% per year)
#8: President Woodrow Wilson (3.1% per year)
#9 of 22
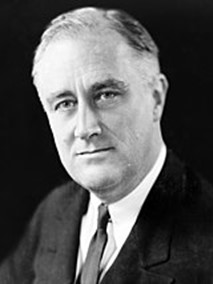
President Franklin Delano Roosevelt, Democrat
Franklin Delano Roosevelt – FDR – has the distinction of being the longest-serving president in U.S. history, having been elected to four consecutive terms, although he only served a little more than 12 years before dying in office.
Roosevelt took office in the middle of the Great Depression and within 100 days he helped push through massive federal legislation that kicked off the New Deal, which were federal programs designed to provide Americans help from the worst economic period in our country’s history.
Roosevelt is credited with speaking directly to all Americans with his “fire-side chat” radio addresses and he was also the first president on television. He spearheaded numerous programs for the unemployed, assisted farmers and helped bring an end to Prohibition. Other major programs implemented under Roosevelt include the Securities and Exchange Commission, the National Labor Relations Act, the Federal Deposit Insurance Corporation and Social Security.
While the U.S. economy improved significantly in the first 3 years after the Great Depression, a deep recession engulfed the country in 1937 and 1938, which explains the 6.2% per year performance.
#10 of 22
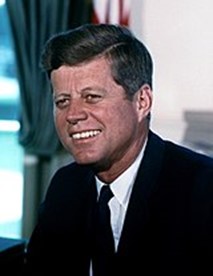
President John F. Kennedy, Democrat
John F. Kennedy – JFK – tragically did not finish his term as he was assassinated less than three years into his presidency.
Best known for presiding over the establishment of the Peace Corps, his handling of the Cuban Missile Crisis, and inspiring Americans to fly to the moon, economic historians recall Kennedy advocating that lower personal and corporate income taxes would stimulate more overall economic activity – a notion coined the “Laffer Curve” and later adopted during President Reagan’s time in office.
Kennedy did preside over a brief, 6-month bear market from December 1961 to June 1962 that saw the S&P 500 lose 28%, otherwise the 6.5% per year returns would have been higher.
#11 of 22
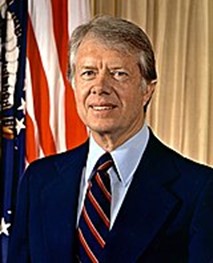
President Jimmy Carter, Democrat
President Carter is probably best known for what he did before and after he was president, as his “peanut farmer” label before becoming president and his heroic human rights work post-presidency are well documented. Often regarded as one of the smartest presidents of all time, the economic conditions of his presidency were besieged by low growth and high inflation, hardly great ingredients for out-sized stock market returns.
During Carter’s term in office, he did preside over the launch of the Department of Energy and the Department of Education, but the last few years of his single-term presidency were marked by the Iran hostage crisis and the 1979 Energy Crisis.
#12 of 22
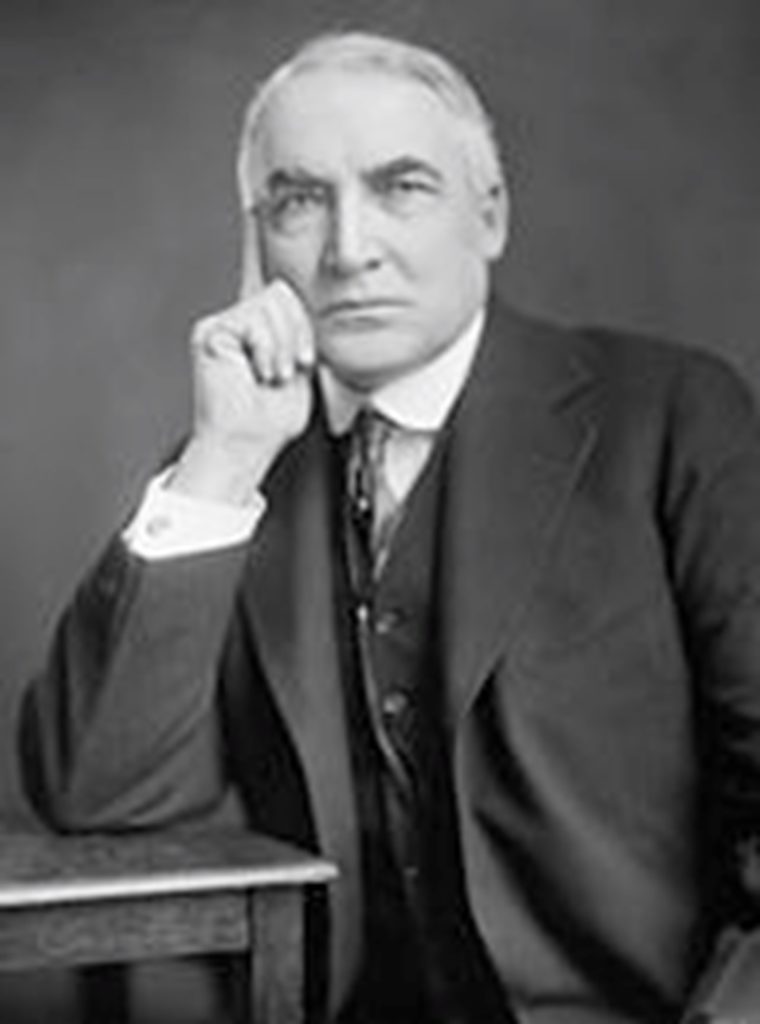
President Warren G. Harding, Republican
At the time of his presidency, Harding was very popular, but after his death, his administration’s scandals came to light, including the Teapot Dome bribery scandal, considered one of the biggest political scandals of all time. Subsequently, historians now generally consider Harding to be one of the worst presidents of all time.
When Harding took office in 1921, the country was in the midst of a postwar economic decline and Harding’s plan was to reduce income taxes, increase tariffs to protect American farmers and support the build-out of America’s highway system.
Harding died about half-way through his term from a heart attack and it was only after his passing that various scandals became known. But despite the scandals and being considered one of the worst presidents, as measured by stock market performance, Harding’s presidency was just about in the middle.
Next week will bring Part IV and the list will include a couple of recent presidents that you know much more about as well as the beginning of presidencies recording double-digit annual stock market returns.