Call Our Office
CA | (559) 384-2900
TN | (931) 299-7002
Your Money
Your Life
Your Way
You are now leaving the Strong Valley Wealth & Pension, LLC ("Strong Valley") website. By clicking on the "Schwab Alliance Access" link below you will be entering the Charles Schwab & Co., Inc. (“Schwab”) Website. Schwab is a registered broker-dealer, and is not affiliated with Strong Valley or any advisor(s) whose name(s) appears on this Website. Strong Valley is/are independently owned and operated. Schwab neither endorses nor recommends Strong Valley. Regardless of any referral or recommendation, Schwab does not endorse or recommend the investment strategy of any advisor. Schwab has agreements with Strong Valley under which Schwab provides Strong Valley with services related to your account. Schwab does not review the Strong Valley website(s), and makes no representation regarding the content of the Website(s). The information contained in the Strong Valley website should not be considered to be either a recommendation by Schwab or a solicitation of any offer to purchase or sell any securities.
Bear markets happen. Bull markets happen. And do you think you can figure out when the market is turning – either up or down and trade accordingly? Well, before you think that you should get out of this market now and wait this bear out, here’s some things you might consider.

Bear markets happen. Bull markets happen. Just stick to your financial plan, and stay calm and disciplined. When the market sours or slumps, don’t believe talk that this time it is different. It is not.
History shows this is true. Here is a simple chart of the performance of NASDAQ for the 20-years ending March 7, 2022 (NASDAQ officially entered bear market territory on this day). This covers the decline and recovery from the last U.S. recession as well as the last bear market (the COVID-bear).
NASDAQ Over 20-Years
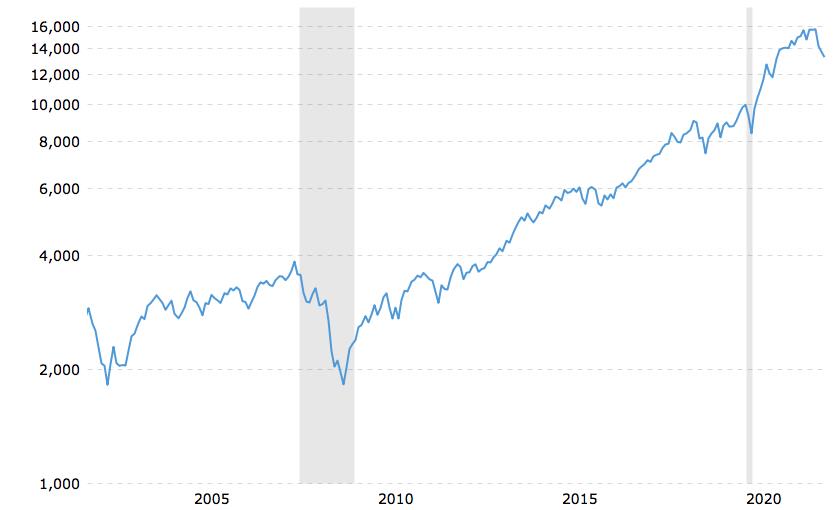
What does this chart show? When markets decline, they do so rapidly and painfully. The subsequent recovery is slow and uneven.
But it does inevitably happen. If you take the longer 20-year view of this chart, it’s clear that markets grow past previous highs after a dip.
Although the S&P 500 is not yet in a bear market, since it is “only” off 12% YTD and a bear market is defined as being off at least 20%, let’s examine historical bear markets as measured by the S&P 500.
There have been 26 bear markets and 27 bull markets in the S&P 500 Index since 1928. In addition:
Think you can figure out when the market is turning – either up or down and trade accordingly? Well, before you think that you should get out of the market now and wait this bear out, consider this:
In other words, the best way to weather a downturn could be to stay invested since it’s difficult to time the market’s recovery.
There are no investment strategies that give you the market’s ups and help you avoid the downs, save for luck. Fear and greed are irrational emotions that easily lead to bankruptcy if they influence your investment decisions.
Of course, it is hard to stay patient and hold when Wall Street analysts, investment gurus and financial TV pundits spout endless gloom and doom at the troughs and exuberant optimism at market peaks. Short-term thinking like this only guides you to do the wrong things at the wrong time.
This is why it helps to work with an advisor – someone to cool your head when irrational exuberance strikes, and convince you to stick to your plan in the face of uncertainty.
Although it can be difficult to watch your portfolio dip with the market, it’s important to keep in mind that downturns have always been a temporary part of the process.
No matter what the markets are doing, assure yourself that this time is not different.