Article

Bonds Rebound with Historic Rally

Bonds Rebound with Historic Rally

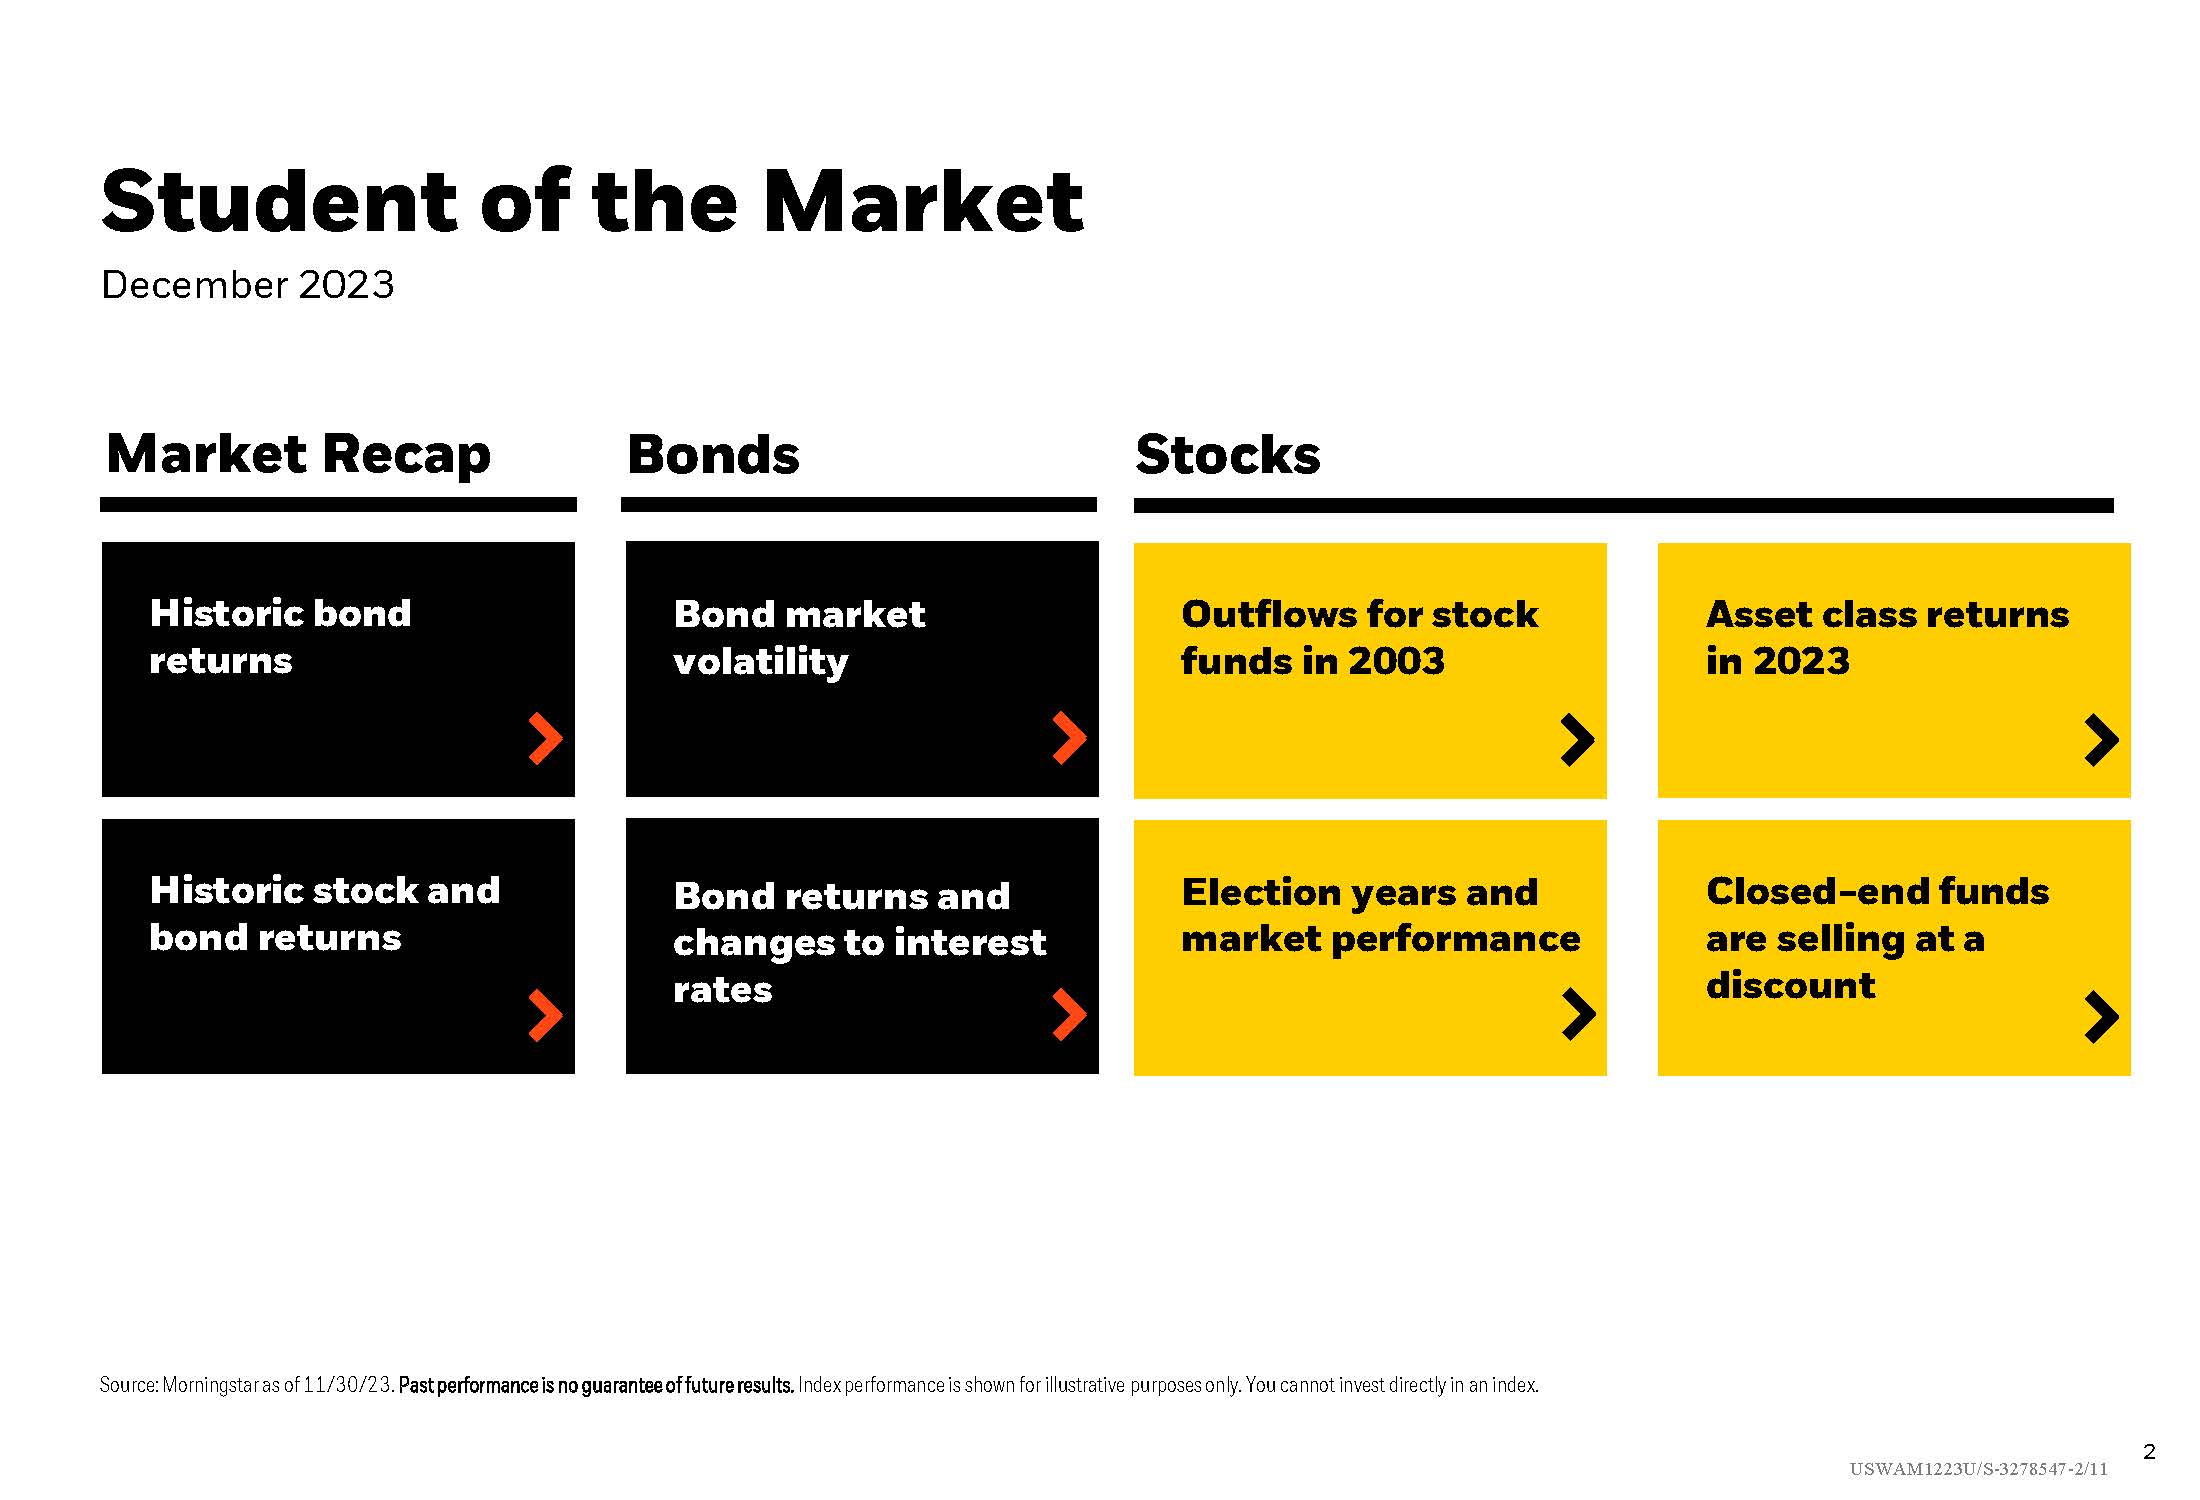
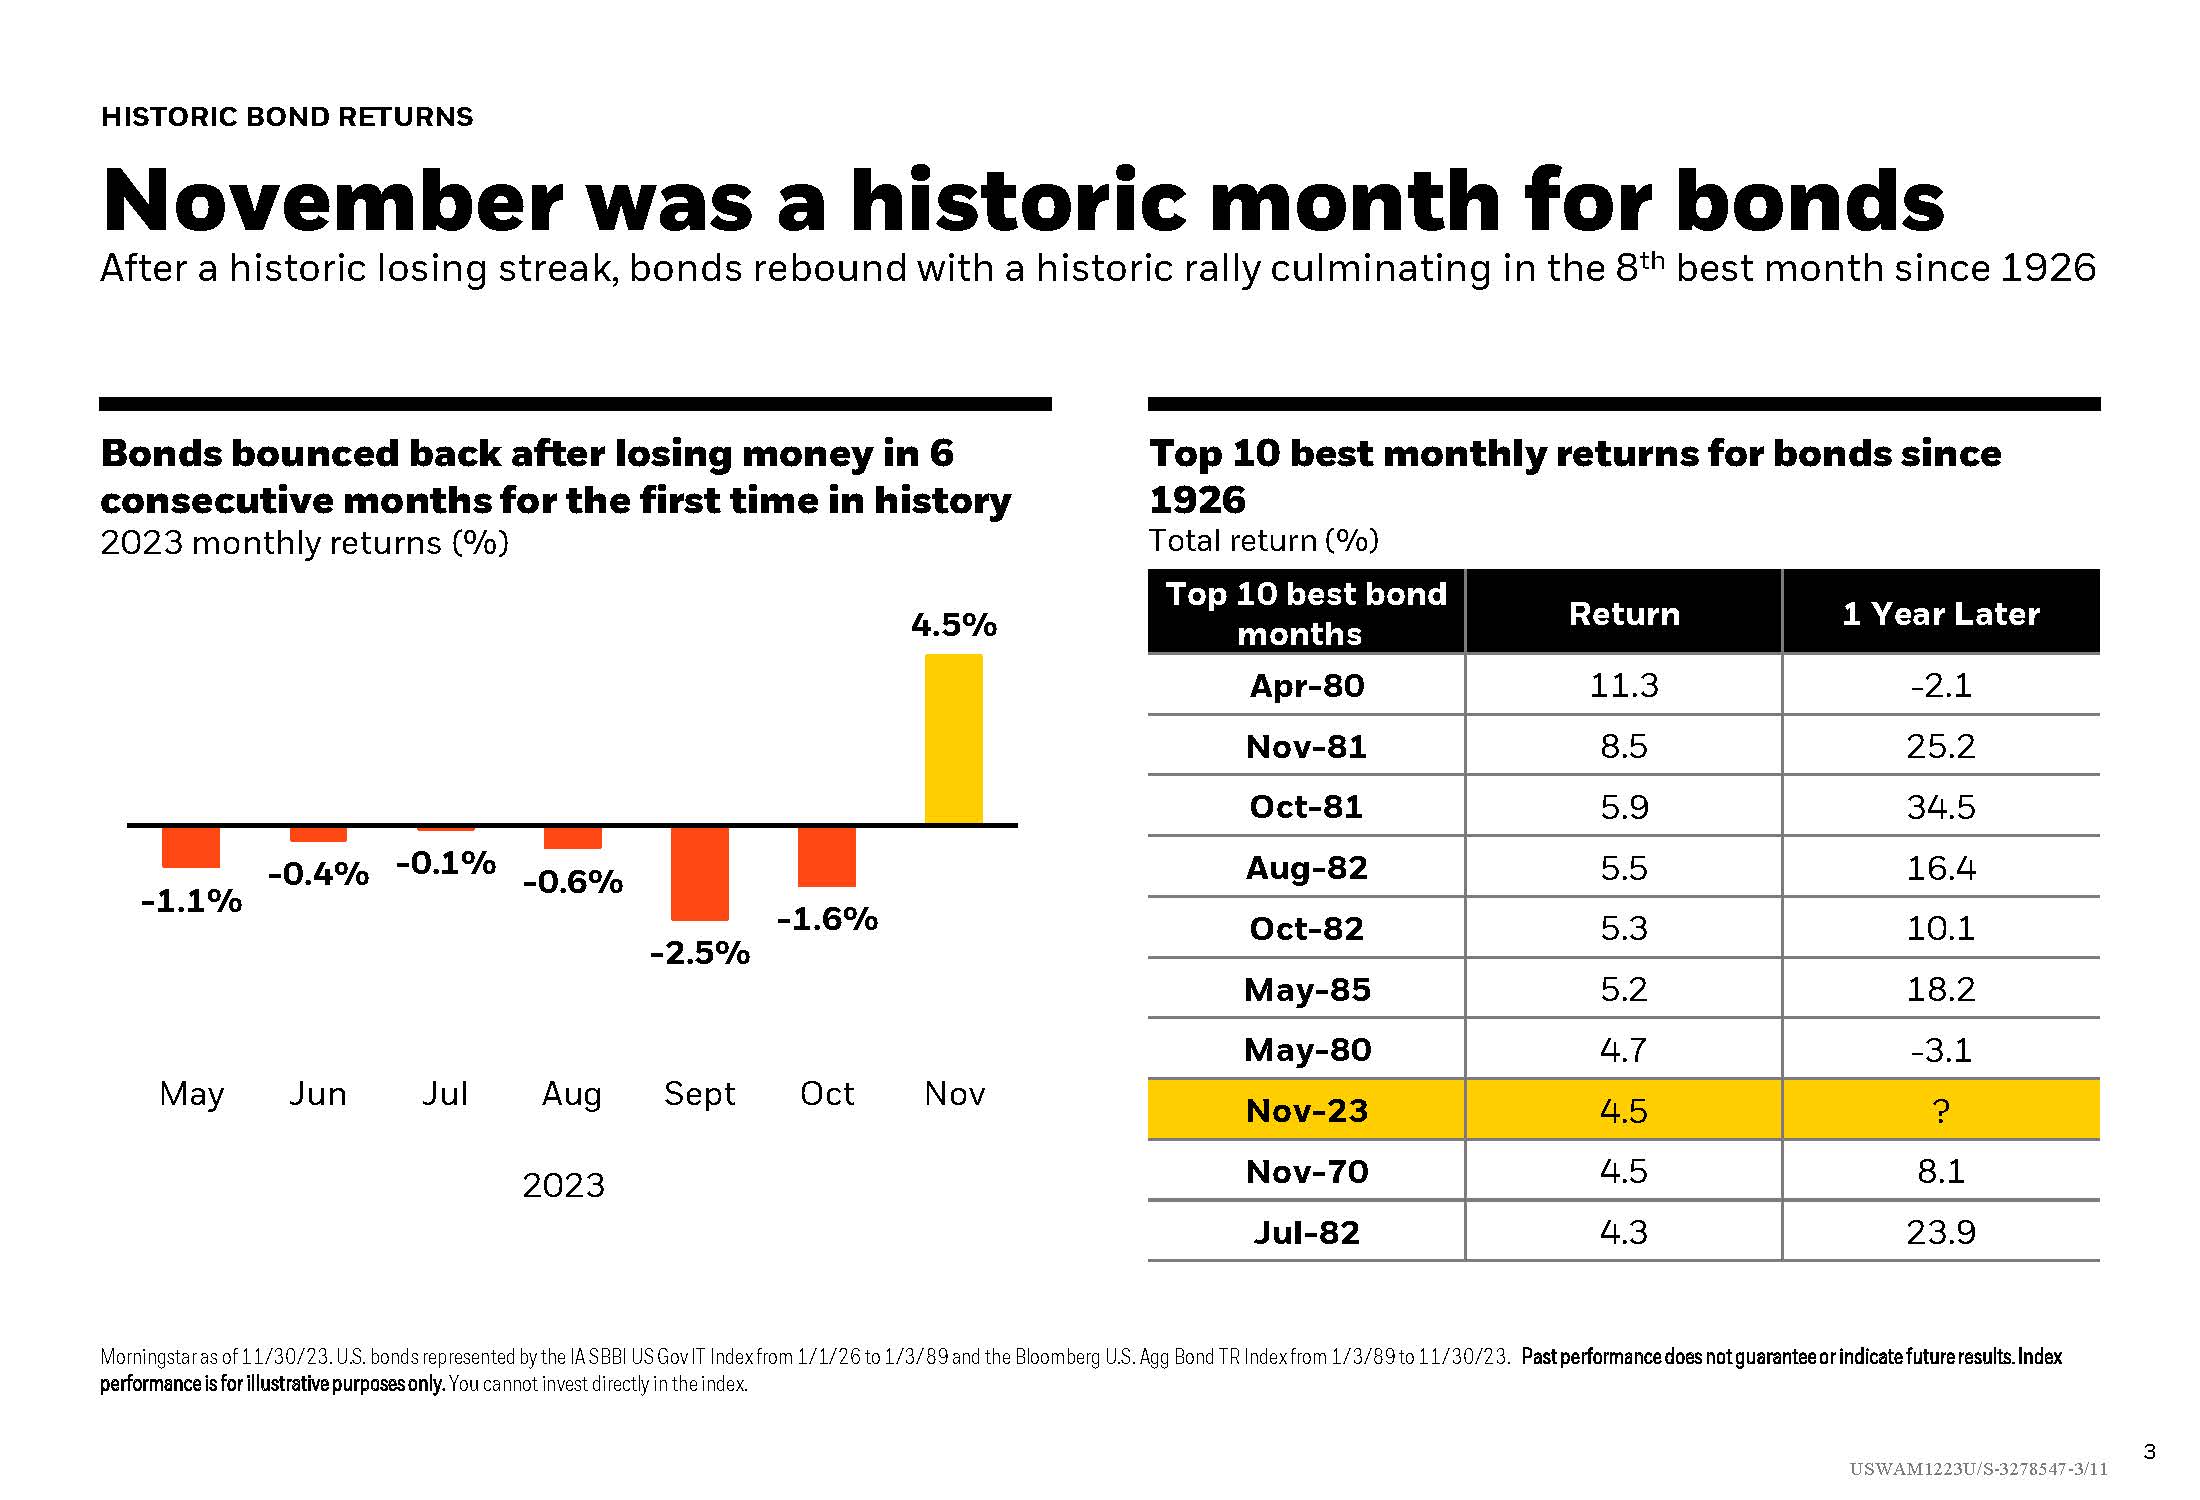
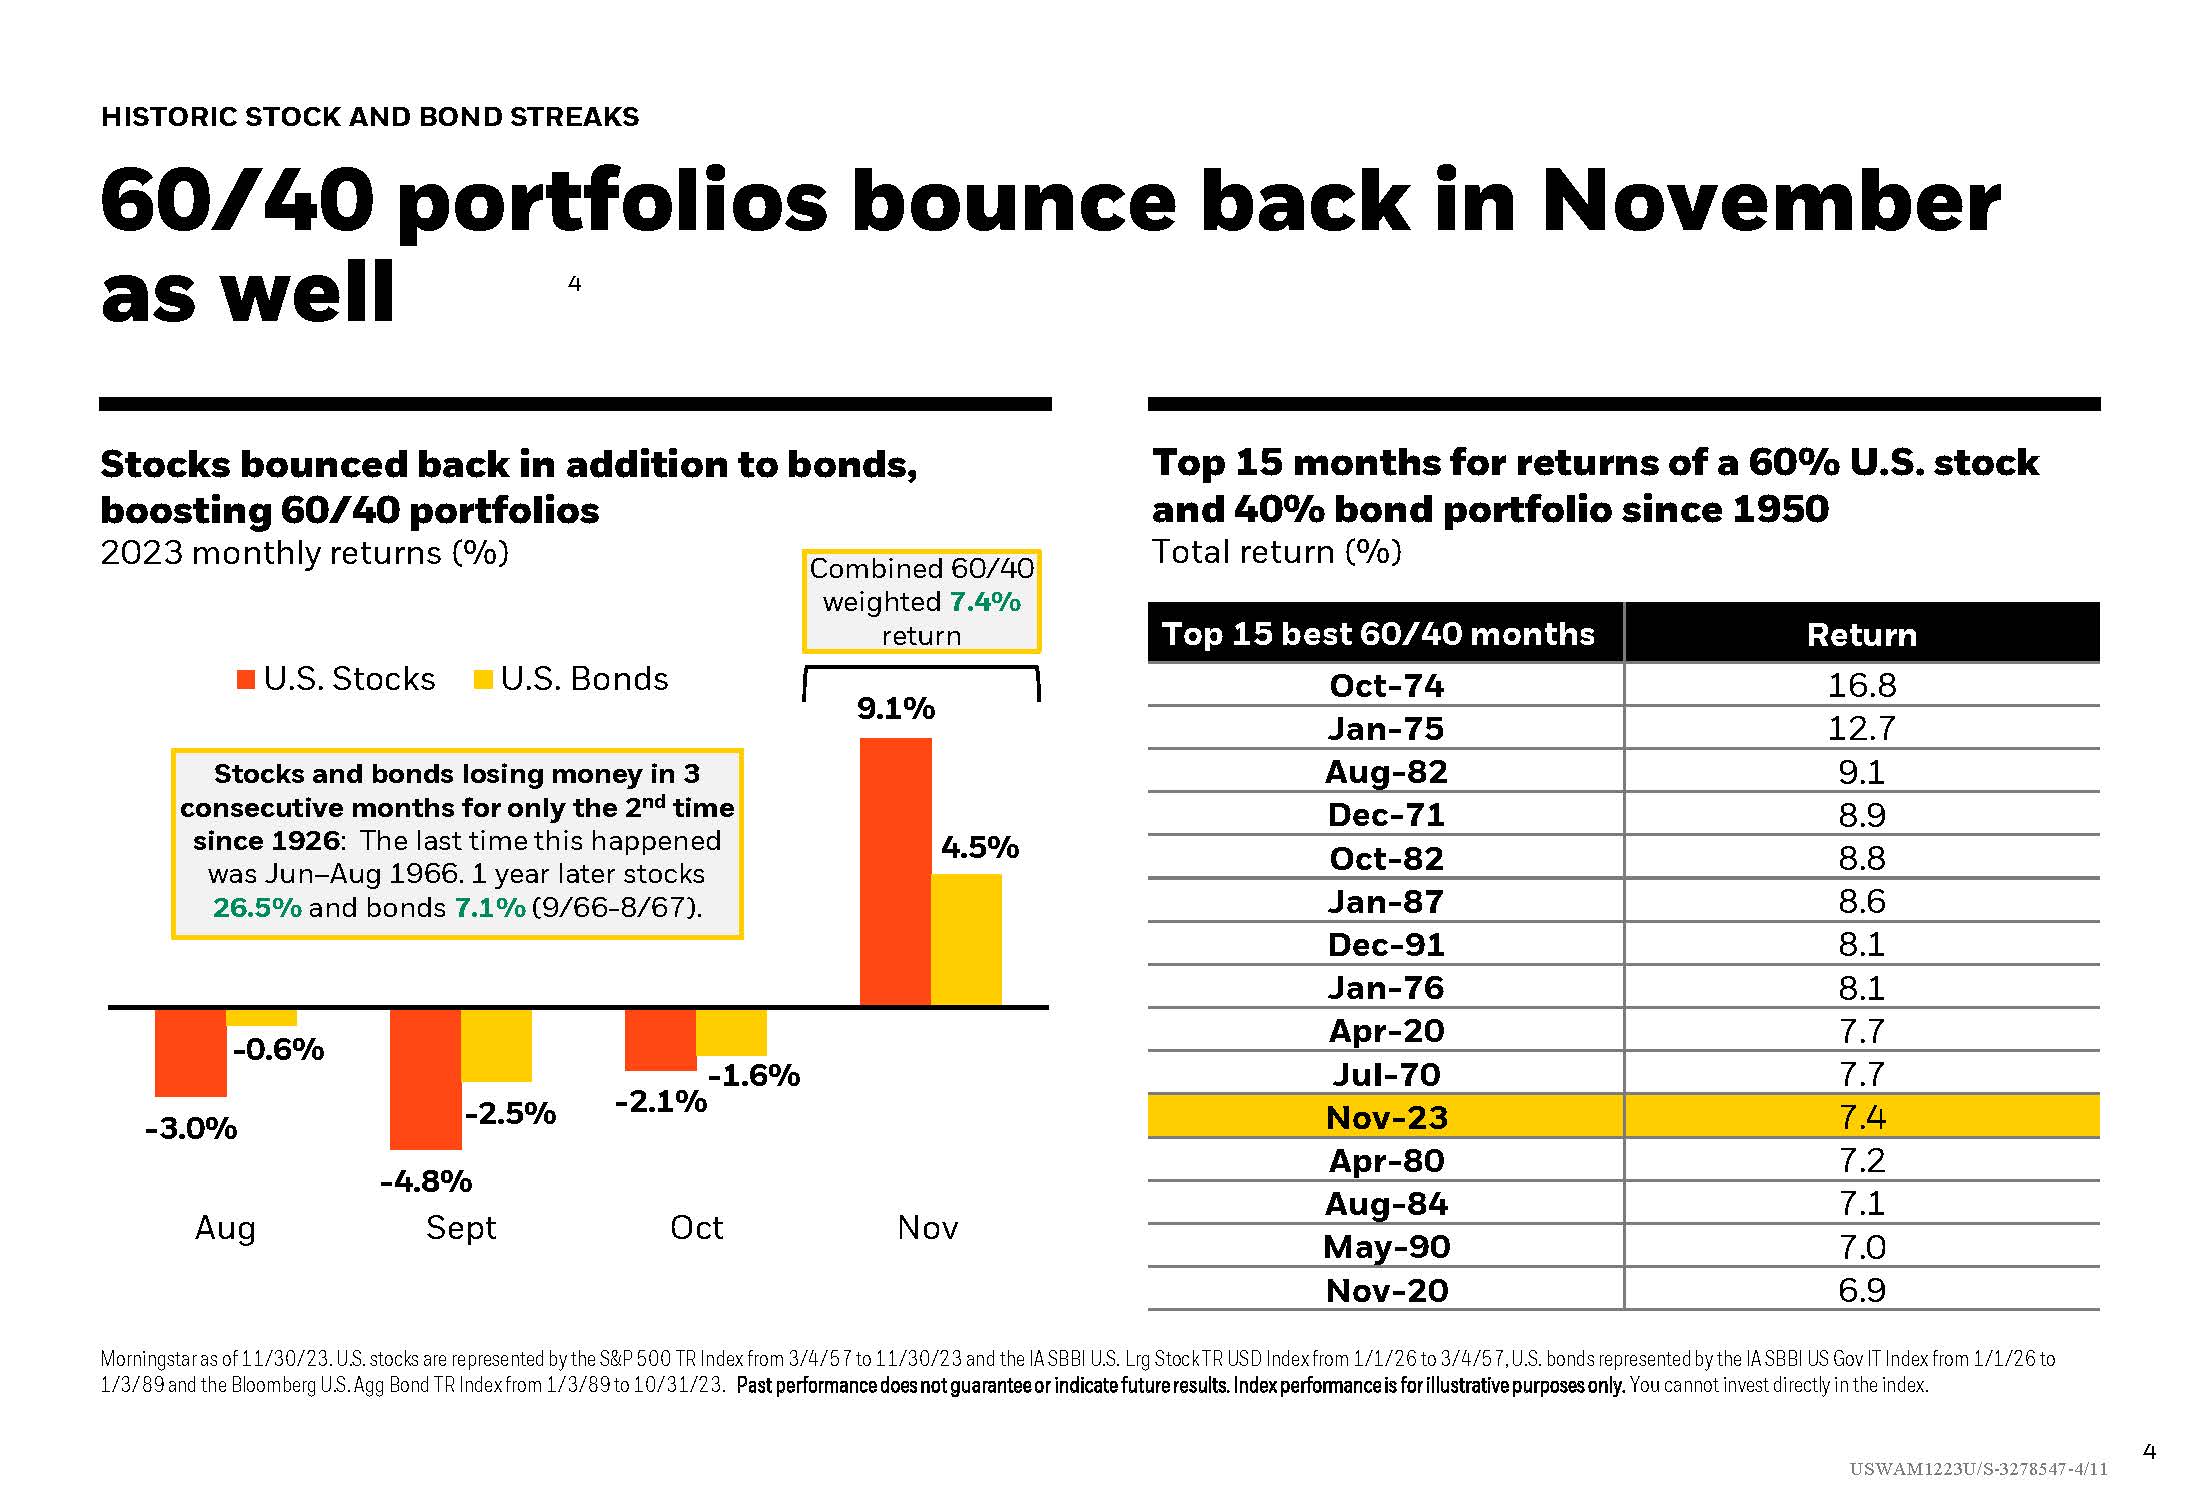
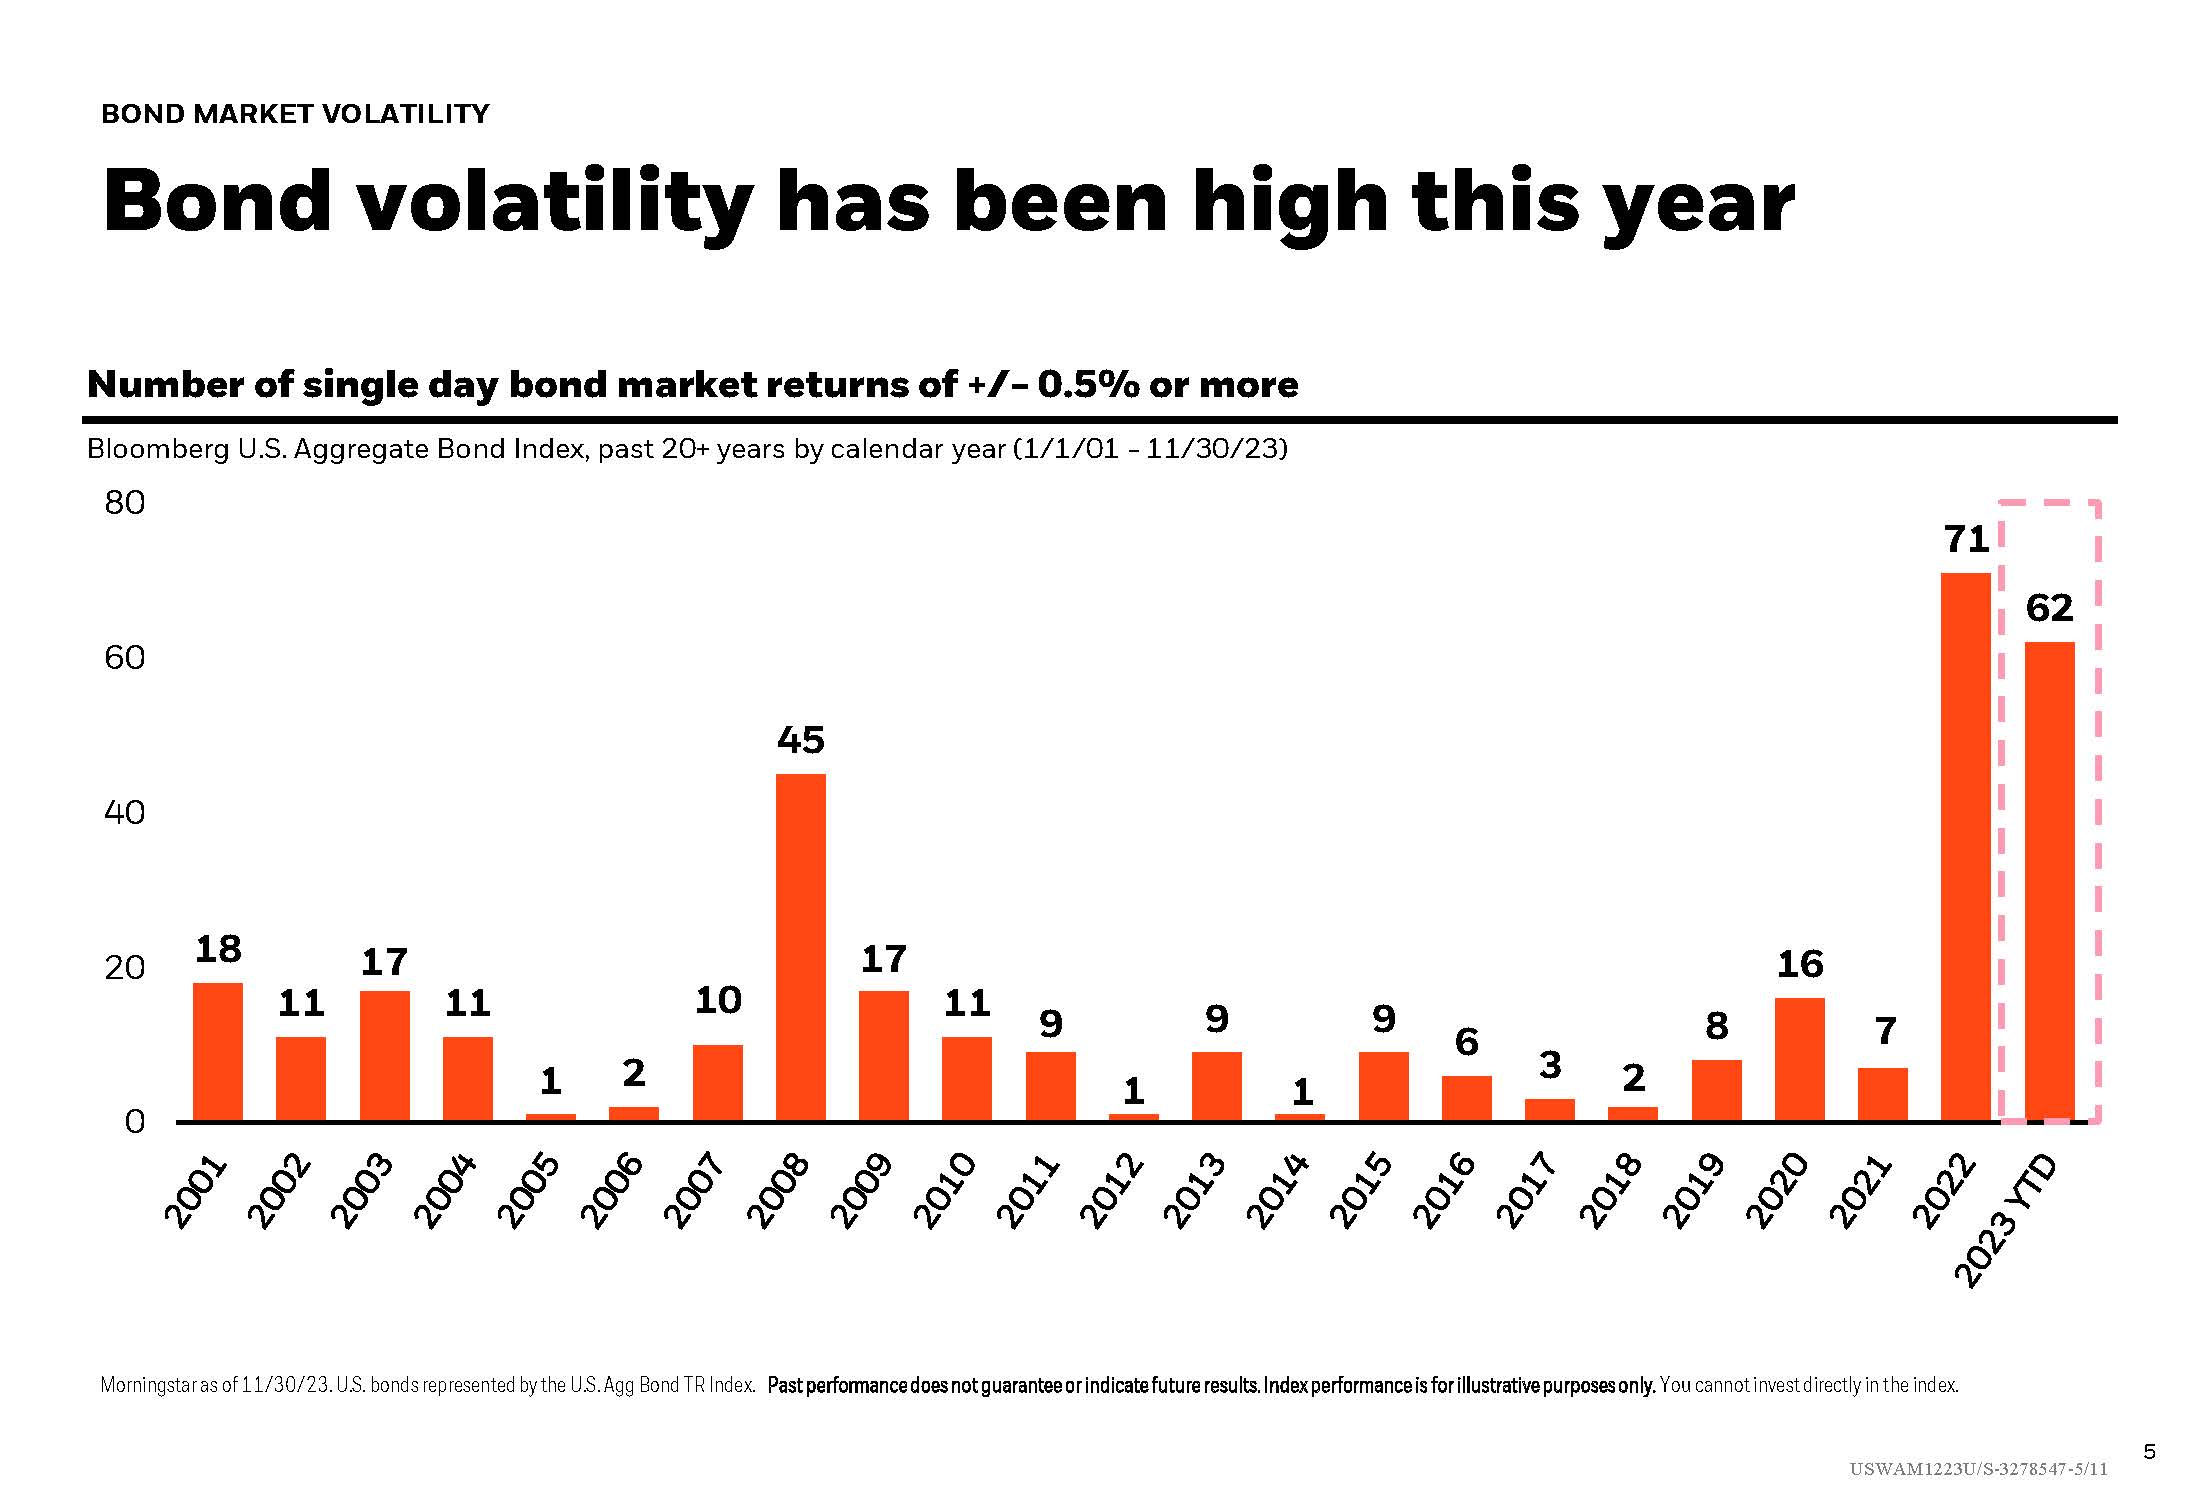
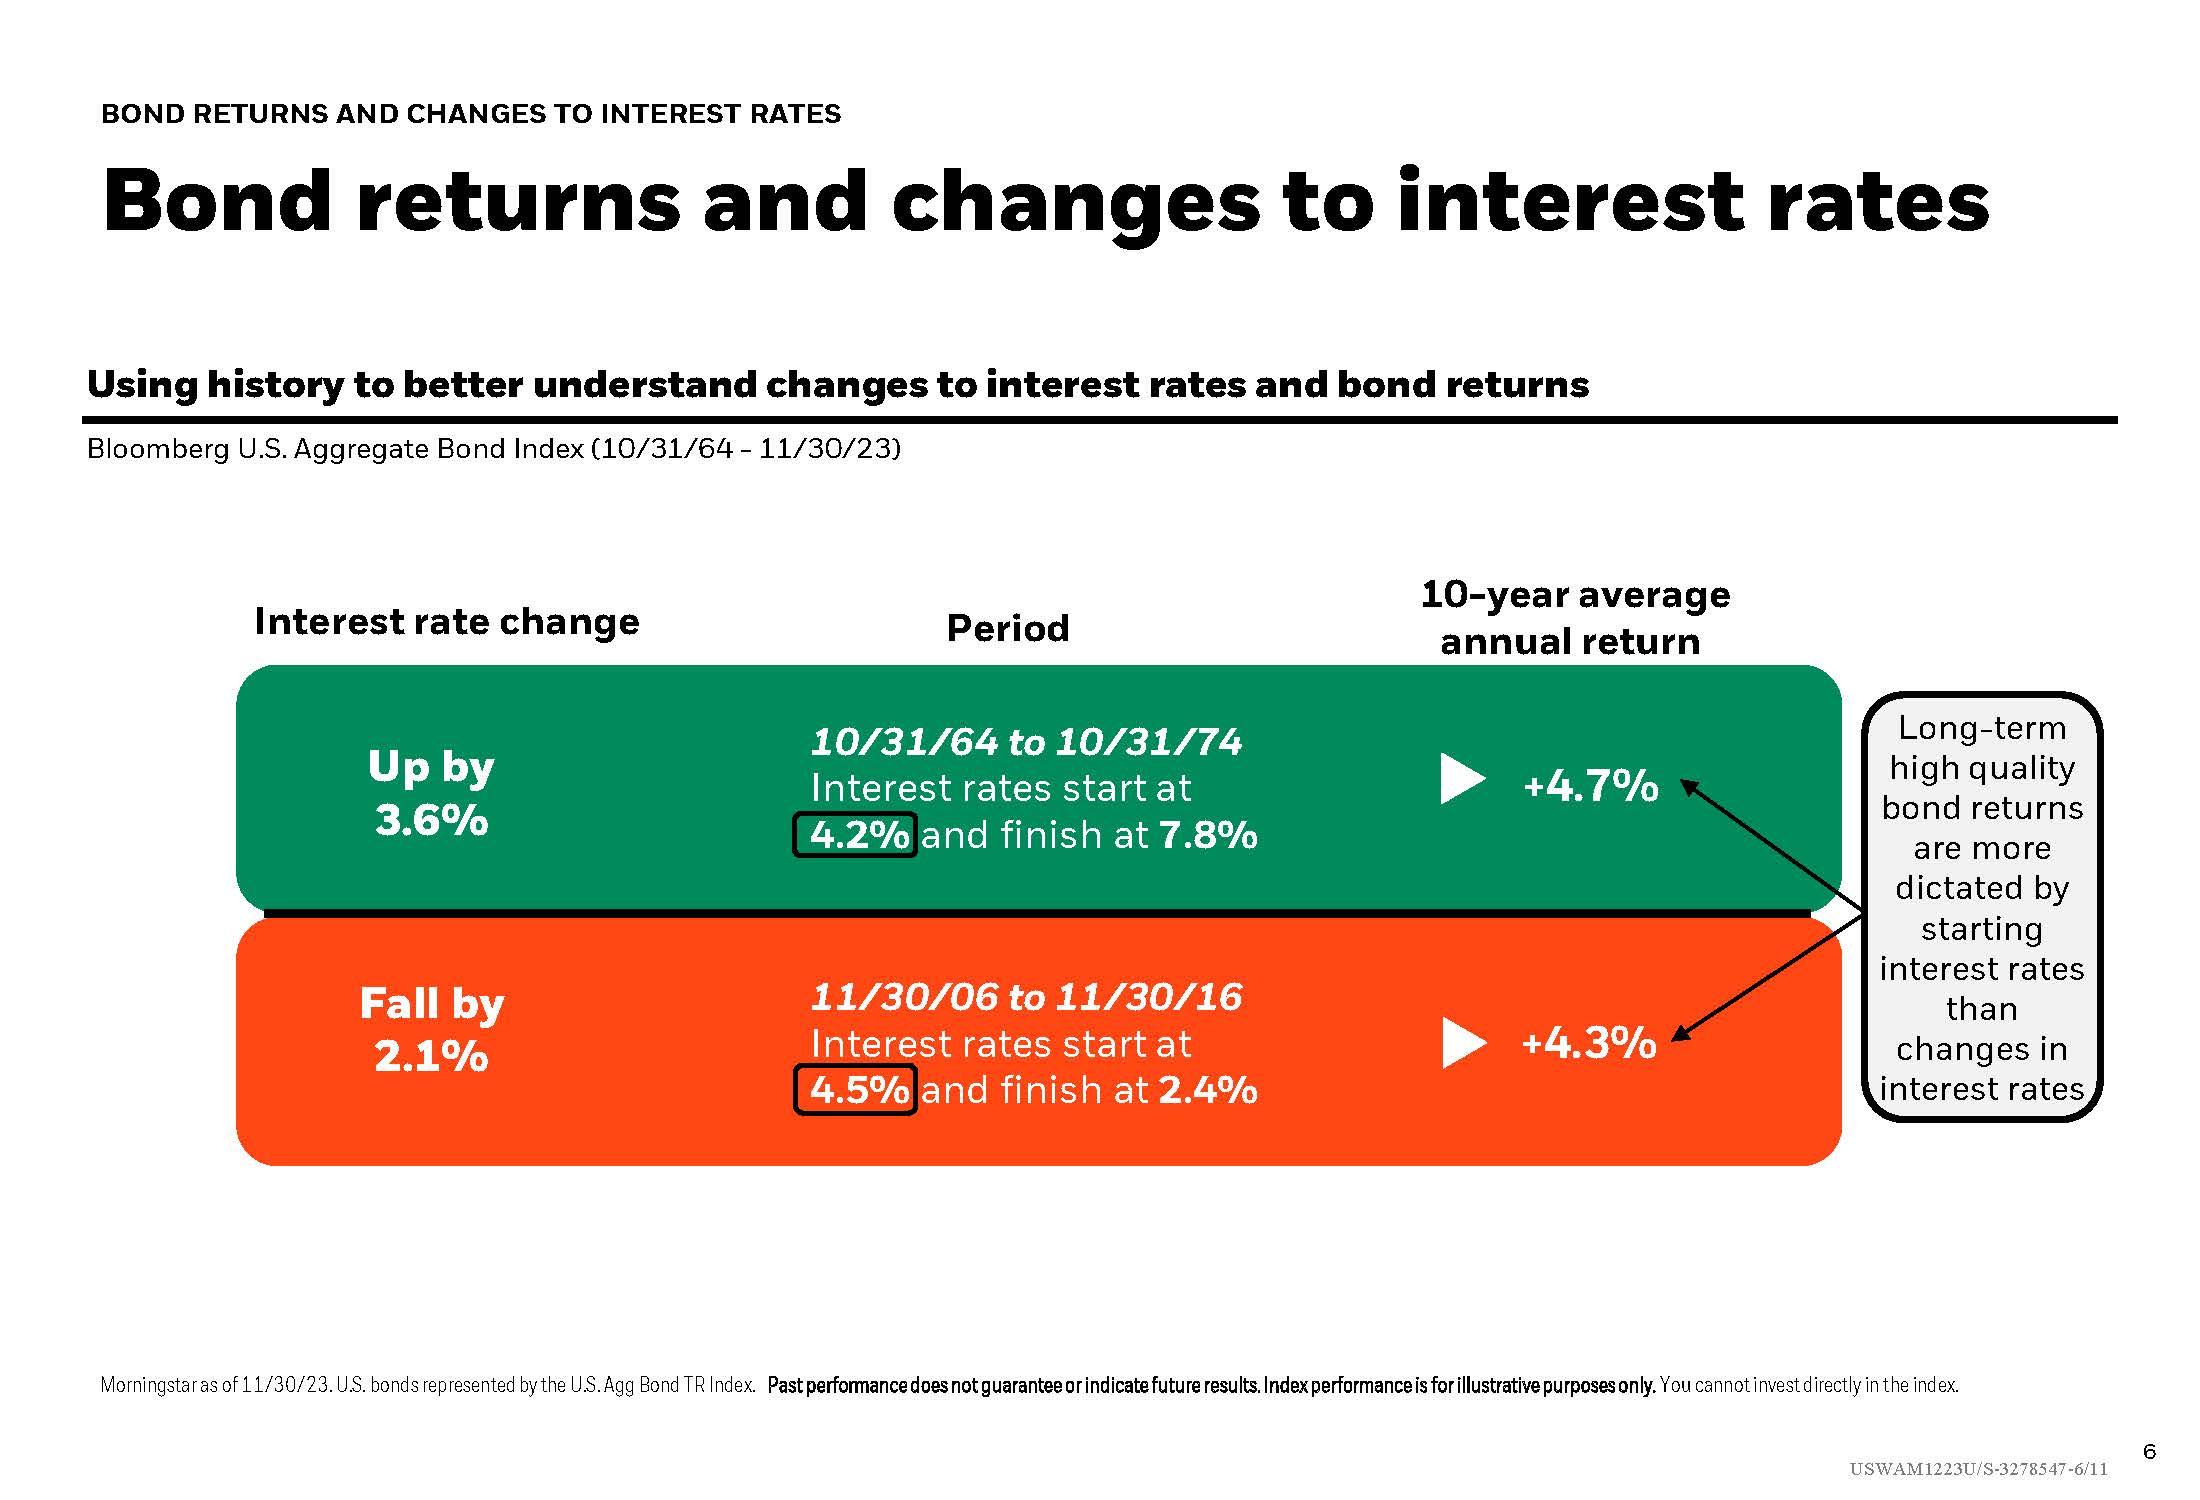
After losing money for the first time in history for 6 consecutive months, bonds make a historic rebound. Stats will show you the Top 10 best monthly returns for bonds since 1926 along with the bounce back made in 60/40 portfolios. This market overview also includes more data on the bond market and how to understand changes to interest rates and bond returns by looking at history.

January 2, 2024
Bonds Rebound with Historic Rally
Important Disclosure: Content on our website and in our newsletters is for informational purposes only. The information provided may (or may not) directly apply to your situation. We recommend that readers work directly with a professional advisor when making decisions in the context of their specific situation.

Other content you may like

  • Hurricane Ida and Homeowner's Policy

    Hurricane Ida Reminds Us to Ask if it's Covered

    September 8, 2021
    When was the last time you actually read your homeowner’s policy? Standard coverage may not cover what you assume it would. You might consider options to add to your policy, such as endorsements and riders. This article gives three nuggets to keep in mind about homeowner insurance.
    Read this Article
  • A young couple is reviewing a document, in front of their laptop, sitting at a table.

    One Big Beautiful Bill: What You Need to Know

    July 15, 2025
    Understanding the "OBBB" We keep an eye out for rules and regulations that could impact you and your family. In President Trump’s "One Big Beautiful Bill," signed into law on July 4th, there is a significant shift in U.S. fiscal policy. Understanding the provisions is crucial for making informed financial decisions both now and for […]
    Read this Article
  • Interest Rates Drifted Higher After Rate Cut

    Interest Rates Drifted Higher After Rate Cut

    December 4, 2024
    We take a look at past Fed rate cuts and how they did or did not drift higher a month later, combined with the average 12 months returns following. Also included is a chart of the ”Turkey to Tax” seasonal return period, how growth has outpaced value in a big way, U.S. stock performance across the election cycle, and more.
    Read this Article
  • Stock Volatility by Presidential Election Year

    Stock Volatility by Presidential Election Year

    February 27, 2024
    Can something be learned from studying the past? Historical data showing that stock market volatility during election years has been generally subdued unless there is a large recession, such as in ’32, ’08 and ’20. A brief look at the large swings between growth and value, stocks vs cash, data gives a glimpse of the average stock market return following January since 1926, and how the bear market was recently tamed.
    Read this Article
  • The link you have selected is located on another server. The linked site contains information that has been created, published, maintained, or otherwise posted by institutions or organizations independent of this organization. We do not endorse, approve, certify, or control any linked websites, their sponsors, or any of their policies, activities, products, or services. We do not assume responsibility for the accuracy, completeness, or timeliness of the information contained therein. Visitors to any linked websites should not use or rely on the information contained therein until they have consulted with an independent financial professional. Please click “Continue to Link” to leave this website and proceed to the selected site.
    phone-handset