Article

Percentage of Individual Tech Stocks that Lost Money

Percentage of Individual Tech Stocks that Lost Money

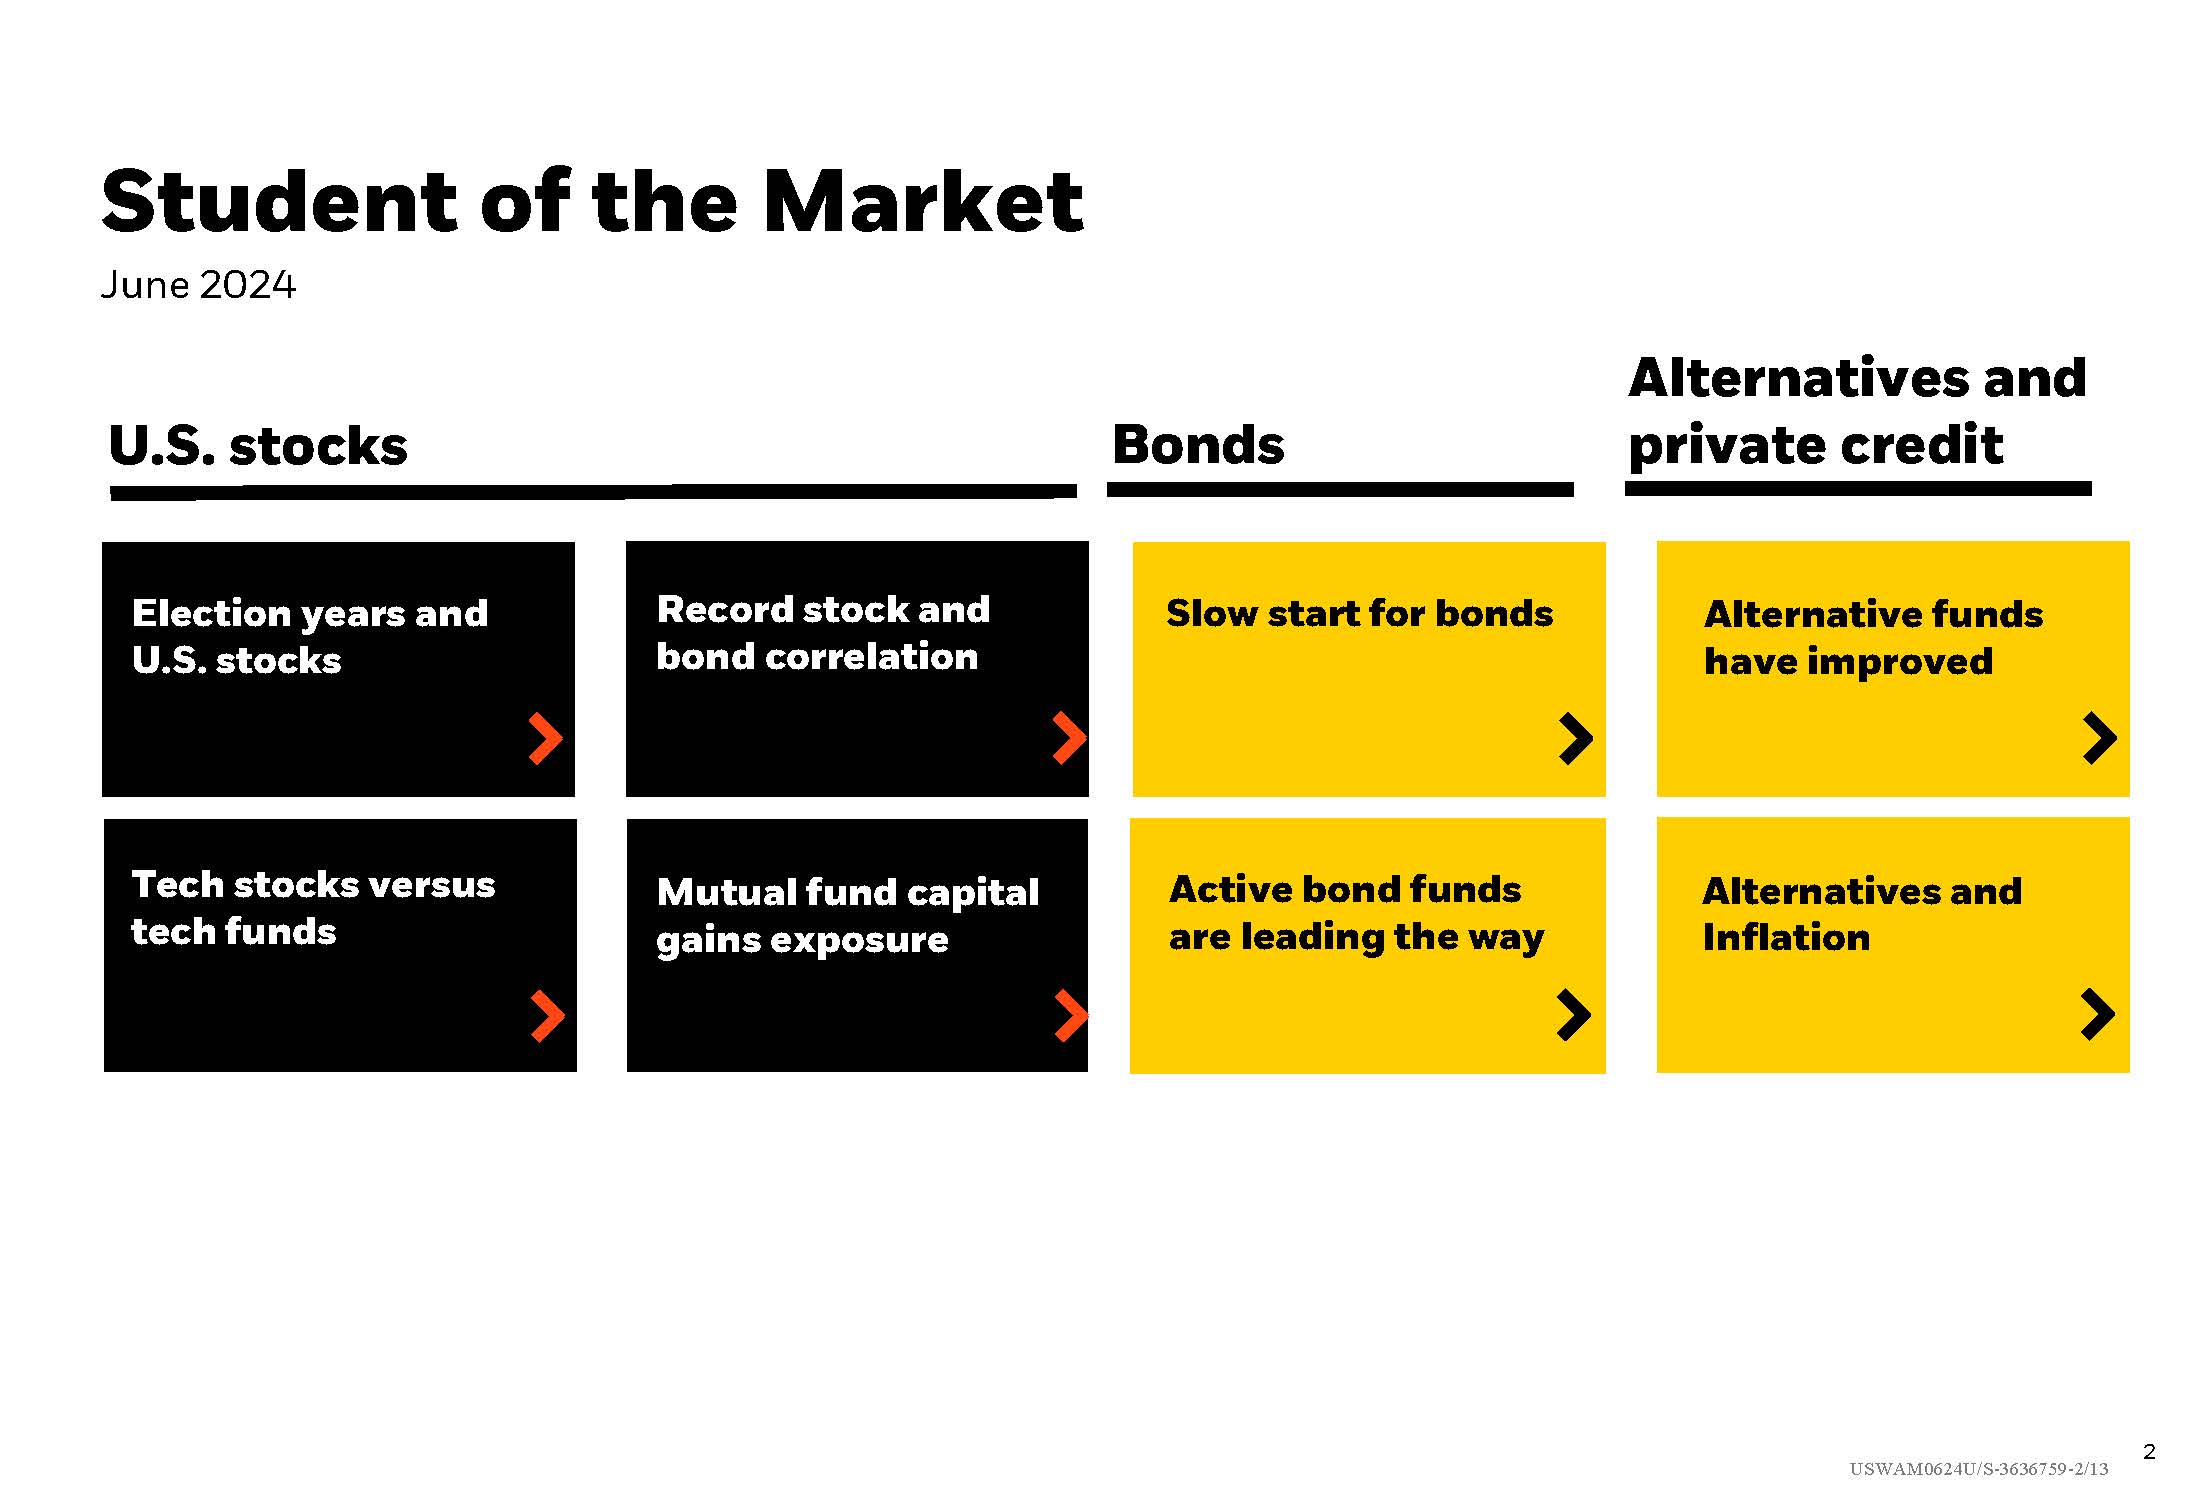
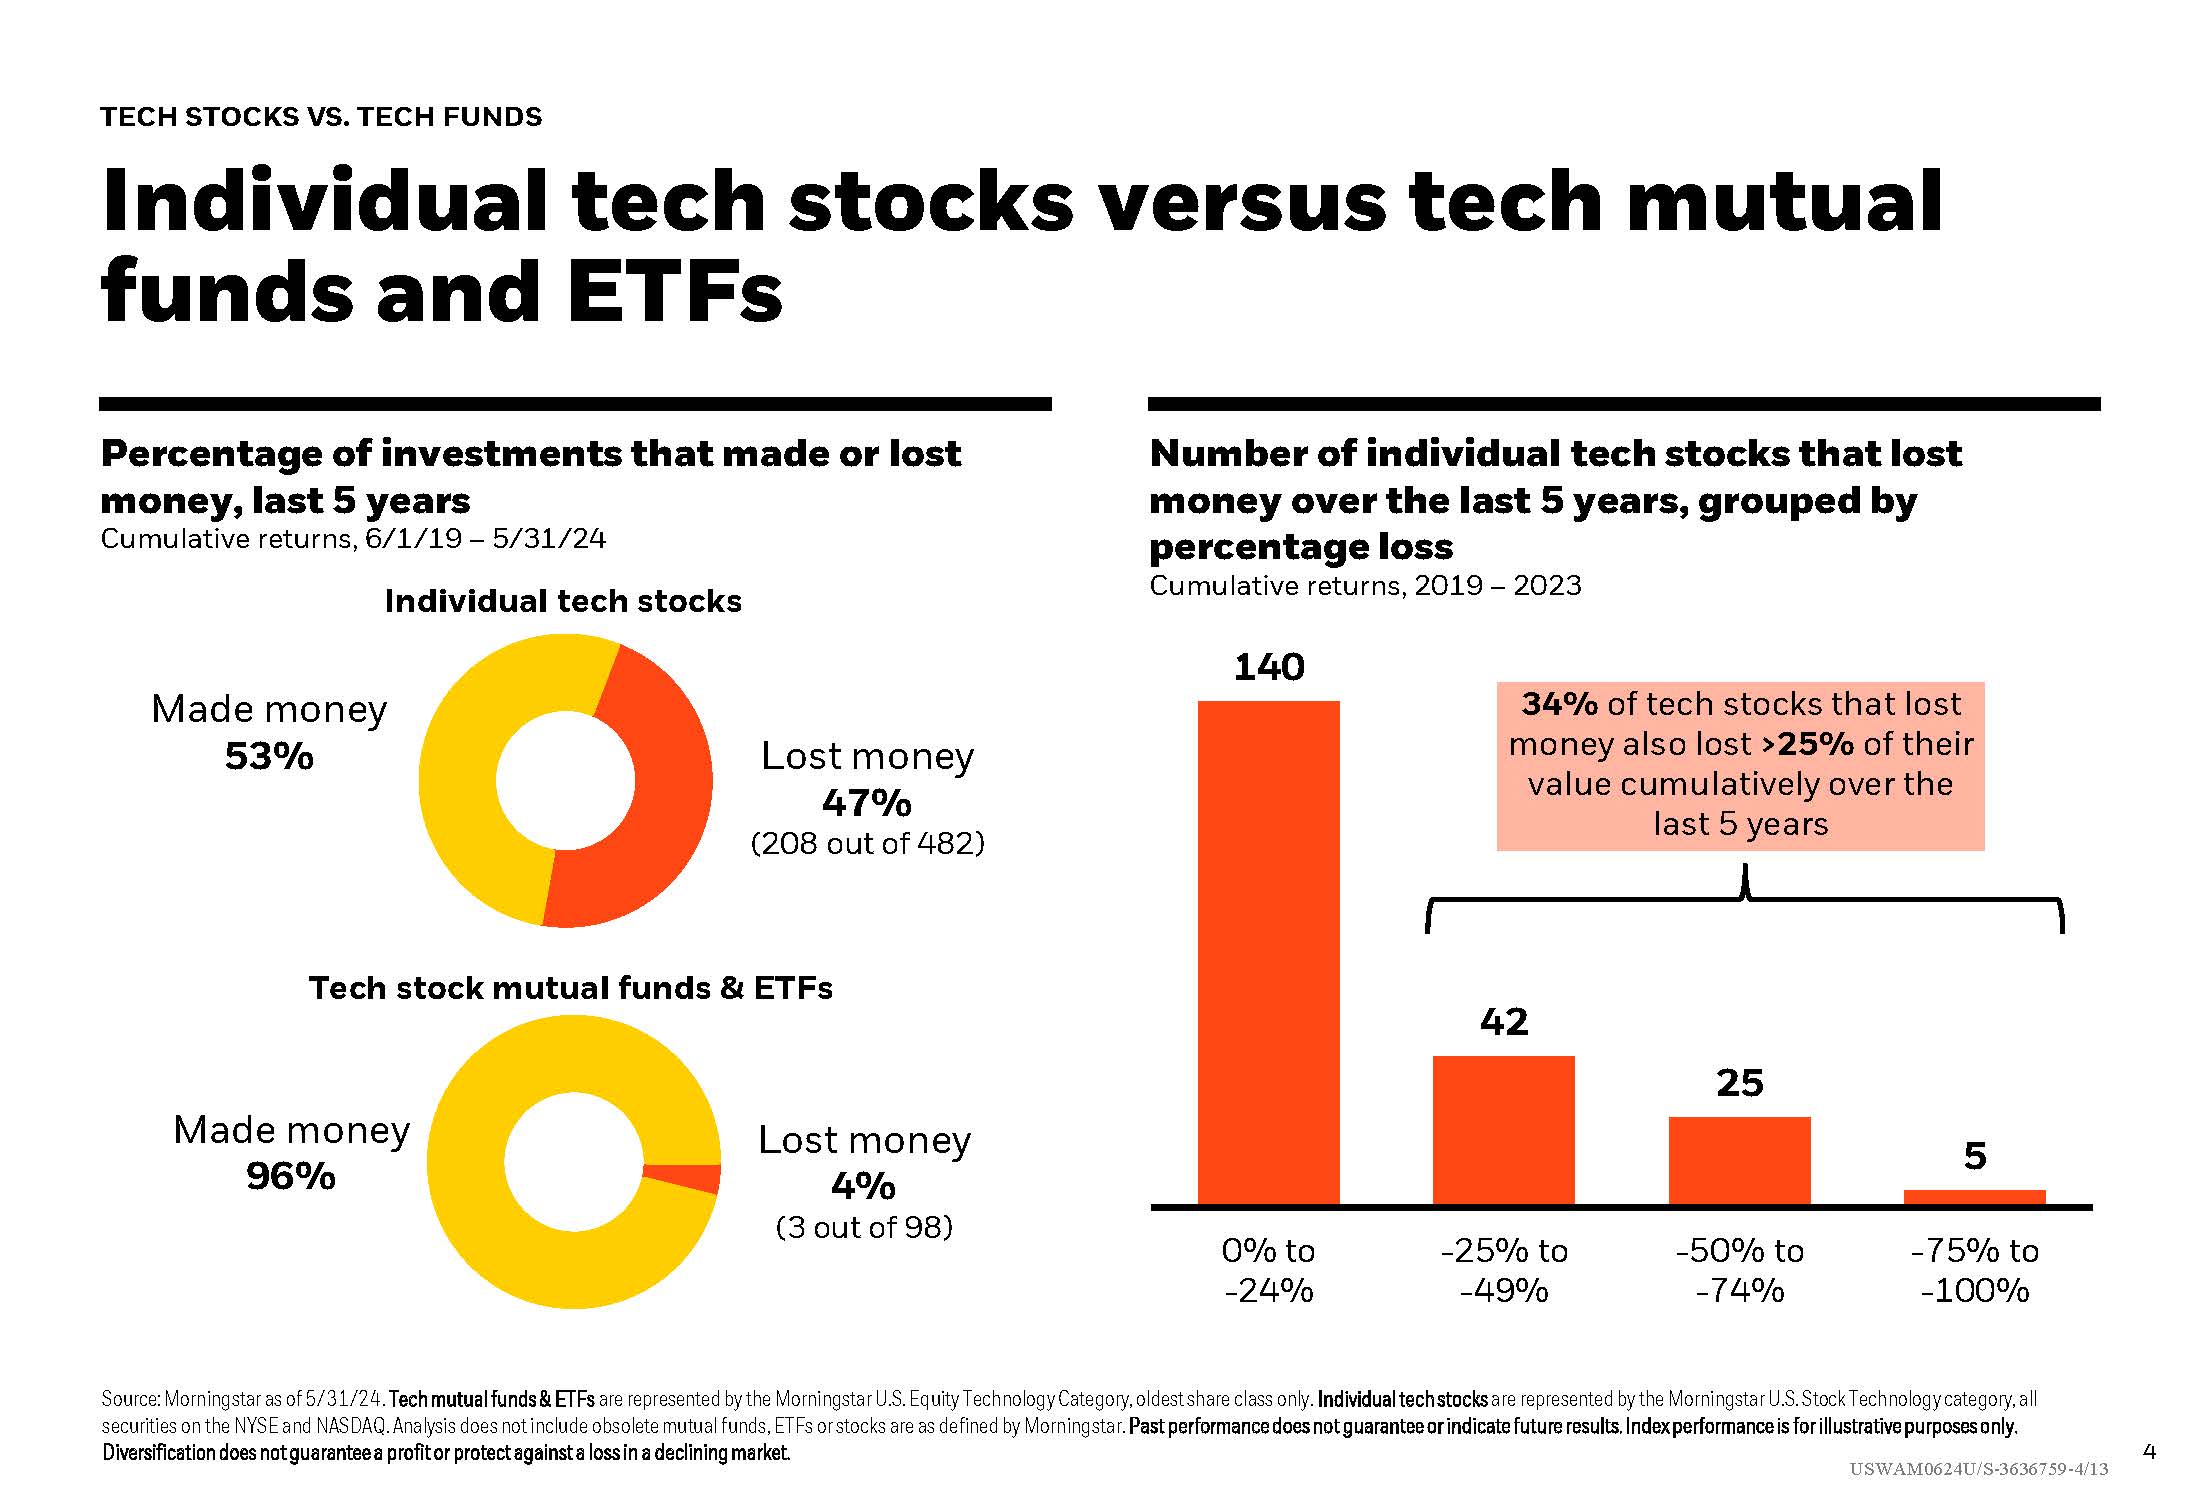
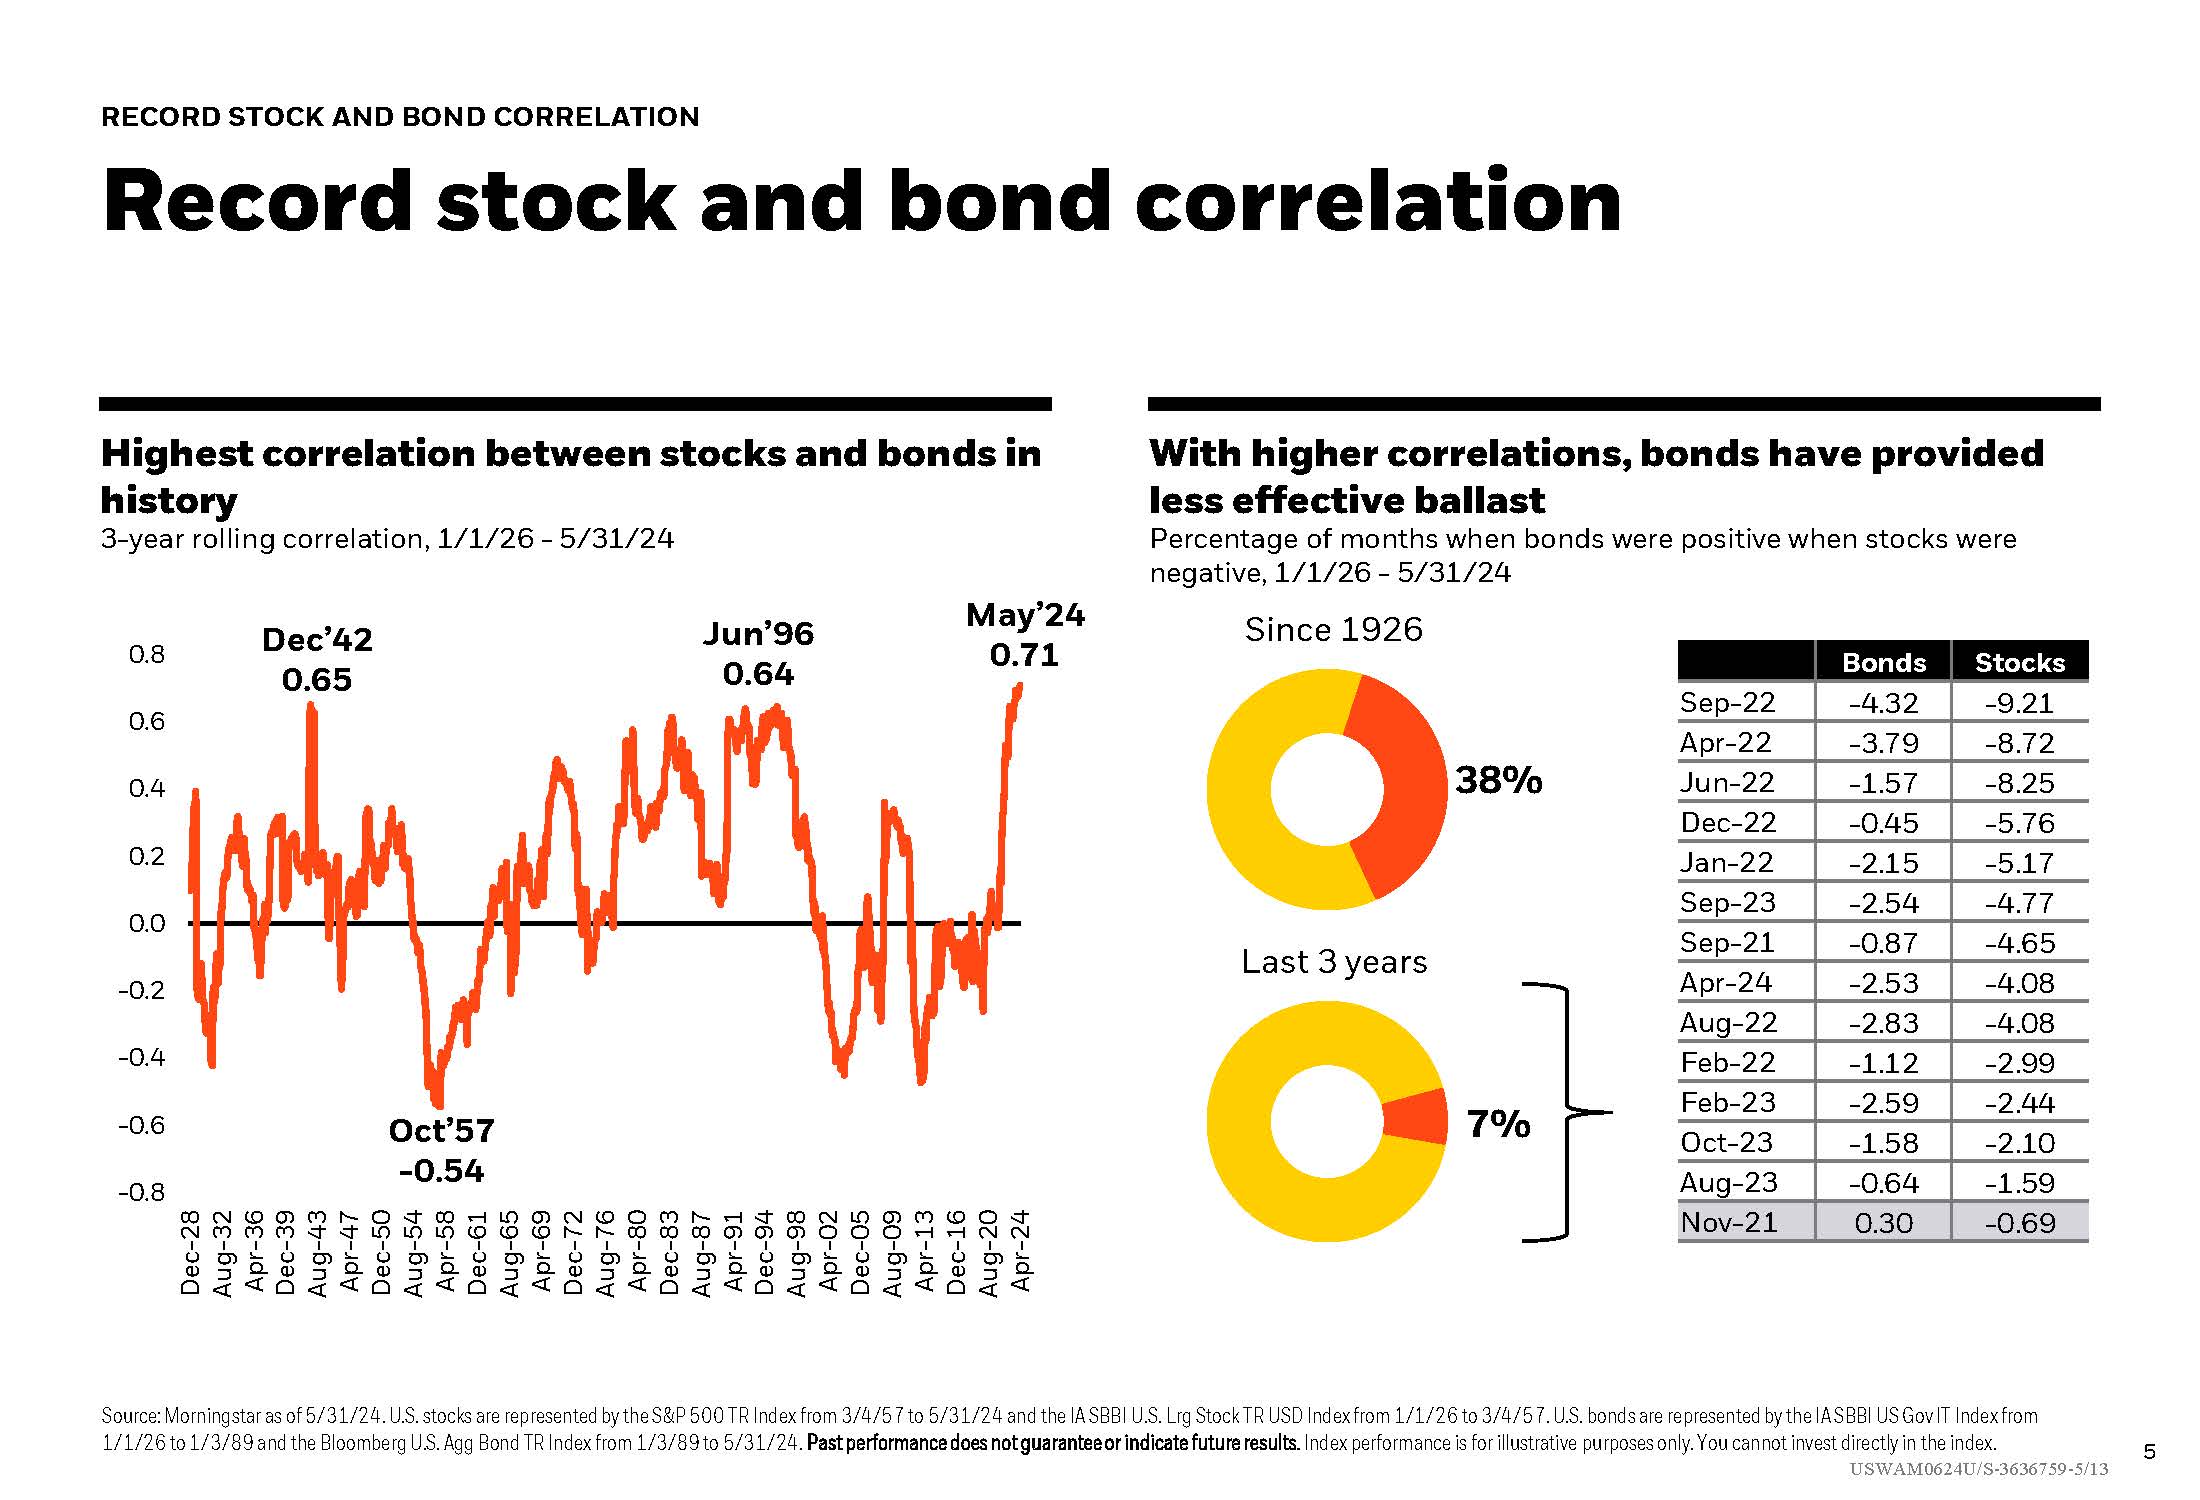
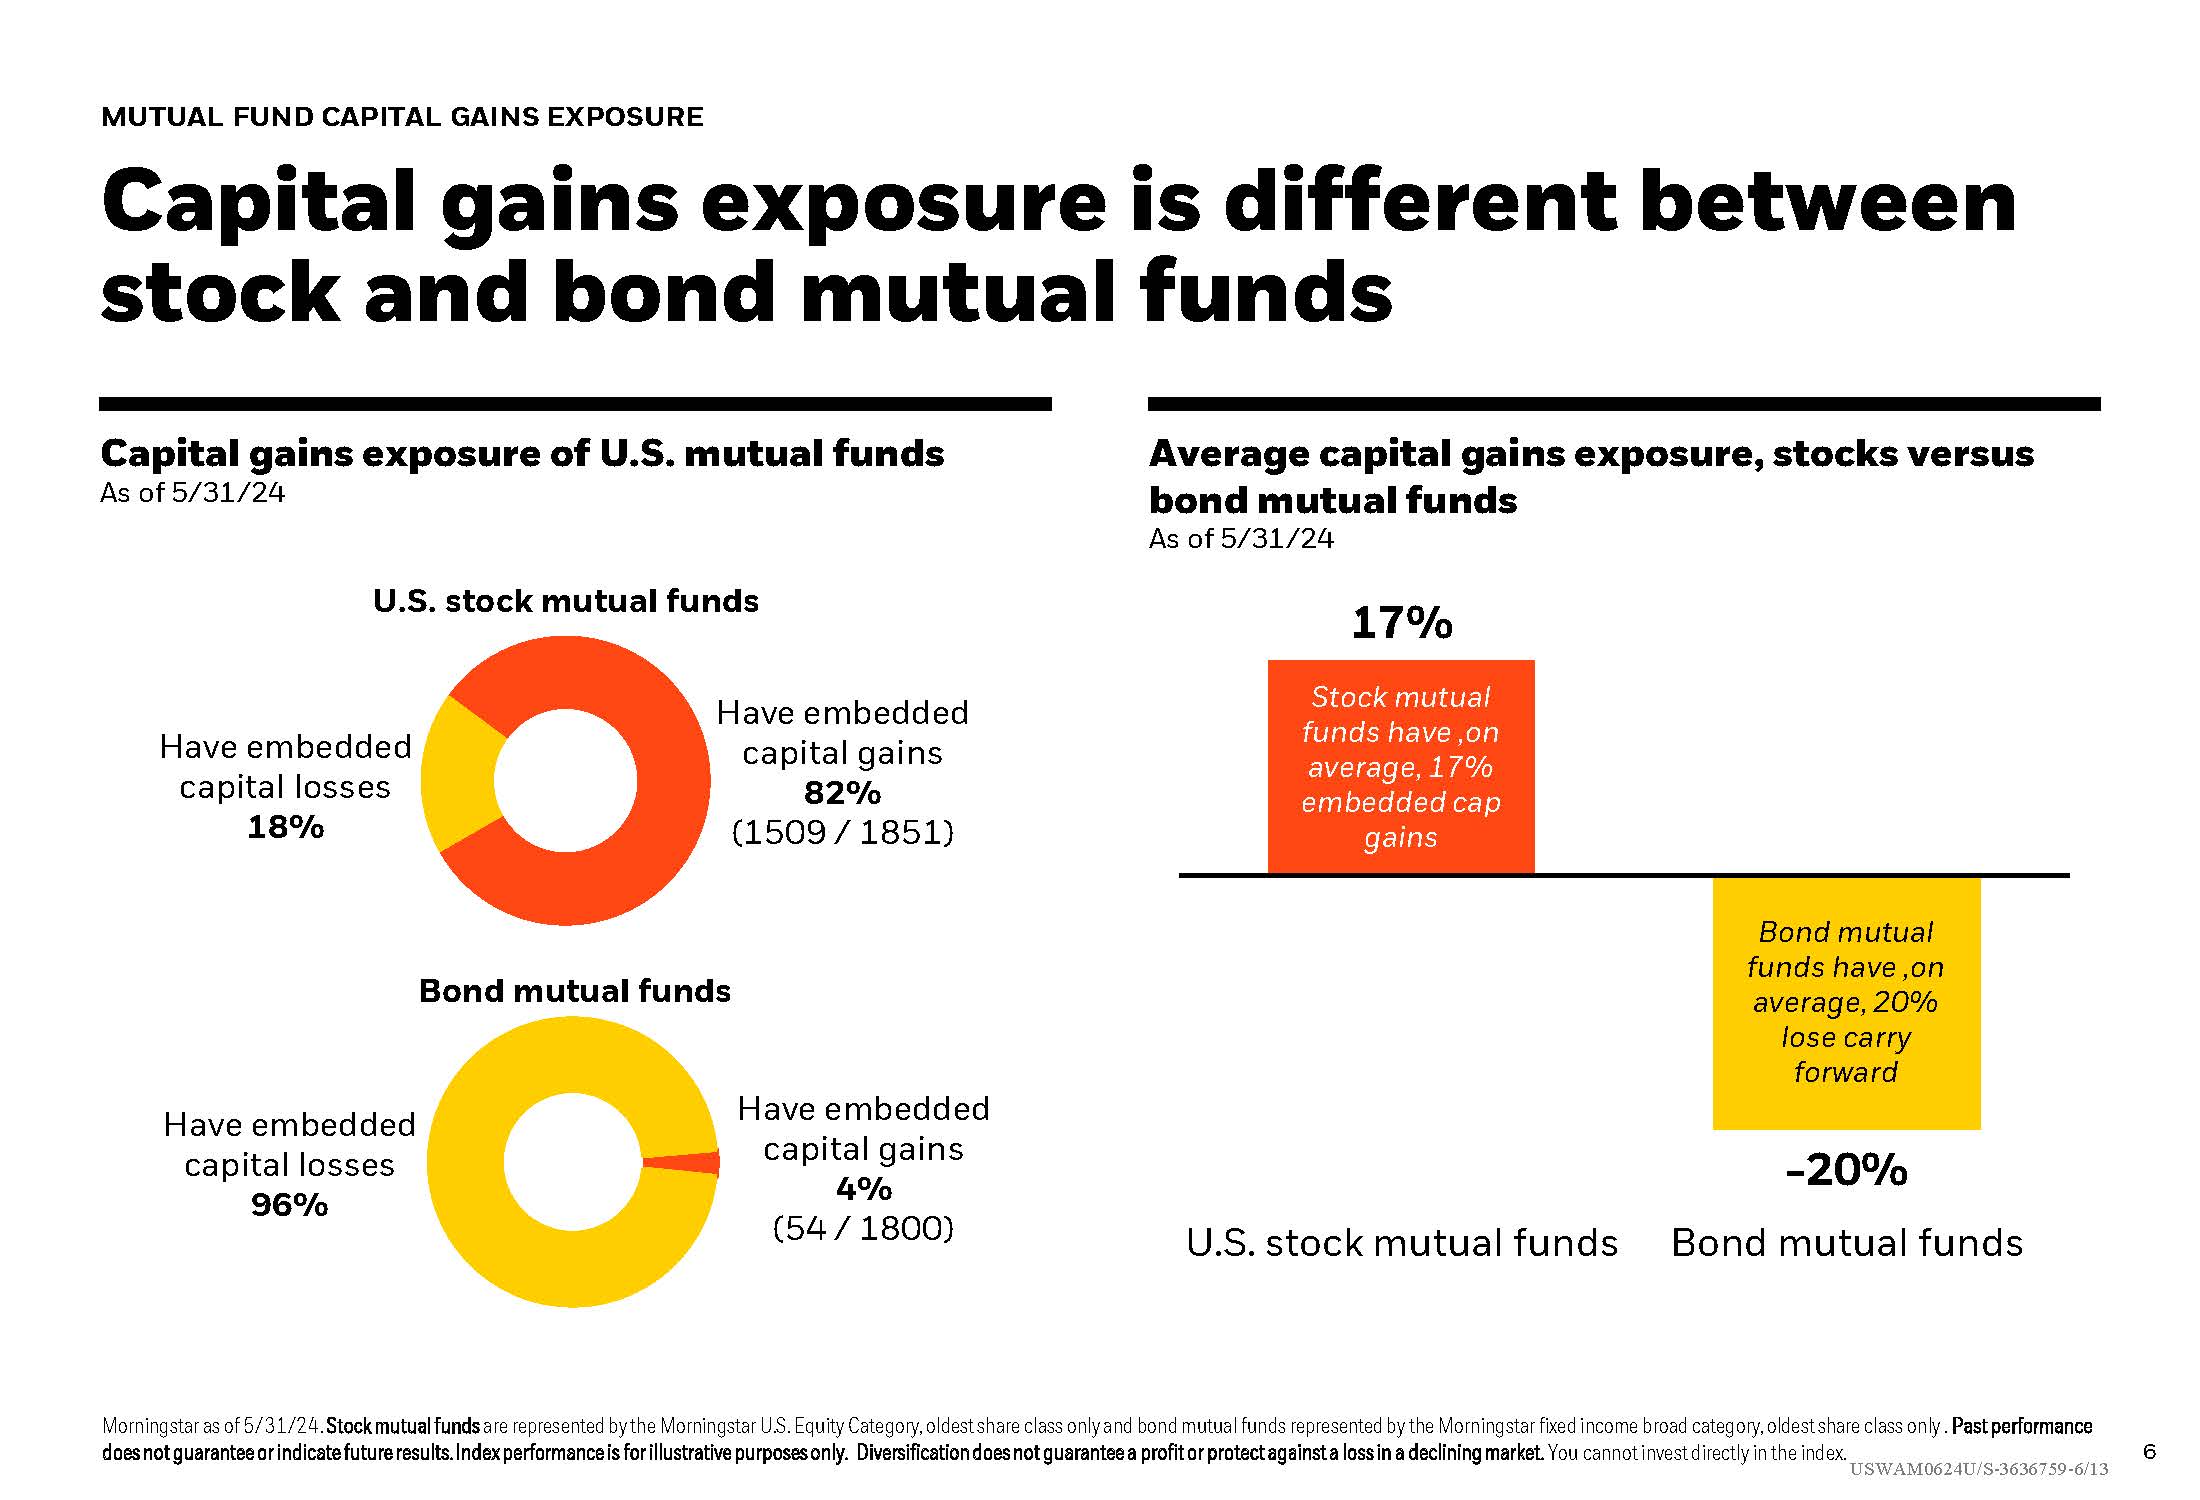
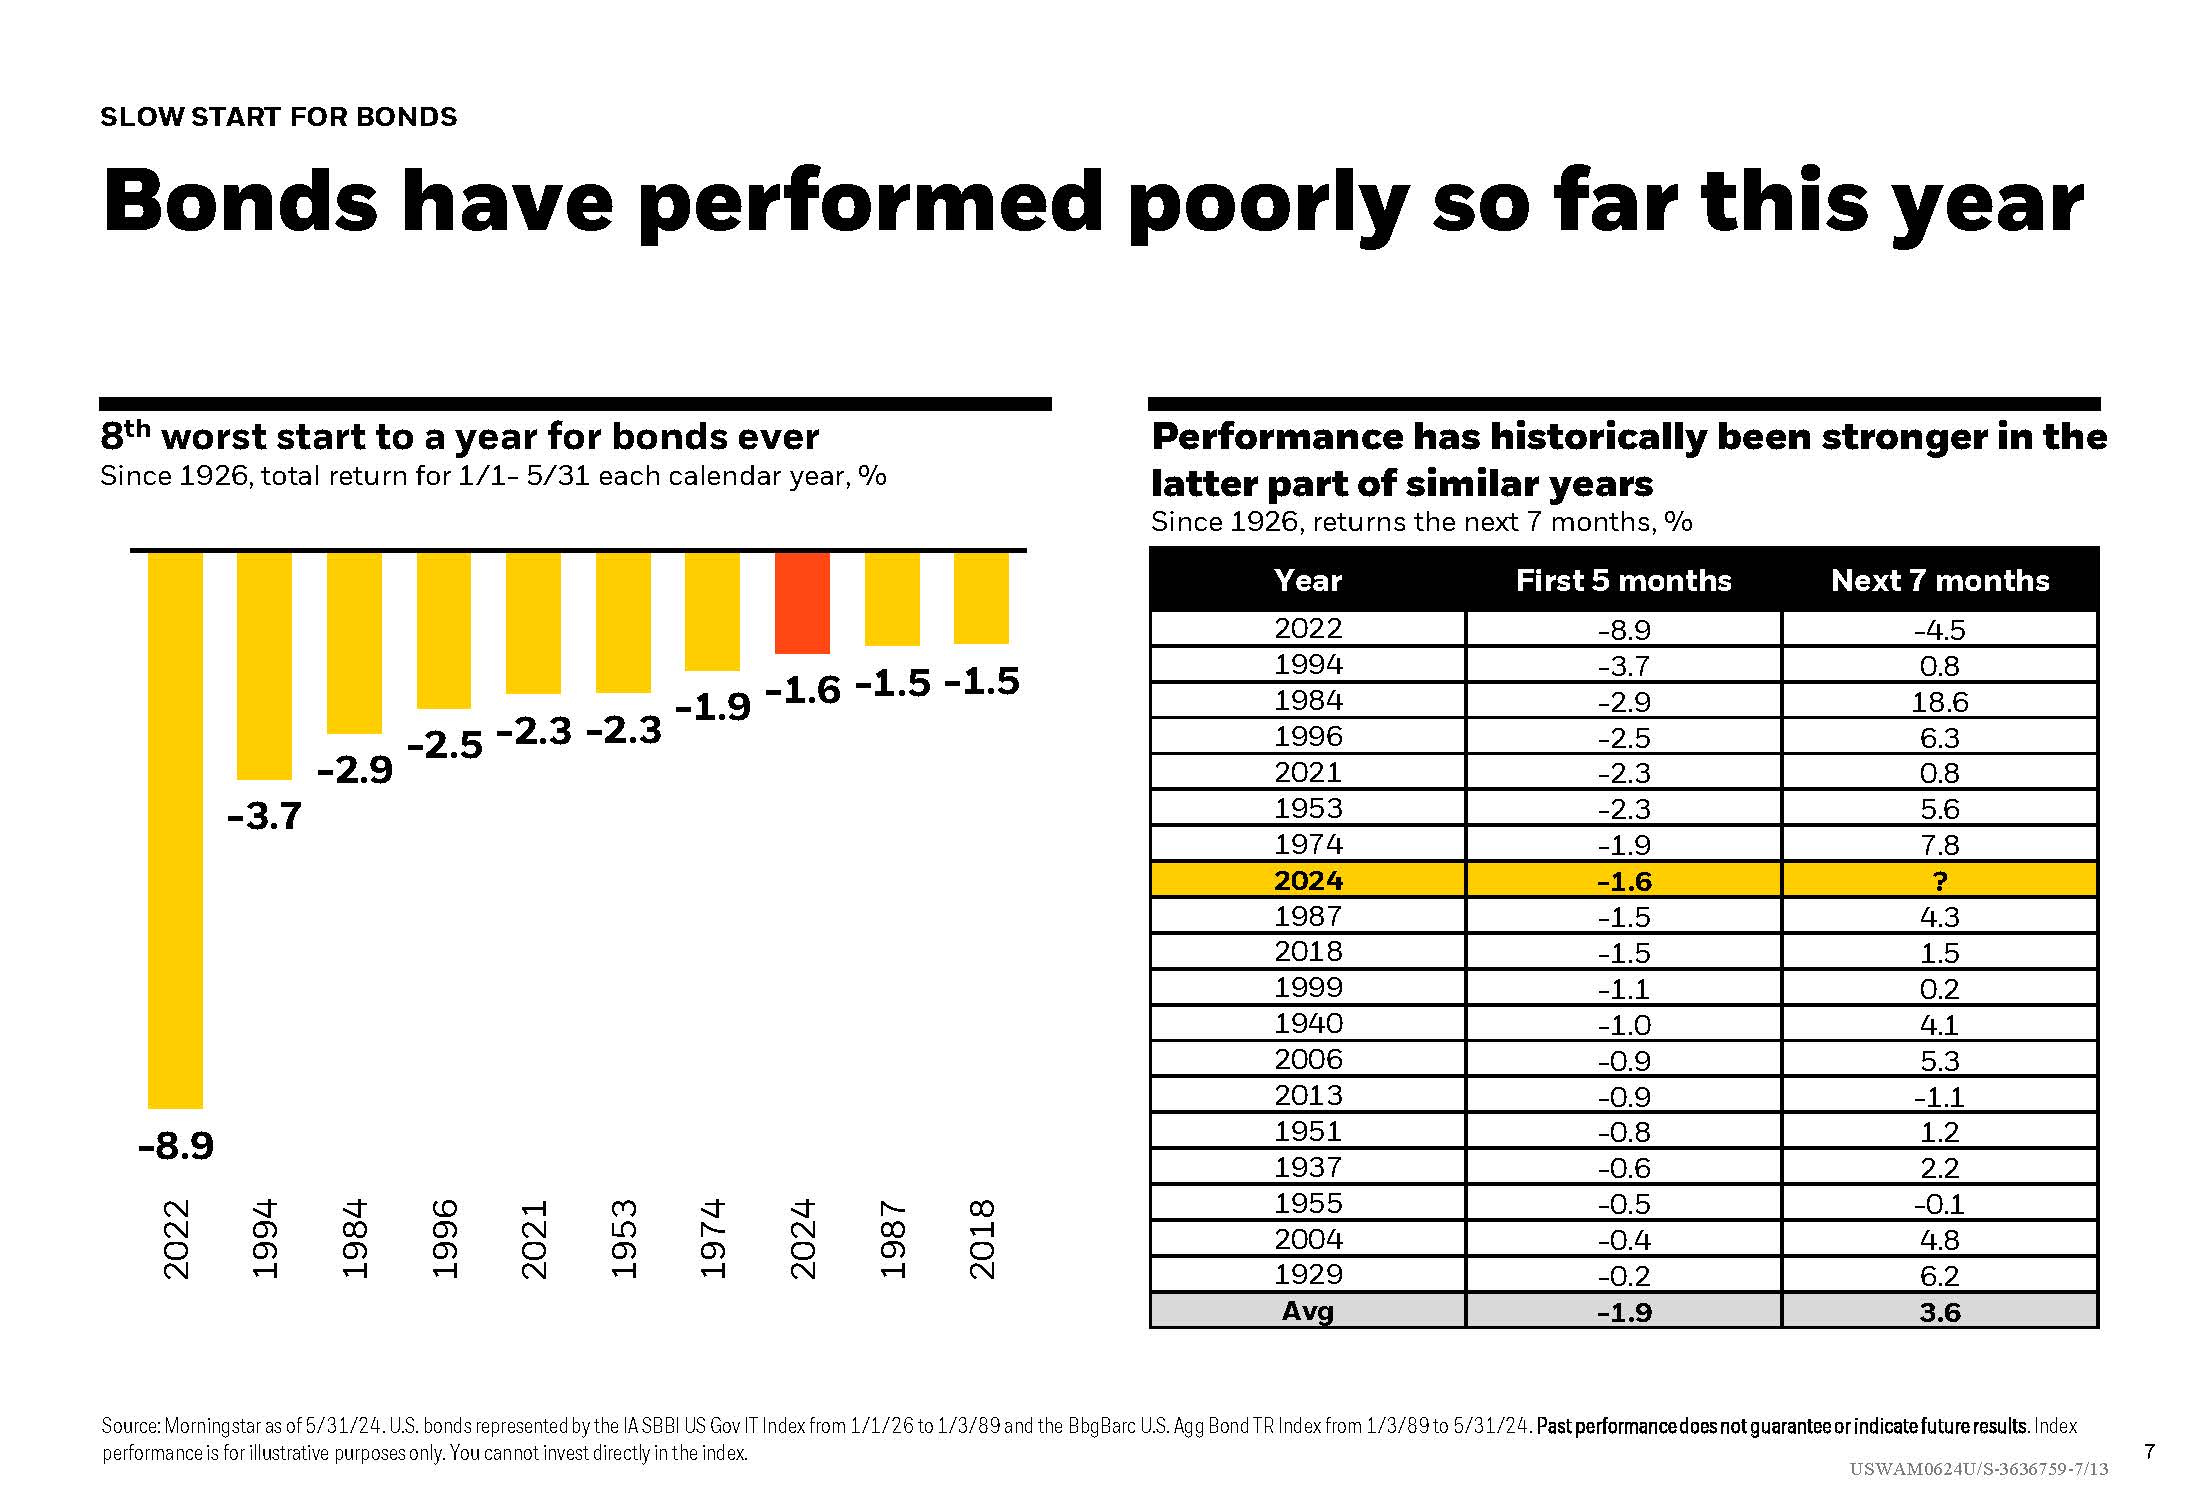
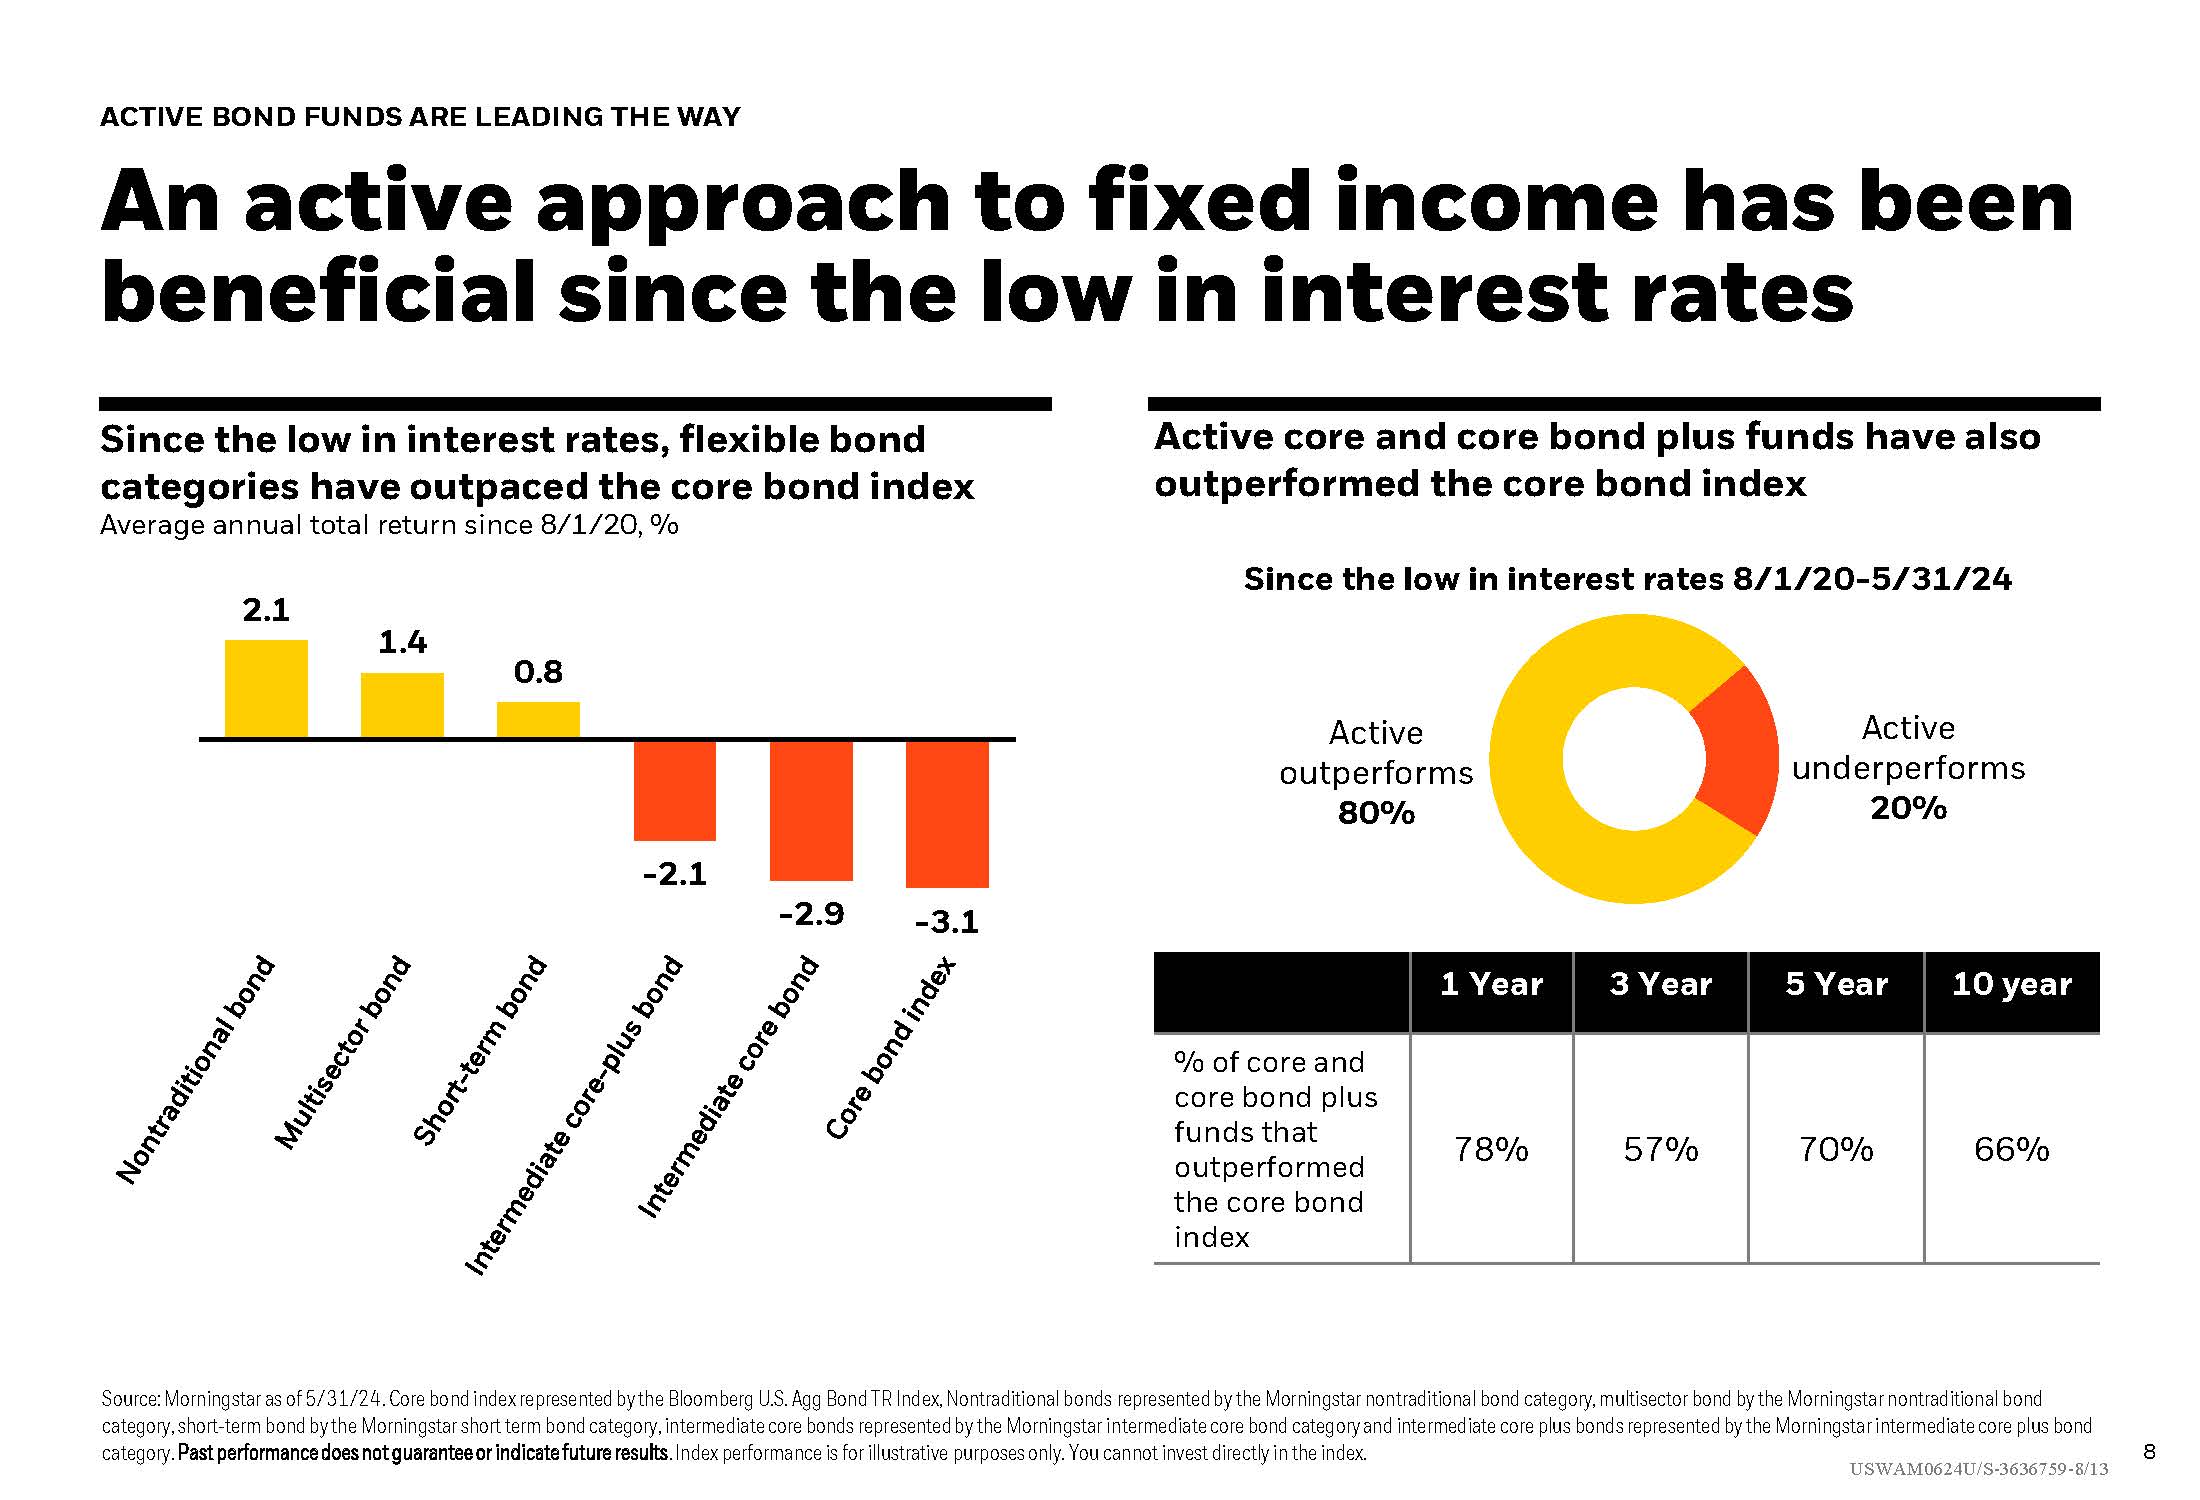
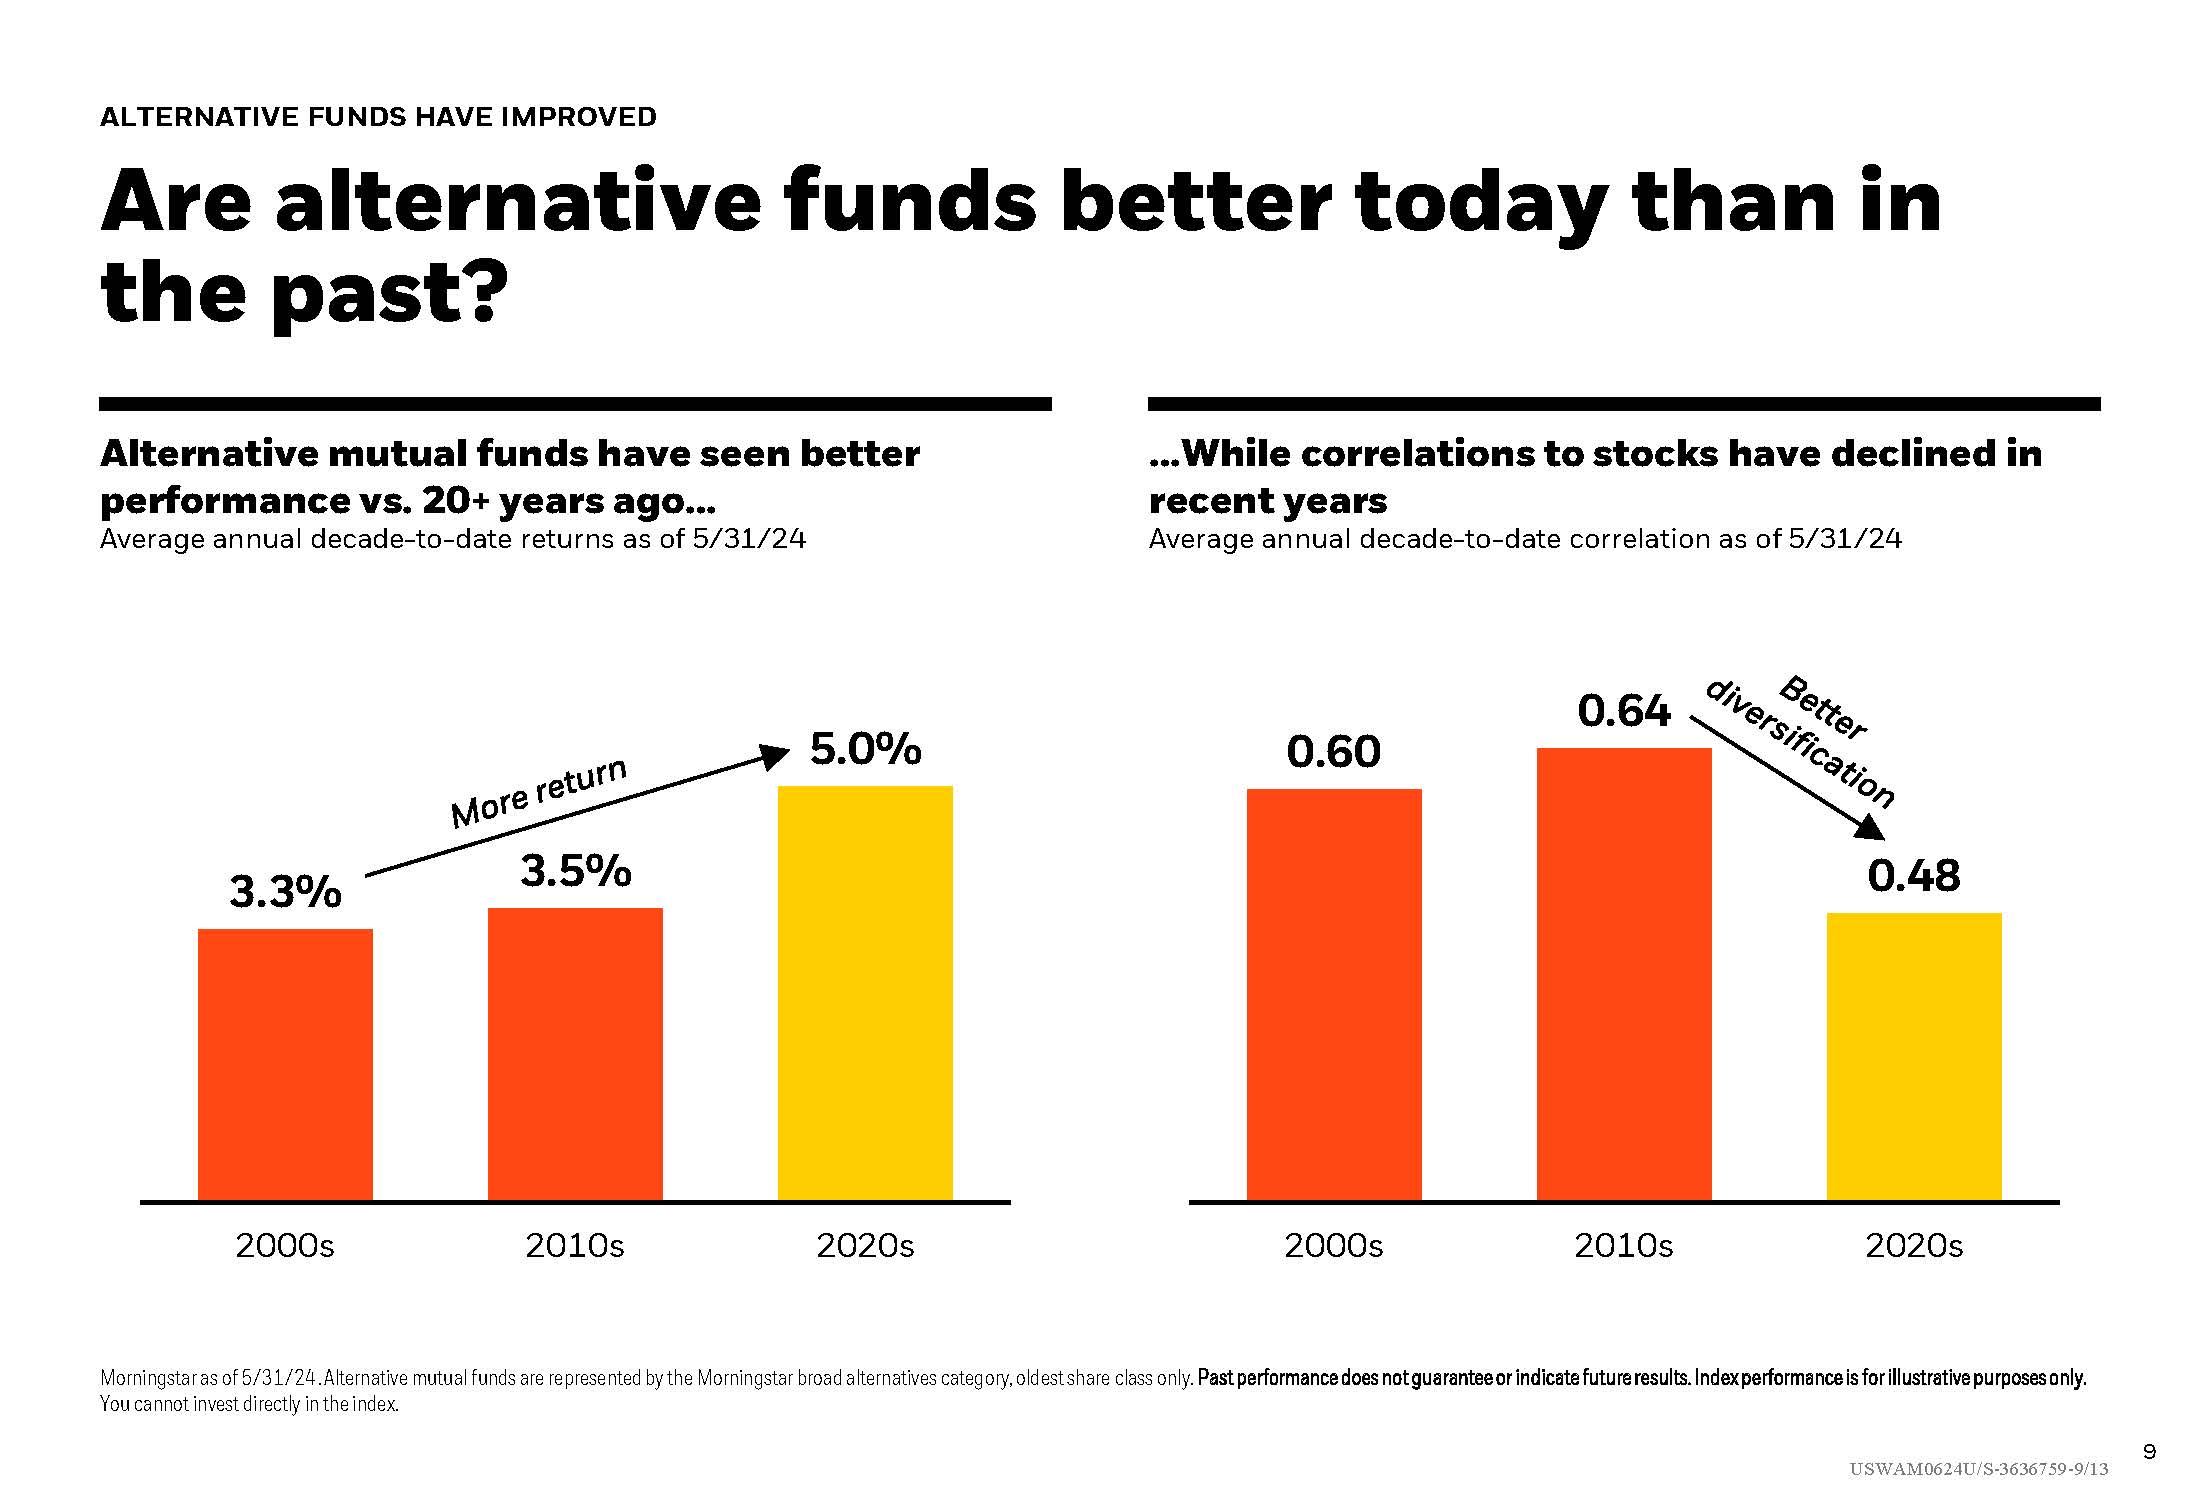
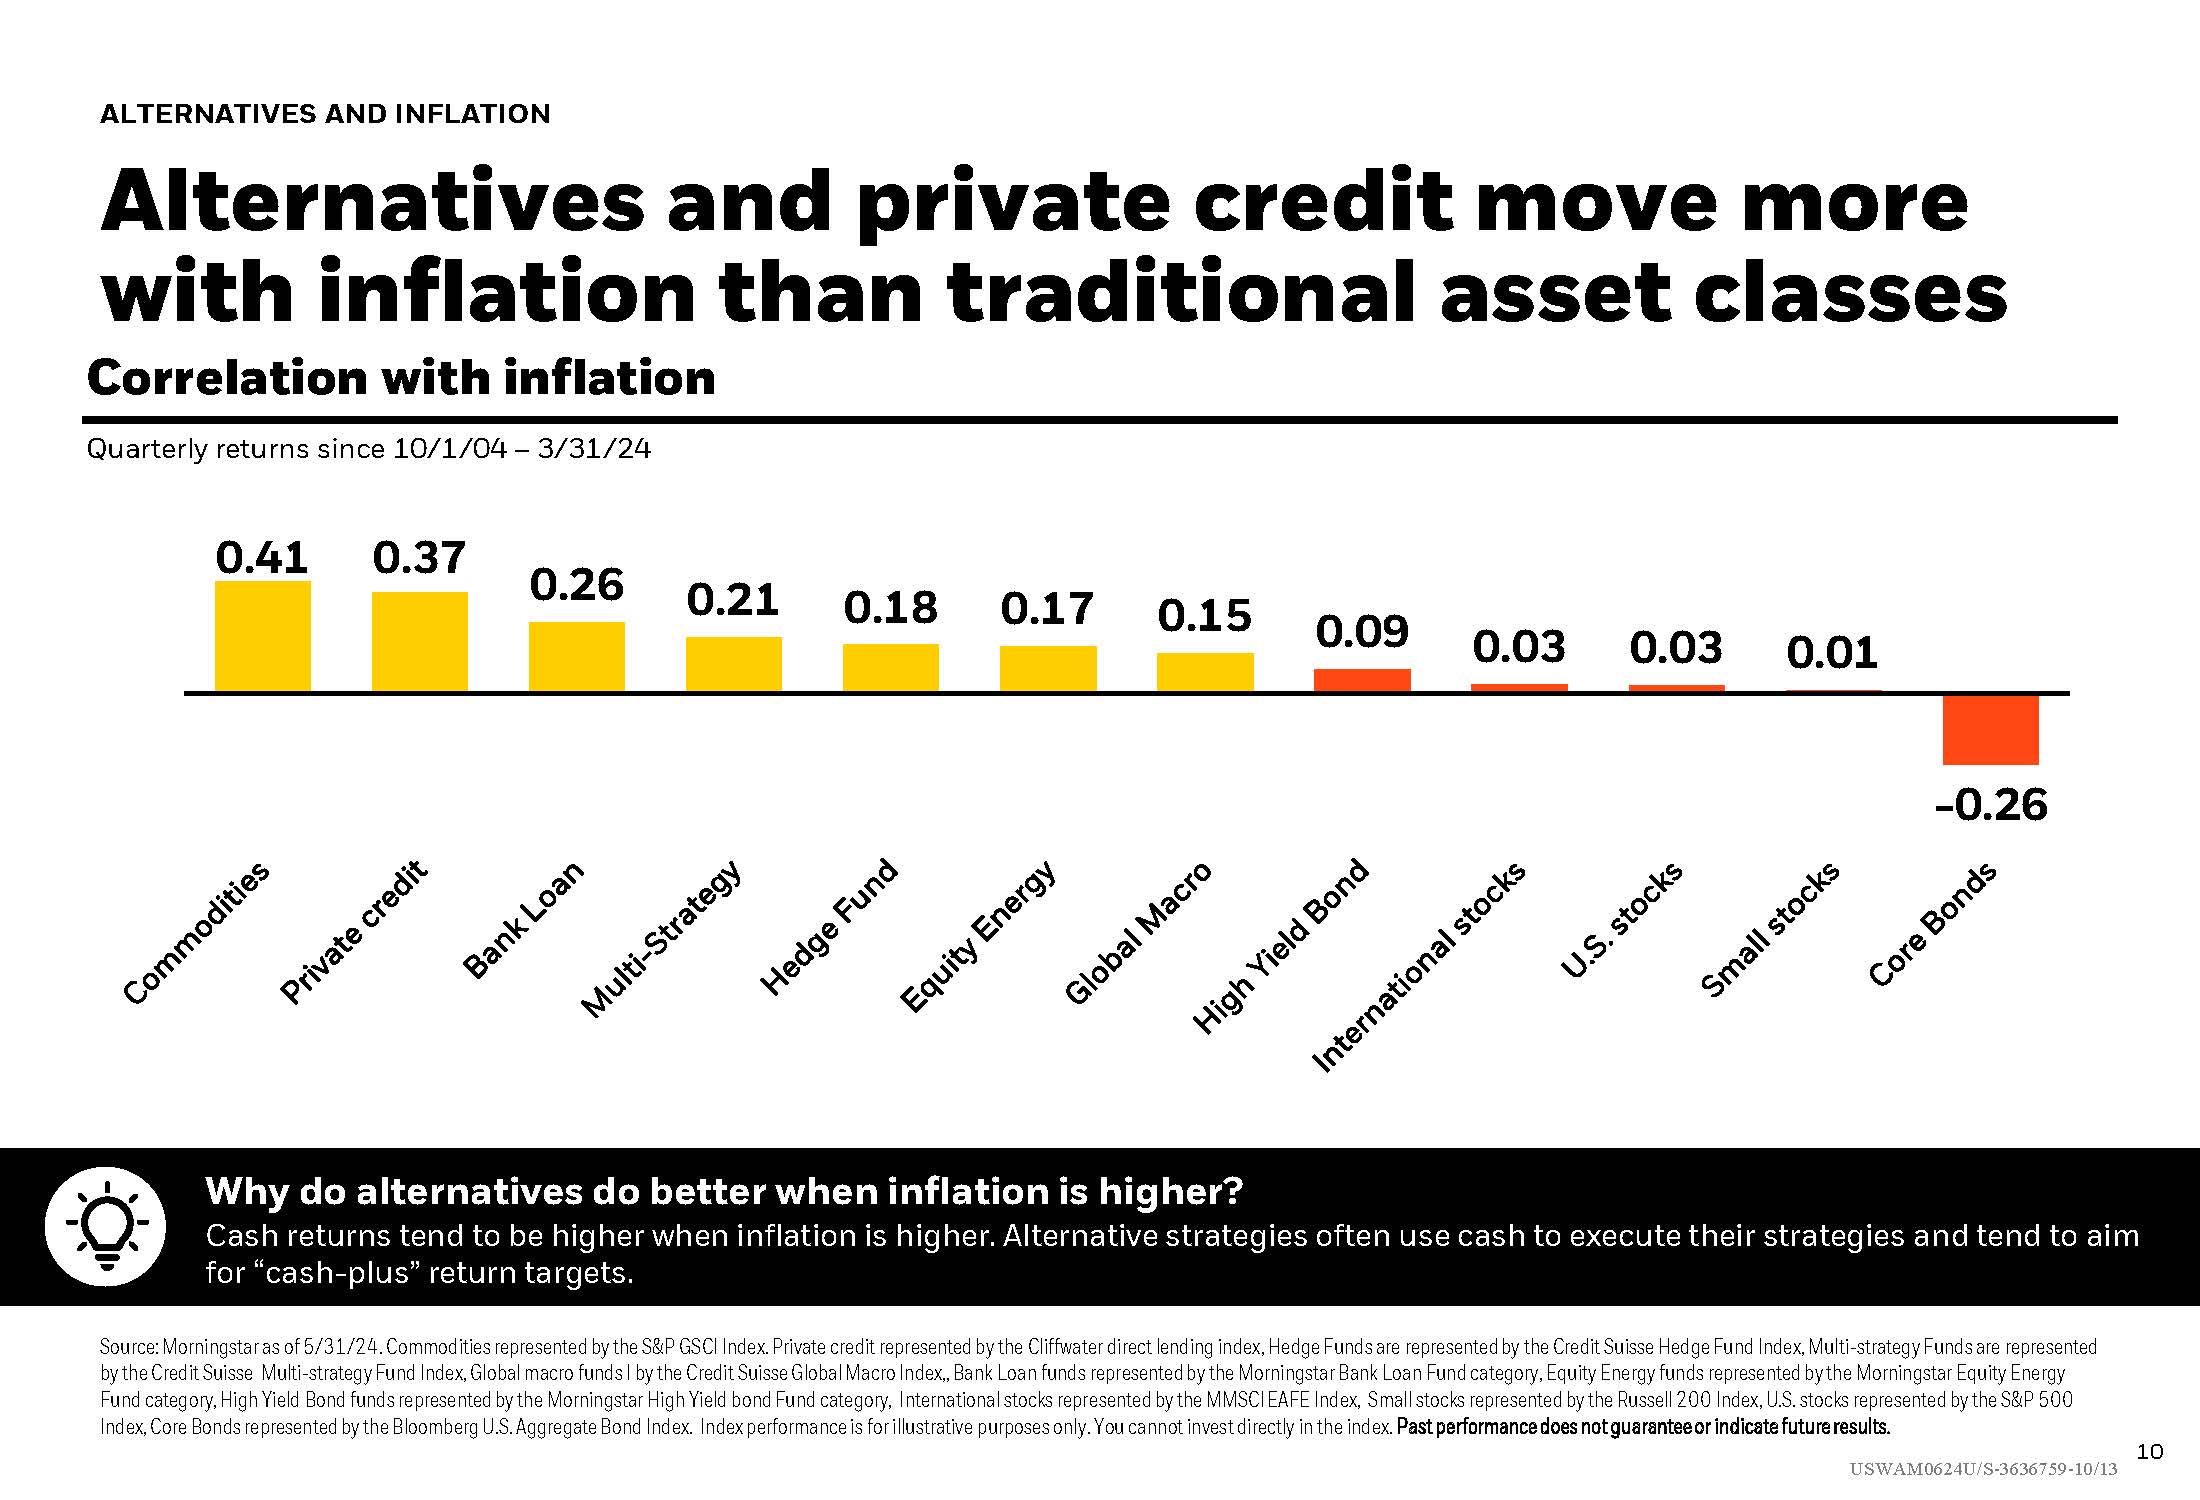
Overview data shows individual tech stocks verses tech mutual funds and ETFs, and the surprising number of individual tech stocks that lost money over the last 5 years. Also a look at the highest correlation between stocks and bonds in history, along with capital gains exposure, bond performance, and alternative funds compared to traditional asset classes with inflation.

July 2, 2024
Percentage of Individual Tech Stocks that Lost Money
Important Disclosure: Content on our website and in our newsletters is for informational purposes only. The information provided may (or may not) directly apply to your situation. We recommend that readers work directly with a professional advisor when making decisions in the context of their specific situation.

Other content you may like

  • Inflation: The Nemesis of Every Retiree

    Inflation: The Nemesis of Every Retiree

    June 3, 2024
    Even though the rising costs of goods and services can erode the purchasing power of your retirement savings, with proactive planning and smart strategies, its impact can be mitigated. Included are ideas for several areas of your finances that can possibly be adjusted.
    Read this Article
  • Podcast Highlight 1 - Market Recap

    Podcast Highlight 2 - Weighted S&P 500 and AI

    June 3, 2024
    Learn valuable information in this clip as the Strong Valley advisor team brings light to the S&P 500, tech stocks and how growth affects their market success.
    Read this Article
  • Build A Better Tax Plan

    5 Ways to Build a Better Tax Plan

    April 20, 2021
    Here are some strategies to consider helping your financial plan become more tax-efficient.
    Read this Article
  • A Positive Start to the Year for Stocks

    A Positive Start to the Year for Stocks

    June 23, 2023
    Looking at stats from January through May, it’s good to see a positive start to the year for U.S. stocks. This market overview also looks at the growth heavy U.S. large cap stock index and charts the hidden risk in Growth vs. Value. Included is a current and historical look at how the Fed funds rate affects core bonds, short term bonds, and performance strategies with a potential Fed Reserve pause.
    Read this Article
  • The link you have selected is located on another server. The linked site contains information that has been created, published, maintained, or otherwise posted by institutions or organizations independent of this organization. We do not endorse, approve, certify, or control any linked websites, their sponsors, or any of their policies, activities, products, or services. We do not assume responsibility for the accuracy, completeness, or timeliness of the information contained therein. Visitors to any linked websites should not use or rely on the information contained therein until they have consulted with an independent financial professional. Please click “Continue to Link” to leave this website and proceed to the selected site.
    phone-handset