You are now leaving the Strong Valley Wealth & Pension, LLC ("Strong Valley") website. By clicking on the "Schwab Alliance Access" link below you will be entering the Charles Schwab & Co., Inc. (“Schwab”) Website. Schwab is a registered broker-dealer, and is not affiliated with Strong Valley or any advisor(s) whose name(s) appears on this Website. Strong Valley is/are independently owned and operated. Schwab neither endorses nor recommends Strong Valley. Regardless of any referral or recommendation, Schwab does not endorse or recommend the investment strategy of any advisor. Schwab has agreements with Strong Valley under which Schwab provides Strong Valley with services related to your account. Schwab does not review the Strong Valley website(s), and makes no representation regarding the content of the Website(s). The information contained in the Strong Valley website should not be considered to be either a recommendation by Schwab or a solicitation of any offer to purchase or sell any securities.
The New Year is a time for resolutions and new beginnings.
Every January, local gyms are inundated with people looking to get fit. But by February, those same local gyms are ghost towns.
The challenge: Self-improvement requires new habits, not just resolutions, and it extends beyond our health. As we embark on a new year. Let's focus on wellness habits for our wealth too. By incorporating financial wellness into our daily routines, we can build lasting habits that will benefit us for years to come.
Here are four practical tips to help turn financial wellness into a lifestyle:
Success begins with goal setting. When setting goals, make them:
Success begins with goal setting. When setting goals, make them:
Specific: Clearly define your goals, such as saving for a down payment or paying off debt.
Measurable: Set quantifiable targets, like saving $500 per month.
Achievable: Break down large goals into smaller, manageable steps.
Relevant: Ensure your goals align with your overall financial objectives.
Time-bound: Set deadlines to keep yourself accountable.
A good budget is all about being realistic. If we trim too much, we cheat. If we don’t trim enough, we don’t see results.
Track Your Spending: Use a budgeting app or spreadsheets to monitor your income and expenses.
Prioritize Needs Over Wants: Allocate funds for essential expenses like your mortgage, rent, utilities, and groceries.
Build an Emergency Fund: Aim to save three to six months' worth of expenses in case of an emergency.
Automate Savings: Set up automatic transfers to your savings account.
Success requires long-term goals with short-term milestones. When it comes to financial wellness, we cannot set it and forget it.
Check Your Accounts: Monitor your bank accounts, credit cards, and investment portfolios.
Reassess Your Goals: Adjust goals as needed to adapt to changing circumstances.
Celebrate Your Successes: Reward yourself for achieving milestones.
Success never happens on an island. Financial wellness requires a village of advisors and partners. You don’t have to climb this mountain alone. Together, we can help you develop a budget, reduce debt, and define your goals to create long-term habits.
By incorporating habits into your daily routine, you can build a strong financial foundation to pursue long-term financial confidence. Remember, small steps can lead to big results. So, let's make this year the year you prioritize your financial wellness and set yourself up for a prosperous future.
Punxsutawney Phil – arguably the most famous groundhog of all time – saw his shadow in 2021, predicting another six weeks of winter this year.
But according to the Punxsutawney Groundhog Club’s records, cross-referenced with past weather data, Phil has only been accurate in his weather predictions about 39% of the time. Makes you wonder how Phil missed the massive shadow of the 2020 stock market, which saw a pandemic-induced bear market shortly after Phil declared an early spring. Or maybe Phil just doesn’t like spring, because since 1887, Phil has predicted more winter more than 100 times.
But in the spirit of hoping Phil is wrong, let’s talk about how you can spring clean your investments now so that you can move beyond the long shadows of 2020 and make sure you’re not overly dependent on stock markets reaching new highs.
Call it 2021-Investment-Spring-Cleaning in two simple steps:
Scattered holdings are like hanging your clothing in closets throughout the house or stowing them in boxes, out of sight. Imagine dressing for a formal occasion, but running from closet to closet to piece together your outfit. It’s the same with financial accounts.
If you have accounts scattered all over the place, it can be hard, and often impossible, to understand what you’re invested in, and where all your money is located.
A mishmash of assets is the enemy of good financial planning. If you don’t know where your money is, you can’t minimize taxes by knowing how much is taxable versus tax-deferred. You also can’t know or remember what you have where, and what should be rebalanced. An example of a need for rebalancing: The 50-50 mix you want in stocks and bonds could now be 70-30, and must be brought back in line.
Here are some guidelines for the number of places you should hold investments:
Retirement Plans. One current 401(k) or 403(b) plan per person. Take all 401(k) and 403(b) plans from previous employers, and roll them into a single individual retirement account.
Brokerage Accounts. No more than two brokerage accounts per individual or couple. Some folks have a checking account at one brokerage house, but most or all their holdings at another. That’s okay, but going beyond two of them gets messy. Having money spread across several brokerage accounts to “see how each of them is doing” makes no sense. That means no single advisor can know everything you’re invested in, so they invest on your behalf with blinders on.
Unnecessary, overlapping investments are often the counterproductive result.
Bank Products. No more than two banks for certificates of deposit, checking and savings per individual or couple. You may have some CDs at one bank, but use another for checking or savings. But no more than two.
Annuities. If you have several annuities and they aren’t burdened with surrender penalties, these should be consolidated. Make sure you talk to your advisor before you just roll them over via a 1035 exchange, which allows you to liquidate an account and not be taxed on its growth because you move it into a comparable vehicle.
Insurance. The same holds true for insurance. The fewer policies you have, the better. One provider is usually enough for each kind of policy: life insurance, property-casualty, disability and so on.
Mutual Funds. Let’s turn to another target for spring cleaning: an excessive number of mutual funds. Too often, they duplicate each other. Redundant investments give you asset class concentration instead of asset class diversification.
Everyone should have the right portfolio mix of the basic asset classes: short- and intermediate bonds (possibly municipal, corporate and global), large-, mid- and small-capitalization U.S. stocks, international developed markets stocks, and emerging markets.
The appropriate weighting of each asset class is determined by your risk tolerance, income and/or growth needs.
How do you know if your mutual fund holdings overlap? You likely won’t be able to tell if they do just by looking at the name alone. Talk to your financial advisor for an explanation. Because knowledge is power.
In case you don’t know, Punxsutawney Phil is actually pointing his nose, not so much looking for his shadow.
What really happens is that after Phil’s “handlers” retrieve him from his log and hold him high for everyone to see, they place him on a platform in front of two scrolls, each containing a prediction for either an early spring or six more weeks of winter. Phil points his nose at one of them and his “prediction” is given.
But as investors, we can’t ignore the long shadow of 2020, despite Phil predicting an early spring last year. It is prudent to start spring-cleaning your investments today – not six weeks from today.
Every four years, Washington D.C. and Wall Street converge as Americans elect a president and Wall Street tries to figure out what the outcome means for the stock and bond markets. And since so many hypotheses on this topic abound, it’s hard to keep track of them all.
For example, there are those who swear that Wall Street performs better when:
But what if we ranked the best and worst presidents simply by the performance of the stock market? Surely that would settle the debate as to which president was best for investors, right? Well, while it sounds easy – and the editors at Kiplinger did rank presidents from worst to best according to the stock market – there are a few big caveats to consider.
Caveat #1: Since the Office of the President was established in 1789, America has had 44 different presidents. And just three years later, Wall Street was officially founded on May 17, 1792 with the signing of the Buttonwood Agreement.
But for the most part, there really was no “stock market” until the late 1800s, meaning it doesn’t make sense to include the first 22 presidents. So this analysis starts with the election of 1888.
Caveat #2. The Dow Jones Industrial Average was first published on May 26, 1896 and it followed the 12 largest companies in each sector. Today, it tracks 30 companies. The other very commonly-used index – the S&P 500 – although introduced in 1957 it does track data back to the late 1920s. The editors of Kiplinger decided to use the S&P 500 from President Hoover to the present and the DJIA for earlier.
Caveat #3. Returns do not include dividends. Over the last few decades, dividends have become a smaller component of total returns, so not including dividends will tend to favor more recent presidents.
Caveat #4. Data is not adjusted for inflation. This will tend to help presidents of inflationary times (Carter and Ford) and hurt presidents of deflationary times (Hoover and Bush).
Final Caveat. This one is sure to spark heated debate, but it seems fair to not include President Trump on this list simply because his presidency is still going.
Parts I, III and III brought us this list:
#1: President Herbert Hoover (-30.8% per year)
#2: President George W. Bush (-5.6% per year)
#3: President Grover Cleveland (-4.9% per year)
#4: President Richard Nixon (-3.9% per year)
#5: President Benjamin Harrison (-1.4% per year)
#6: President William Howard Taft (-0.1% per year)
#7: President Theodore Roosevelt (2.2% per year)
#8: President Woodrow Wilson (3.1% per year)
#9: President Franklin Roosevelt (6.2% per year)
#10: President John Kennedy (6.5% per year)
#11: President Jimmy Carter (6.9% per year)
#12: President Warren Harding (6.9% per year)
#13 of 22
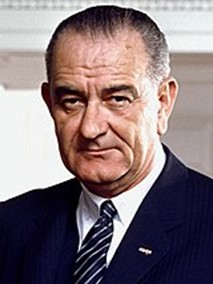
President Lyndon B. Johnson, Democrat
President Lyndon B. Johnson – also known as LBJ – assumed the presidency following the assassination of President Kennedy. His presidency is most often remembered for the escalation of the Vietnam War and significant social unrest throughout the country.
LBJ is generally ranked favorably by many economic historians for his domestic policies, including his War on Poverty efforts, expansion of civil rights, and the establishment of Medicare and Medicaid.
While the stock market turned in a healthy 7.7% per year, the cost of the Vietnam War caused inflation to move higher, eventually leading to the stagflation (high inflation, low growth, high unemployment) periods that plagued the presidencies after LBJ’s.
#14 of 22

President Harry S. Truman, Democrat
President Truman ascended to the presidency after the death of President Franklin Roosevelt and is best known for ending World War II, dropping the atomic bombs on Hiroshima and Nagasaki, the Marshall Plan which helped rebuild Western Europe and leading the U.S. into the Korean War.
Domestically, Truman’s presidency oversaw the start of the post-World War II surge in U.S. prosperity, although it was not without challenges, especially as Truman’s presidency was pockmarked with union strikes and rising consumer prices, leading to higher inflation.
Nevertheless, stocks averaged an 8.1% annual return during the Truman years.
#15 of 22
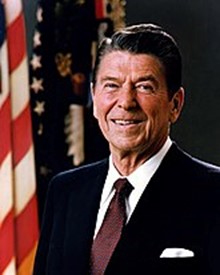
President Ronald Reagan, Republican
A 1983 cover article in Time Magazine emblazoned with the headline: The New Economy helps describe the time during Reagan’s presidency – as the economy transitioned from industrial to technology as one of the greatest bull markets in history took root.
One of Reagan’s economic pillars invokes passionate debate as “Reaganomics” and its corresponding tax cuts, deregulation, less government spending and pro-business policies is healthily debated among economists.
Reagan came into office with inflation running high and his Fed Chair Paul Volker is generally credited with taming inflation with tight monetary policy. The resulting policies helped reduce inflation from 12.5% to 4.4% and bring real GDP to an annual growth rate of 3.6%.
When he left office in 1989, his approval rating was 68%, among the highest of any president. And his 10.2% annualized returns during his presidency surely had something to do with that.
#16 of 22
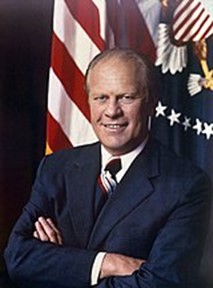
President Gerald Ford, Republican
President Ford was never actually elected Vice President or President, as he took over as vice president for the resigning Spiro Agnew and later took over when President Nixon resigned.
Generally regarded as a middle-of-the-pack president, President Ford took over during high inflation and slow growth times and at the tail-end of the punishing 1973-1974 bear market which pushed the S&P 500 and DJIA to drop by about half.
Economic historians generally credit the very respectable 10.8% annualized market returns during the Ford years more in part to the fact that the market was coming off of a low position versus anything President Ford did or didn’t do.
Next week will bring Part V and the list will include more presidents that you know and showcase presidencies recording enviable annual stock market returns.
Every four years, Washington D.C. and Wall Street converge as Americans elect a president and Wall Street tries to figure out what the outcome means for the stock and bond markets. And since so many hypotheses on this topic abound, it’s hard to keep track of them all.
For example, there are those who swear that Wall Street performs better when:
But what if we ranked the best and worst presidents simply by the performance of the stock market? Surely that would settle the debate as to which president was best for investors, right? Well, while it sounds easy – and the editors at Kiplinger did rank presidents from worst to best according to the stock market – there are a few big caveats to consider.
Caveat #1: Since the Office of the President was established in 1789, America has had 44 different presidents. And just three years later, Wall Street was officially founded on May 17, 1792 with the signing of the Buttonwood Agreement. But for the most part, there really was no “stock market” until the late 1800s, meaning it doesn’t make sense to include the first 22 presidents. So this analysis starts with the election of 1888.
Caveat #2. The Dow Jones Industrial Average was first published on May 26, 1896 and it followed the 12 largest companies in each sector. Today, it tracks 30 companies. The other very commonly-used index – the S&P 500 – although introduced in 1957 it does track data back to the late 1920s. The editors of Kiplinger decided to use the S&P 500 from President Hoover to the present and the DJIA for earlier.
Caveat #3. Returns do not include dividends. Over the last few decades, dividends have become a smaller component of total returns, so not including dividends will tend to favor more recent presidents.
Caveat #4. Data is not adjusted for inflation. This will tend to help presidents of inflationary times (Carter and Ford) and hurt presidents of deflationary times (Hoover and Bush).
Final Caveat. This one is sure to spark heated debate, but it seems fair to not include President Trump on this list simply because his presidency is still going.
Parts I and II brought us this list:
#1: President Herbert Hoover (-30.8% per year)
#2: President George W. Bush (-5.6% per year)
#3: President Grover Cleveland (-4.9% per year)
#4: President Richard Nixon (-3.9% per year)
#5: President Benjamin Harrison (-1.4% per year)
#6: President William Howard Taft (-0.1% per year)
#7: President Theodore Roosevelt (2.2% per year)
#8: President Woodrow Wilson (3.1% per year)
#9 of 22
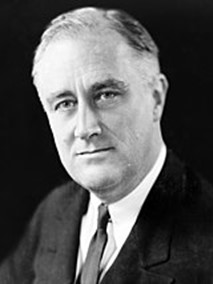
President Franklin Delano Roosevelt, Democrat
Franklin Delano Roosevelt – FDR – has the distinction of being the longest-serving president in U.S. history, having been elected to four consecutive terms, although he only served a little more than 12 years before dying in office.
Roosevelt took office in the middle of the Great Depression and within 100 days he helped push through massive federal legislation that kicked off the New Deal, which were federal programs designed to provide Americans help from the worst economic period in our country’s history.
Roosevelt is credited with speaking directly to all Americans with his “fire-side chat” radio addresses and he was also the first president on television. He spearheaded numerous programs for the unemployed, assisted farmers and helped bring an end to Prohibition. Other major programs implemented under Roosevelt include the Securities and Exchange Commission, the National Labor Relations Act, the Federal Deposit Insurance Corporation and Social Security.
While the U.S. economy improved significantly in the first 3 years after the Great Depression, a deep recession engulfed the country in 1937 and 1938, which explains the 6.2% per year performance.
#10 of 22

President John F. Kennedy, Democrat
John F. Kennedy – JFK – tragically did not finish his term as he was assassinated less than three years into his presidency.
Best known for presiding over the establishment of the Peace Corps, his handling of the Cuban Missile Crisis, and inspiring Americans to fly to the moon, economic historians recall Kennedy advocating that lower personal and corporate income taxes would stimulate more overall economic activity – a notion coined the “Laffer Curve” and later adopted during President Reagan’s time in office.
Kennedy did preside over a brief, 6-month bear market from December 1961 to June 1962 that saw the S&P 500 lose 28%, otherwise the 6.5% per year returns would have been higher.
#11 of 22

President Jimmy Carter, Democrat
President Carter is probably best known for what he did before and after he was president, as his “peanut farmer” label before becoming president and his heroic human rights work post-presidency are well documented. Often regarded as one of the smartest presidents of all time, the economic conditions of his presidency were besieged by low growth and high inflation, hardly great ingredients for out-sized stock market returns.
During Carter’s term in office, he did preside over the launch of the Department of Energy and the Department of Education, but the last few years of his single-term presidency were marked by the Iran hostage crisis and the 1979 Energy Crisis.
#12 of 22

President Warren G. Harding, Republican
At the time of his presidency, Harding was very popular, but after his death, his administration’s scandals came to light, including the Teapot Dome bribery scandal, considered one of the biggest political scandals of all time. Subsequently, historians now generally consider Harding to be one of the worst presidents of all time.
When Harding took office in 1921, the country was in the midst of a postwar economic decline and Harding’s plan was to reduce income taxes, increase tariffs to protect American farmers and support the build-out of America’s highway system.
Harding died about half-way through his term from a heart attack and it was only after his passing that various scandals became known. But despite the scandals and being considered one of the worst presidents, as measured by stock market performance, Harding’s presidency was just about in the middle.
Next week will bring Part IV and the list will include a couple of recent presidents that you know much more about as well as the beginning of presidencies recording double-digit annual stock market returns.
It is only natural that investors would want to find some way to sit out bear markets and get back just in time for the next bull run. The belief that you can foresee the direction of the stock market is a seductive one.
Some investors are confident that they can time it perfectly and snap up equities when prices are low and shift into cash or bonds when the market hits its peak. But investors run a big risk by selling when they believe stocks have reached their peak. They may turn a profit when cashing in their equity holdings, but they could also miss out on some of the market’s best cycles. Being absent from the market for only a few of the days or weeks with the highest percentage gains can decimate a portfolio’s returns over time.
Market timers who sell frequently also lose money to transaction costs and taxes and miss out to a large extent on the compounding effect that benefits investors who remain in the market consistently. Instead of trying to time the market, most investors are generally better off taking a buy-and-hold approach – but with the right investments.
Looking at the distribution of market gains coming off of the past 7 bear market cycles, we see that on average, 64% of the gains were captured in the first 6 months of year one. But that’s not to say that gains were absent in the next 6 months – the gains just slowed down.
| Bear Market Bottom | Gain in 1st Year of Rebound | Percent Gains, First 6 Months | Percent Gains, Last 6 Months |
|---|---|---|---|
| 1970 | 32% | 13% | 87% |
| 1974 | 38% | 90% | 10% |
| 1982 | 59% | 66% | 34% |
| 1987 | 23% | 80% | 20% |
| 1990 | 31% | 92% | 8% |
| 2002 | 32% | 31% | 69% |
| 2009 | 71% | 73% | 27% |
| 2020 | 47% | ? | ? |
| Average | 41% | 64% | 36% |
Source: S&P 500 total returns, Morningstar. Past performance does not guarantee future results. 2020 return period from March 23, 2020 through September 25, 2020
No one knows. But consider that coming off of the 2020 bear market bottom, the S&P 500 returned 47% from March 23rd to September 25th. Maybe in another six months we will look back and recognize that those first 6 months off of the 2020 bear market bottom captured 92% of the gains, just like what happened in 1990.
Or maybe we will realize that those first 6 months only captured 31% of the gains, like in 2002.
Trying to pinpoint the exact right time to invest in the stock market is an exercise in futility. If you have a longer period to invest, owning equities provides one of the most effective hedges against inflation and taxation available. Since it is impossible to know where the market might go from here, it makes sense to start investing now and continue investing on a regular basis, regardless of market conditions.
Remember: long-term investment success is achieved not by timing the market, but by time in the market.
Every four years, Washington D.C. and Wall Street converge as Americans elect a president and Wall Street tries to figure out what the outcome means for the stock and bond markets. And since so many hypotheses on this topic abound, it’s hard to keep track of them all.
For example, there are those who swear that Wall Street performs better when:
But what if we ranked the best and worst presidents simply by the performance of the stock market? Surely that would settle the debate as to which president was best for investors, right? Well, while it sounds easy – and the editors at Kiplinger did rank presidents from worst to best according to the stock market – there are a few big caveats to consider.
Caveat #1: Since the Office of the President was established in 1789, America has had 44 different presidents. And just three years later, Wall Street was officially founded on May 17, 1792 with the signing of the Buttonwood Agreement.
But for the most part, there really was no “stock market” until the late 1800s, meaning it doesn’t make sense to include the first 22 presidents. So this analysis starts with the election of 1888.
Caveat #2. The Dow Jones Industrial Average was first published on May 26, 1896 and it followed the 12 largest companies in each sector. Today, it tracks 30 companies. The other very commonly-used index – the S&P 500 – although introduced in 1957 it does track data back to the late 1920s. The editors of Kiplinger decided to use the S&P 500 from President Hoover to the present and the DJIA for earlier.
Caveat #3. Returns do not include dividends. Over the last few decades, dividends have become a smaller component of total returns, so not including dividends will tend to favor more recent presidents.
Caveat #4. Data is not adjusted for inflation. This will tend to help presidents of inflationary times (Carter and Ford) and hurt presidents of deflationary times (Hoover and Bush).
Final Caveat. This one is sure to spark heated debate, but it seems fair to not include President Trump on this list simply because his presidency is still going.
Part I brought us this list:
#1: President Herbert Hoover (-30.8% per year)
#2: President George W. Bush (-5.6% per year)
#3: President Grover Cleveland (-4.9% per year)
#4: President Richard Nixon (-3.9% per year)
#5 of 22

President Benjamin Harrison, Republican
How much do you really know about one-term President Benjamin Harrison? Trivia experts might recall that he was the grandson of President William Henry Harrison, which makes those two the only grandfather-grandson pair to have lived in the White House.
Harrison’s presidency was mostly unremarkable, although under his watch the federal budget passed the $1 billion threshold (today it is about $4.8 trillion).
During his time in office, he did help pass the McKinley Tariff, which imposed historical trade tariffs, as well as the Sherman Antitrust Act.
#6 of 22
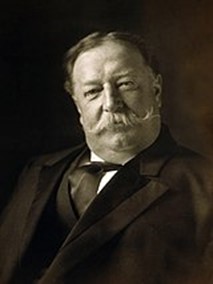
President William Howard Taft, Republican
Not unlike President Harrison, you probably don’t know much about President Taft either, another one-term president. And the stock market was as equally unremarkable during his presidency, losing 0.1% each year.
Besides his interesting mustache, Taft was the only person to ever serve as president and Chief Justice of the Supreme Court. So there’s that.
Taft did push for more businesses to be broken up through lawsuits brought under the Sherman Antitrust Act, including suits against Standard Oil and American Tobacco and U.S. Steel.
#7 of 2
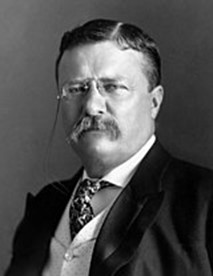
President Theodore Roosevelt, Republican
President Roosevelt is actually on the real Mount Rushmore, but he wouldn’t be if stock market performance was one of the criteria. And interestingly, Roosevelt was never supposed to be president, but became the youngest president ever after President McKinley was assassinated.
One of America’s more colorful presidents, Roosevelt could also be confrontational and controversial as he fully embraced his cowboy, Rough Rider brand whenever he could.
Roosevelt also continued breaking up companies by bringing lawsuits under the Sherman Antitrust Act and helped launch the Department of Commerce and Labor.
#8 of 22
President Woodrow Wilson, Democrat
President Woodrow Wilson accomplished a lot during his two terms, including bringing back federal income taxes, creating a division which eventually became the Internal Revenue Service and introducing the Federal Reserve System.
In addition, on April 2, 1917, Wilson led the country into World War I when he asked Congress for a declaration of war against Germany, arguing that Germany was engaged in "nothing less than war against the government and people of the United States."
Generally considered a president who accomplished a great deal, the stock market during his presidency was rather lackluster, in part because of the cloud of WWI.
Next week will bring Part III and the list will include a few presidents that you likely know much more about. Including a peanut-farmer turned president.
Retirement is a major milestone that brings many life changes. One thing that doesn't change for most people: the fear of running out of money. According to the Transamerica Center for Retirement Studies, the most frequently reported retirement worry is outliving savings and investments. Across all ages, 51% of respondents cited this concern, and 41% of retirees claim the same fear. Additionally, only 46% of retirees think they've built a nest egg large enough to last through retirement.
Now is the time to face your fears. Take a look at a dozen ways you could go broke in retirement and learn how to avoid them. Some you can avert with careful planning; others you have little control over. But you can prepare your finances to make the best of whatever may come.
You abandon stocks
It's true that stocks can be risky. For example, in 2020, the Standard & Poor's 500-stock index, a benchmark for many investors, experienced several wild swings. So once you're retired, you might be inclined to move your money out of stocks altogether and instead focus on preserving your wealth.
But that could be a mistake. Without stocks, you might not get the growth that you need. You need your money to continue to grow through those 20 to 30 years of retirement to outpace inflation and help maintain your lifestyle.
You invest too much in stocks
On the other hand, you are right: Stocks are risky and you don't want to have too much in stocks, because of the volatility of the market.
If you're hesitant to make portfolio adjustments, consider target-date mutual funds instead. These funds are designed to reduce exposure to stocks gradually over time as you approach (and surpass) your target date for retirement. Not all target-date funds are the same, even if they sport the same retirement target year in their names. Be aware of specific funds' expenses and asset-allocation strategies to ensure they are affordable and fit your needs.
You live too long
More time to enjoy the life you love is a joy; trying to afford it can be a pain. Current retirees are expecting a long retirement, a median of 28 years, according to the Transamerica Center for Retirement Studies. And 41% of retirees expect their retirements to go on for more than three decades. Women have to plan for an even longer life. According to the Centers for Disease Control and Prevention, a man who was age 65 can expect to live to age 83, on average, while a woman of the same age may reach 85.5 years.
When saving for retirement, plan for a long life. But if it starts to look like your nest egg will come up short, you have to adjust your budget. For example, it might behoove you to downsize your home or relocate to an area with low taxes and living costs. You may even consider finding ways to pull in extra income, such as starting an encore career, taking a part-time job or cashing in on the sharing economy, if you can.
You spend too much
It might seem obvious, but most of us – retired or not
– are guilty of making this mistake and could benefit from a reminder to quit it. In fact, according to the Employee Benefit Research Institute, nearly 46% of retired households spent more annually in their first two years of retirement than they did just before retiring.
And retirees on a fixed income are particularly vulnerable to the ill effects of committing this error. For retirees, budgeting is more important than ever.
You rely on a single source of income
Multiple income streams are better than one, especially in retirement. Case in point: Social Security is the primary source of income for 61% of retirees, according to the Transamerica Center for Retirement Studies. And 44% of retirees report that one of their biggest financial fears is that Social Security will be reduced or cease to exist in the future. Based on current projections, Social Security will only be able to pay 77% of promised retirement benefits beginning in 2035.
A pension, which 42% of retirees use as a source of income, or inheritance likely can't stand alone to support you through retirement, either. But when you put them all together, along with your self-funded retirement accounts, such as 401(k)s and IRAs, then you have a more stable and diversified financial base to rely on throughout your retirement.
You can't work
Another good reason for needing plenty of savings and multiple streams of income to support you in retirement: You can't count on being able to bring in a paycheck if you need it. While 51% of workers expect to continue working some in retirement, only 6% of retirees report working in retirement as a source of income.
Whether you work is not always up to you. In fact, 60% of retirees left the workforce earlier than planned, according to the Transamerica Center for Retirement Studies. Of those, 66% did so because of employment-related issues, including organizational changes at their companies, losing their jobs and taking buyouts. Health-related issues, either their own ill health or that of a loved one, was cited by 37%. Just 16% retired early because they felt they could afford to.
You get sick
As you age, your health is bound to deteriorate, and getting the proper care is expensive. According to a report from the Employee Benefit Research Institute, a 65-year-old man would need to save $68,000 to have a 50% chance of affording his health-care expenses in retirement (excluding long-term care) that aren't covered by Medicare or private insurance. To have a 90% chance, the same man would need to save $124,000. The news is worse for a 65-year-old woman, who would need to save $89,000 and $140,000, respectively. Be sure you're doing all you can to cut health-care costs in retirement by considering supplemental MediGap and Medicare Advantage plans and reviewing your options every year.
Long-term care bumps up the bill even more. For example, the median cost for adult day health care in the U.S. is $1,473 a month; for a private room in a nursing home, it costs a median of $7,698 a month, according to Genworth. No wonder 44% of retirees fear declining health that requires long-term care and 31% fear cognitive decline, dementia and Alzheimer's disease. Consider getting long-term-care insurance to help cover those costs and use these tactics to make it affordable.
You tap the wrong retirement accounts
This mistake probably won't leave you flat broke but lacking a smart withdrawal strategy can cost you. A more tax-efficient way to go might be to draw down the principal from your maturing bonds and certificates of deposit first, since they are no longer bearing interest.
Then, sell from your taxable accounts, for which you only have to pay the capital-gains tax. Finally, withdraw from your tax-deferred and Roth accounts, in that order.
You don't consider taxes
Needing to be tax-smart extends beyond your drawdown strategy. Where you live impacts what you pay in taxes big time. That's part of why so many people flock to Florida and Arizona after they retire. Along with the warm weather and ample sunshine, those states offer two of the country's ten most tax-friendly environments for retirees. Other states with retirement-friendly tax codes include Alaska, Georgia and Nevada.
Of course, taxes alone shouldn't dictate where you live in retirement. Friends, family and other community ties play a major role. But you have to keep state and local taxes in mind (especially sales taxes, property taxes and taxes on retirement income) when planning your budget.
You bankroll the kids
A mistake made out of love is a mistake all the same. You may feel obligated to assist your children financially, paying for college, contributing to the down payment for a first home and covering them in emergencies, for example. But doing so at the expense of your retirement security may cause bigger problems for both you and your kids in the long run.
You have to take care of yourself first, so you can help your kids later.
You are underinsured
Cutting costs in retirement is important but scrimping on insurance might not be the best place to do it. Adequate health coverage, in particular, is essential to prevent a devastating illness or injury from wiping out your nest egg. Medicare Part A, which covers hospital services, is a good start. It's free to most retirees. But you'll need to pay extra for Part B (doctor visits and outpatient services) and Part D (prescription drugs). Even then, you'll probably want a supplemental medigap policy to help cover deductibles, copayments and such.
And don't forget about other forms of insurance. As you age, your chances of having accidents both at home and on the road increase. In fact, according to the Centers for Disease Control and Prevention, an average of 586 adults who are 65 and older are injured every day in car crashes. Beyond your own medical expenses, all it can take is a single adverse ruling in an accident-related lawsuit to drain your retirement savings. Review the liability coverage that you already have through your auto and home policies. If it's not sufficient, either bump up the limits or invest in a separate umbrella liability policy that will kick in once your primary insurance maxes out. Premiums on a $1 million umbrella policy might run about $300 a year.
You get scammed
Older adults are particularly vulnerable to scam artists and fraudsters. The FBI notes that seniors are prime targets for such criminals because of their presumed wealth, relatively trusting nature and typical unwillingness to report these crimes. Even worse, the perpetrators may be closer than you think. According to a study from the National Committee for the Prevention of Elder Abuse, an estimated one million elders lose $2.6 billion a year due to financial abuse – and family members and caregivers are the perpetrators 55% of the time.
Some common scams to watch out for: Con artists may pretend to represent Medicare to collect your personal information. Cheap prescription drugs marketed online could be knock-offs, and you may be handing over your credit card information in exchange for endangering your health. Charity workers seeking donations for disaster aid might actually pocket the money for themselves.